A Guide to Logging and Debugging in Java


Abdul D - Last Updated:

Logging and Debugging in Java: Why Does it Matter?
During the development of your program, you might rely on simple println() statements to trace program execution flows and identify issues in your code. But as projects grow in size and complexity, print statements quickly become messy. A better approach to tracing program execution is logging, an approach that provides a consistent and organized way to track your application’s behavior, allowing you to systematically identify and resolve issues.
In this guide, we’ll explore how to set up logging in Java, use essential debugging tools effectively, and apply best practices to create stable and maintainable applications.
We’ll also look at how Sentry can help you monitor and manage errors in your Java applications. By understanding the fundamentals and advanced techniques, you’ll be equipped to tackle issues confidently within your Java projects.
How to Set Up Logging in Java
You may have used System.out.println() to log and debug your code, for example:
System.out.println()Click to Copypublic class Main { public static void main(String[] args) { System.out.println("Debugging: Starting the program"); int result = 5 + 3; System.out.println("Debugging: Result is " + result); } }
Would output:
Debugging: Starting the program
Debugging: Result is 8
This kind of console logging can be helpful for small projects or quick tests, but it has many limitations. Unsaved console logs disappear when the program stops, making it difficult to keep a history of what happened. They also don’t allow you to categorize messages by severity, which makes it hard to spot critical issues in the output.
Basic logging in Java can be achieved using the built-in java.util.logging package. This built-in framework allows you to easily record and output different events in your application, such as informational messages, warnings, or errors.
Using java.util.logging, you can specify log levels to indicate the importance of each message:
SEVERE: Indicates a severe error that may prevent the application from functioning correctly.WARNING: Indicates a potential issue that may require attention.INFO: Provides general information about the application’s execution progress.CONFIG: Indicates configuration-related messages.FINE, FINER, FINEST:Used for debugging purposes to provide detailed information.
You can use these log levels with the following syntax: logger.<LEVEL>("<YOUR_MESSAGE_HERE>").
You may need to add the following to your module-info.java file to allow logging:
requires java.logging;
Here’s how you can set up a logger and log messages with different levels:
import java.util.logging.Logger;Click to Copyimport java.util.logging.Logger; public class LoggingLevelsExample { private static final Logger logger = Logger.getLogger(LoggingLevelsExample.class.getName()); public static void main(String[] args) { logger.fine("This is an info message"); logger.config("This is a configuration message"); logger.info("This is an info message"); logger.warning("This is a warning message"); logger.severe("This is a severe error message"); } }
This outputs:
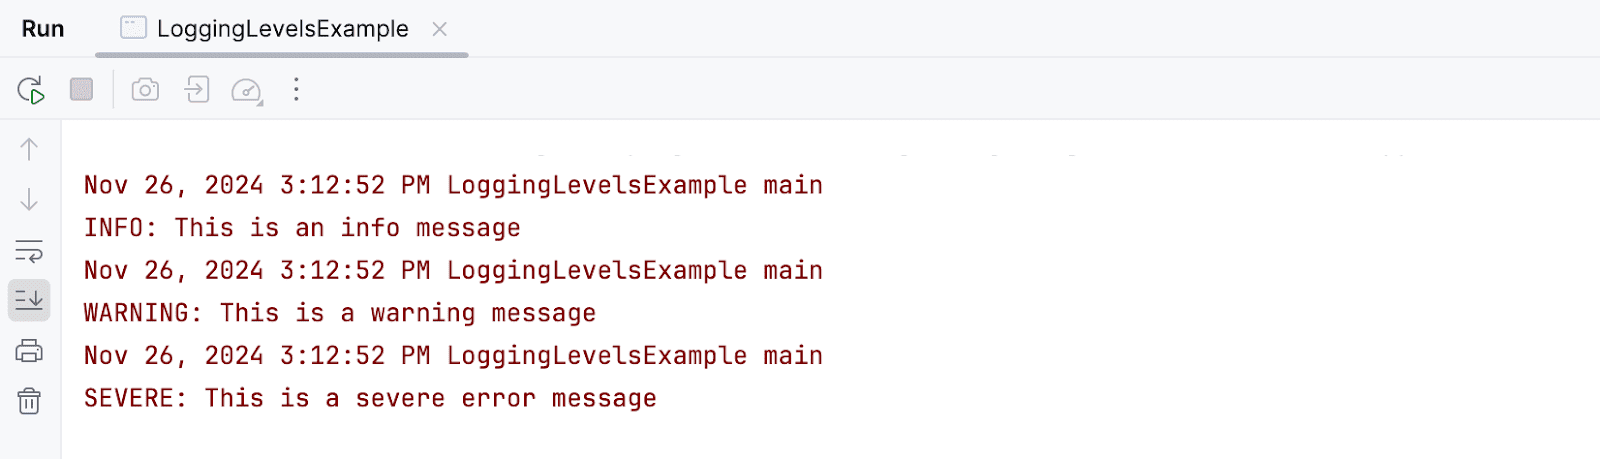
Output of the logging example
Notice how the log messages are timestamped and include the class name and method where the log statement was called. This information can be invaluable when tracking down bugs in complex applications.
Setting the Log Level in Java
In the example above you’ll notice that only the INFO, WARNING, and SEVERE messages are logged, while the CONFIG and FINE messages are not.
This is because the default log level is set to INFO, which means only messages of INFO level and above will be recorded.
Back to the Log level hierarchy:
SEVEREWARNINGINFOOnly this level and above are logged by defaultCONFIGFINEFINERFINEST
You can change the log level to control which messages are recorded. For example, to log messages of FINE level and above, you can use a ConsoleHandler to set the log level to FINE:
ConsoleHandler to set the log level to FINE:Click to Copyimport java.util.logging.Logger; import java.util.logging.Level; import java.util.logging.ConsoleHandler; public class LoggingLevelsExample { private static final Logger logger = Logger.getLogger(LoggingLevelsExample.class.getName()); public static void main(String[] args) { logger.setLevel(Level.FINE); logger.setUseParentHandlers(false); ConsoleHandler handler = new ConsoleHandler(); handler.setLevel(Level.FINE); // We need to create a new ConsoleHandler to override the default level logger.addHandler(handler); logger.fine("This is a debug message"); logger.config("This is a configuration message"); logger.info("This is an info message"); logger.warning("This is a warning message"); logger.severe("This is a severe error message"); } }
Now the output will include the FINE and CONFIG messages:
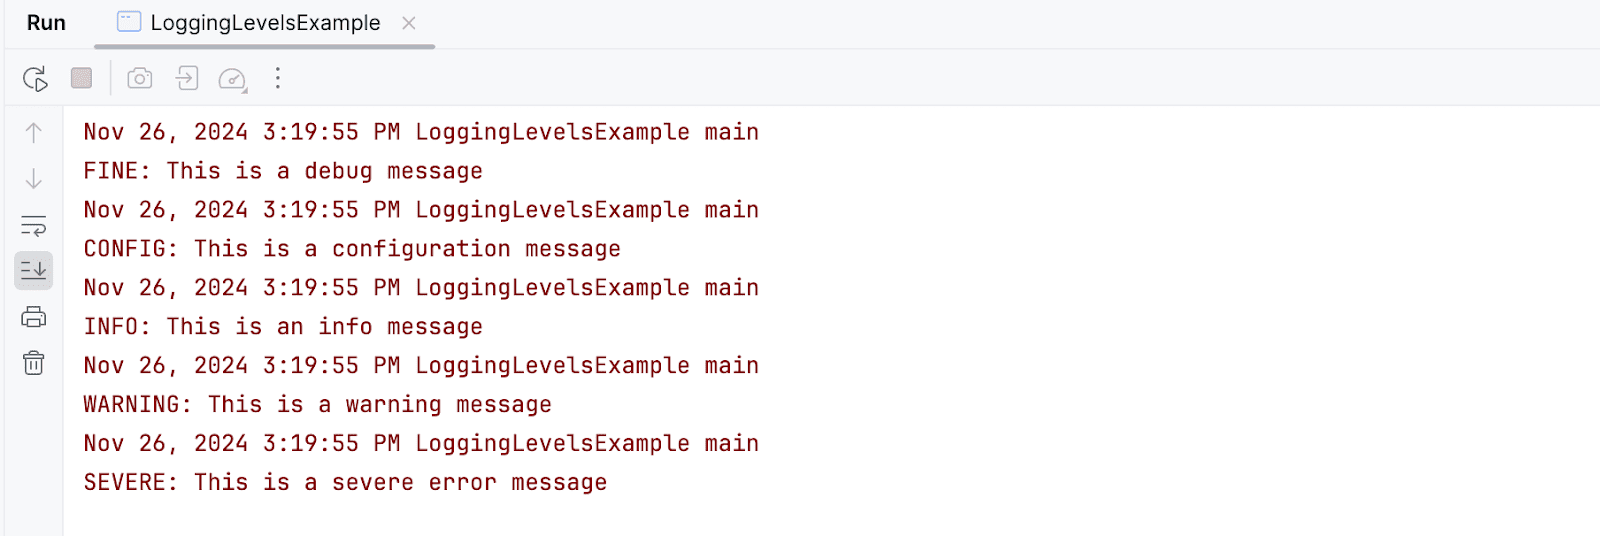
Output of the logging example with FINE level
How to Log to a File in Java
You can also save logs to a file, which allows you to keep a persistent record of your application’s behavior for future analysis. Saving logs to a file makes it easier to track down issues after the application has stopped running or to compare logs from different runs to identify patterns across different configurations.
Let’s extend the previous example to save the log messages to a file. We’ll use the FileHandler class to write logs to a file called application.log:
FileHandler class to write logsClick to Copyimport java.util.logging.Logger; import java.util.logging.FileHandler; import java.util.logging.SimpleFormatter; public class FileLoggingExample { private static final Logger logger = Logger.getLogger(FileLoggingExample.class.getName()); public static void main(String[] args) { try { FileHandler fileHandler = new FileHandler("application.log", true); fileHandler.setFormatter(new SimpleFormatter()); logger.addHandler(fileHandler); } catch (Exception e) { logger.severe("Failed to set up file handler for logging"); } logger.info("This is an info message"); logger.warning("This is a warning message"); logger.severe("This is a severe error message"); } }
Running this code saves the log messages to a file named application.log in the project directory. You can then open this file to review the logs:
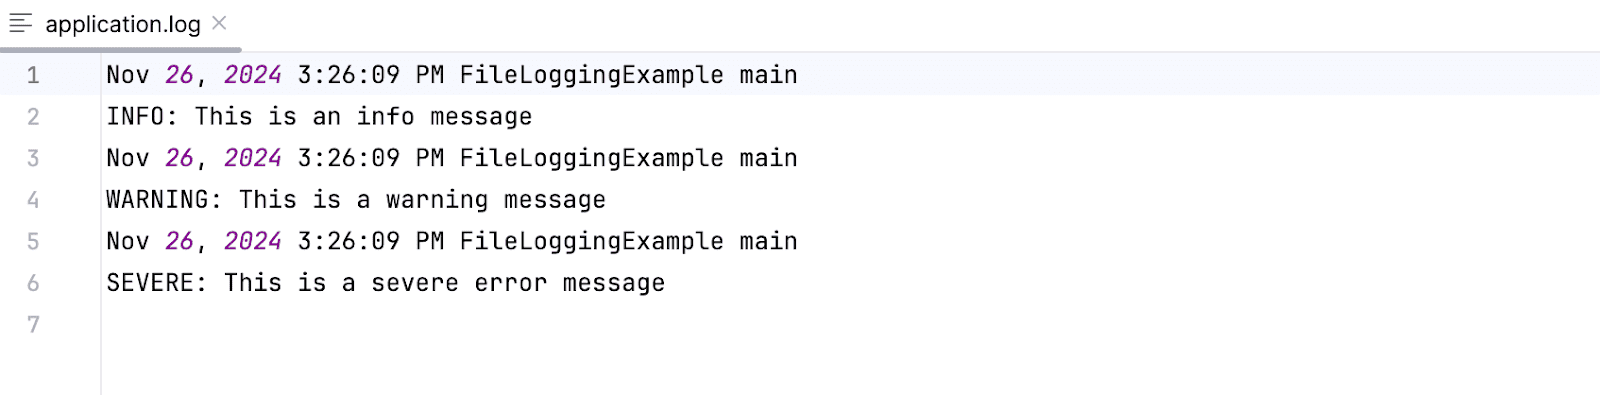
Screenshot of the log file content
Logging Variables and Exceptions in Java
When debugging, it’s often helpful to log the values of variables or exceptions in Java to understand the state of the application at a particular point in time.
Suppose we have a method that divides two numbers, and we want to log the values of the numbers being divided:
example: Logging the values of the numbers being divided Click to Copyimport java.util.logging.Logger; public class LoggingVariablesExample { private static final Logger logger = Logger.getLogger(LoggingVariablesExample.class.getName()); public static void main(String[] args) { int a = 50; int b = 10; logger.info("Dividing " + a + " by " + b); try { int result = divide(a, b); logger.info("Result: " + result); } catch (ArithmeticException e) { logger.severe("Error: " + e.getMessage()); } } public static int divide(int x, int y) { return x / y; } }
This will output:2024-11-18 14:30:00 INFO LoggingVariablesExample: Dividing 50 by 10
2024-11-18 14:30:00 INFO LoggingVariablesExample: Result: 5
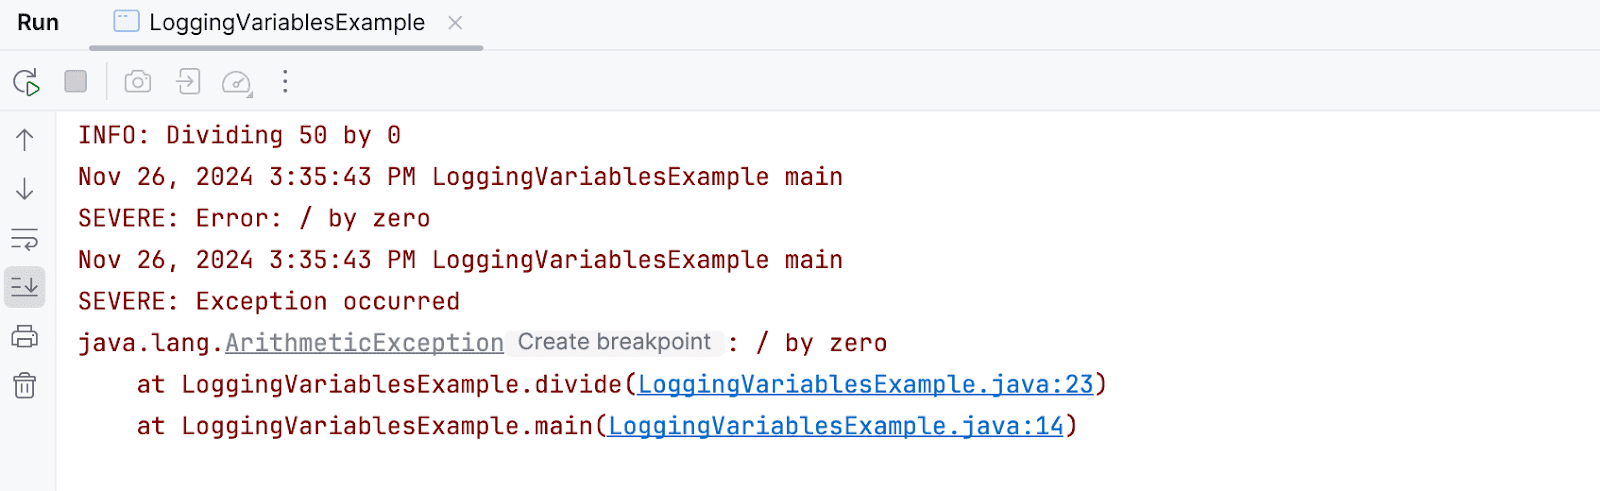
Now, say we want to log an exception that occurs when dividing by zero, and we want to see the stack trace. We’ll change the b variable’s value to 0:
stack trace for logging exceptionClick to Copyimport java.util.logging.Logger; import java.util.logging.Level; public class LoggingVariablesExample { private static final Logger logger = Logger.getLogger(LoggingVariablesExample.class.getName()); public static void main(String[] args) { int a = 50; int b = 0; logger.info("Dividing " + a + " by " + b); try { int result = divide(a, b); logger.info("Result: " + result); } catch (ArithmeticException e) { logger.severe("Error: " + e.getMessage()); logger.log(Level.SEVERE, "Exception occurred", e); } } public static int divide(int x, int y) { return x / y; } }
This will output:
Logging output for java exampleClick to CopyNov 21, 2024 9:48:49 PM LoggingVariablesExample main INFO: Dividing 50 by 0 Nov 21, 2024 9:48:49 PM LoggingVariablesExample main SEVERE: Error: / by zero Nov 21, 2024 9:48:49 PM LoggingVariablesExample main SEVERE: Exception occurred java.lang.ArithmeticException: / by zero at LoggingVariablesExample.divide(LoggingVariablesExample.java:23) at LoggingVariablesExample.main(LoggingVariablesExample.java:14)
Notice how the stack trace is included in the log message, which lets us know exactly where the exception occurred.
For more on Java exception handling, we did a full breakdown here.
Best Practices for Logging in Java
Here are some best practices to keep in mind:
Set the optimal logging level: Logs are helpful only when you can use them to track down important errors that need to be fixed. Depending on the specific application, be sure to set the optimal logging level. Logging too many events can be suboptimal from a debugging viewpoint, as it’s difficult to filter through the logs to identify errors that require immediate attention.
Avoid logging sensitive information: Be cautious about logging sensitive information such as passwords, API keys, or personal data.
Rotate the log files to facilitate easier debugging: Log files for extensive applications with several modules are likely to be large. Rotating log files periodically can make it easier to debug such applications. Rotate log files by setting a maximum file size or time interval after which a new log file is created. This way, you can easily locate issues by looking at the most recent log files.
For example, you can set up a FileHandler with the following syntax:
file handler in javaClick to Copynew FileHandler("<filename>.log", <maxFileSize>, <numFiles>)
This will create a new log file when the current file reaches the specified size, up to the maximum number of files specified.
file handler 2Click to CopyFileHandler fileHandler = new FileHandler("application.log", 1024 * 1024, 10, true); // 1MB file size, 10 files
Use log formatting to make logs more readable: Log formatting can help make your logs more readable and consistent. You can use a Formatter to customize the format of your log messages. For example, you can include the timestamp, log level, class name, and message in a specific format.
java formatterClick to CopySimpleFormatter formatter = new SimpleFormatter() { private static final String format = "[%1$tF %1$tT] [%2$-7s] %3$s %n"; @Override public synchronized String format(LogRecord lr) { return String.format(format, new Date(lr.getMillis()), lr.getLevel().getLocalizedName(), lr.getMessage() ); } }; fileHandler.setFormatter(formatter);
This will format the log messages with a timestamp down to the second, the log level, and the message:'
formatted java logsClick to Copy[2024-11-18 14:30:00] [INFO ] This is an info message [2024-11-18 14:30:00] [WARNING] This is a warning message [2024-11-18 14:30:00] [SEVERE ] This is a severe error message

Java Debugging 101: How to Debug in Eclipse
Java debugging involves tools and techniques that help identify and fix issues in your code. Understanding how to effectively use breakpoints, inspect variables, and step through the code is key to debugging faster.
Let’s debug our division example in Eclipse. Eclipse is one of the most popular Java IDEs and offers powerful debugging features that make it easier to find and resolve bugs.
We’ll be debugging the following code, which has an error where b is set to x - x rather than x + x:
public class DebugExampleClick to Copypublic class DebugExample { public static void main(String[] args) { int a = 50; int x = 5; int b = x - x; int result = divide(a, b); System.out.println("Result: " + result); } public static int divide(int x, int y) { int answer = x / y; // Set a breakpoint here return answer; // This will throw an exception if y is 0 } }
Let’s say we wanted to set the value of the variable b by adding x + x, but we made an error and set the value by subtracting x - x, as in the code above. This would lead to the variable b holding a value of zero. This value is set as the value for the y argument in the divide method, leading to a division-by-zero error.
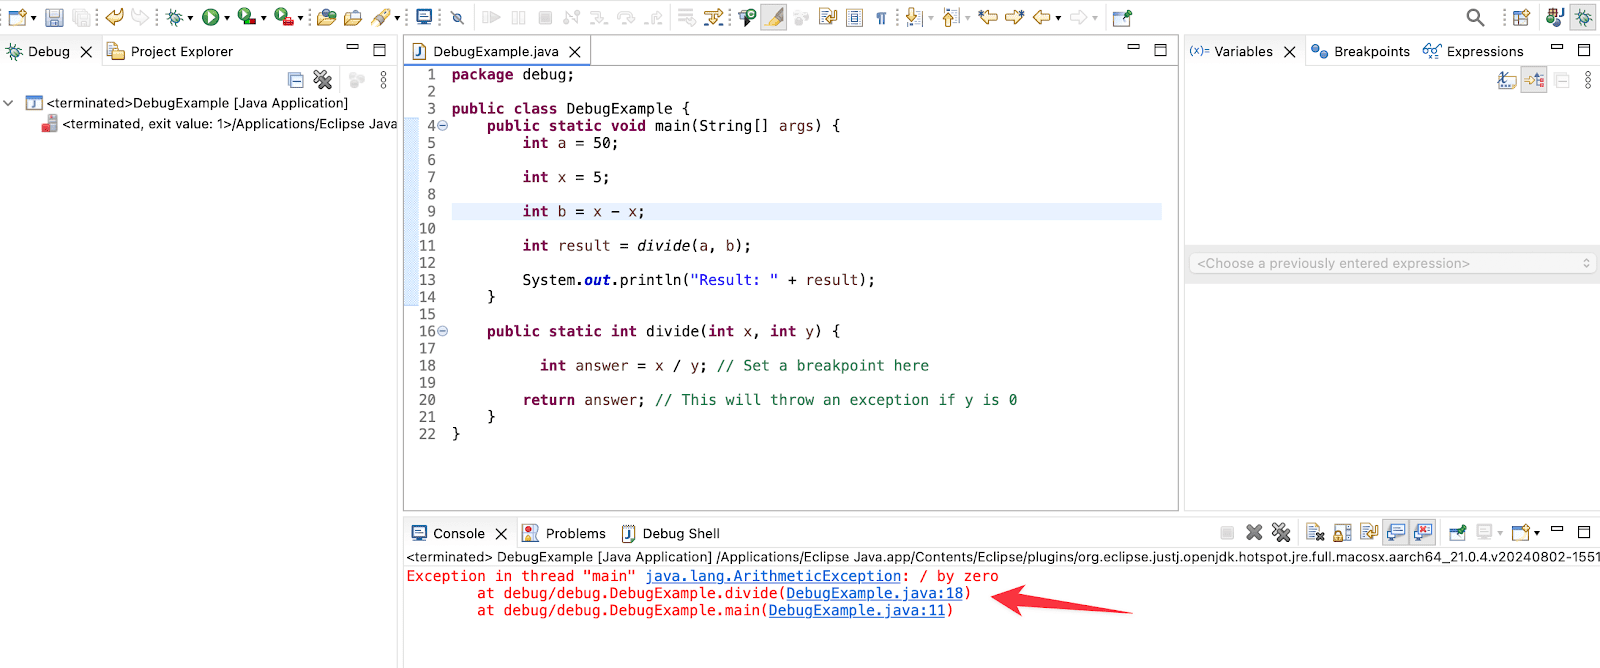
Stack trace
The divide() function will throw an ArithmeticException when trying to divide by zero. Ideally, we would want to add an exception handler to handle this case, but for the purpose of debugging, we will focus on identifying the issue and fixing it temporarily.
Notice the program execution stack trace shows us the line where the error occurred in our code. We can then set a breakpoint on this line to start debugging.
Let’s debug this example in Eclipse:
1. Set a breakpoint: Click in the left margin of the code editor to set a breakpoint. A breakpoint is a marker that tells the debugger to pause the program at that specific line. In the above code, set a breakpoint on the line int answer = x / y;. This will allow you to pause the program before the division by zero occurs.
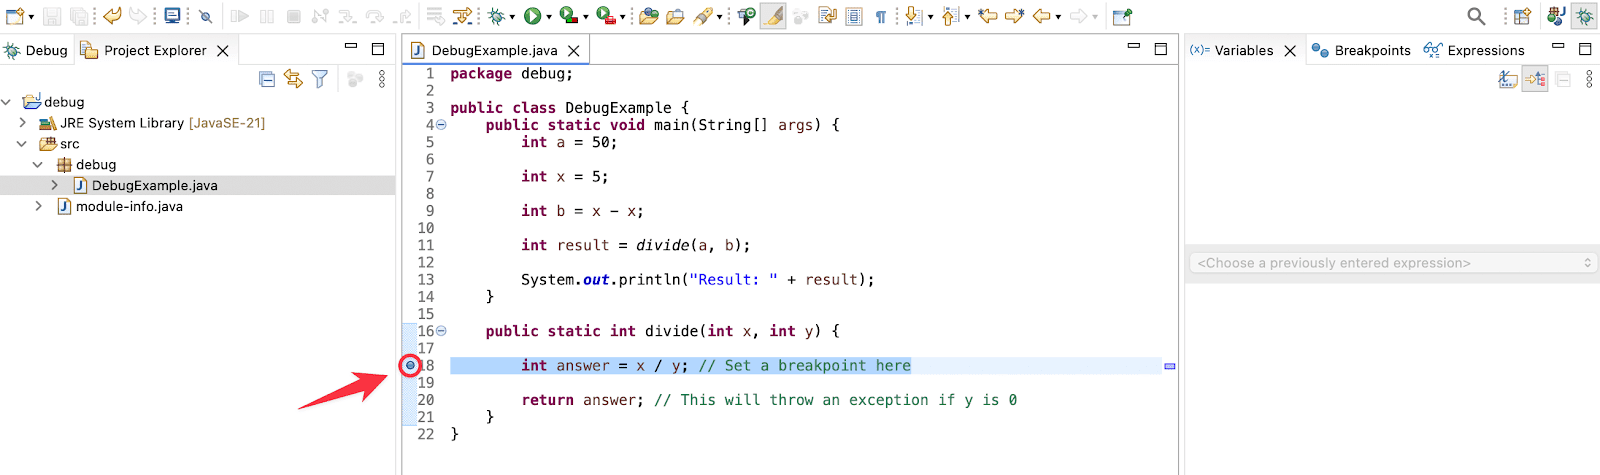
Setting a breakpoint
2. Start the program in debug mode: Click the bug icon to start the program in debug mode. This allows you to run the code up to the breakpoint and inspect the state of your program.
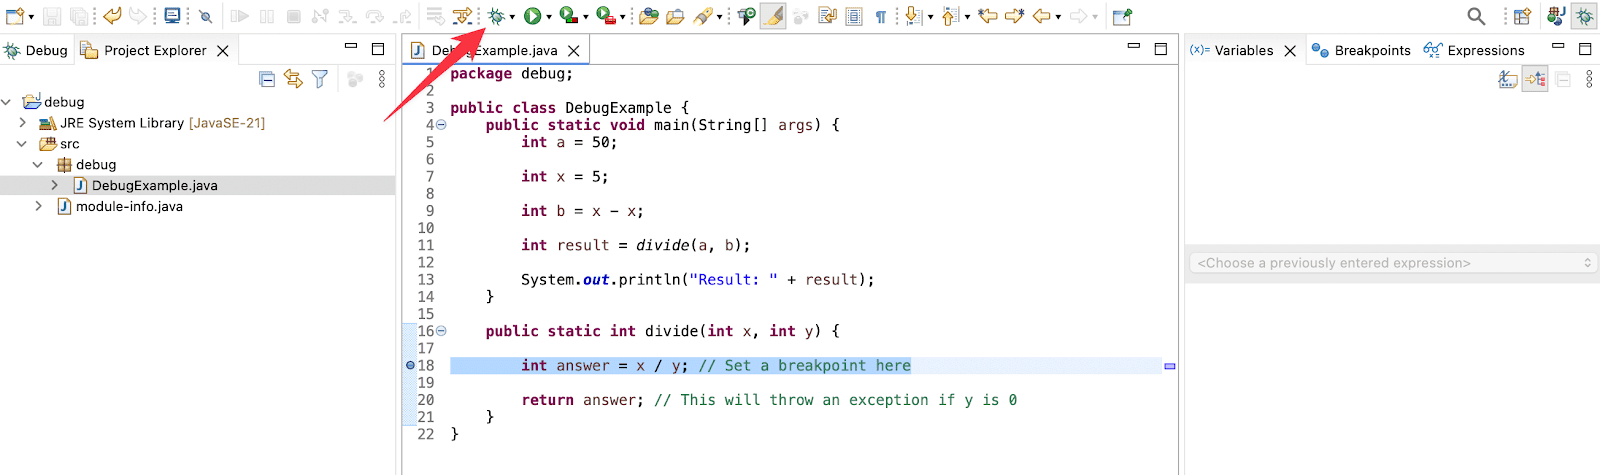
Starting debug mode
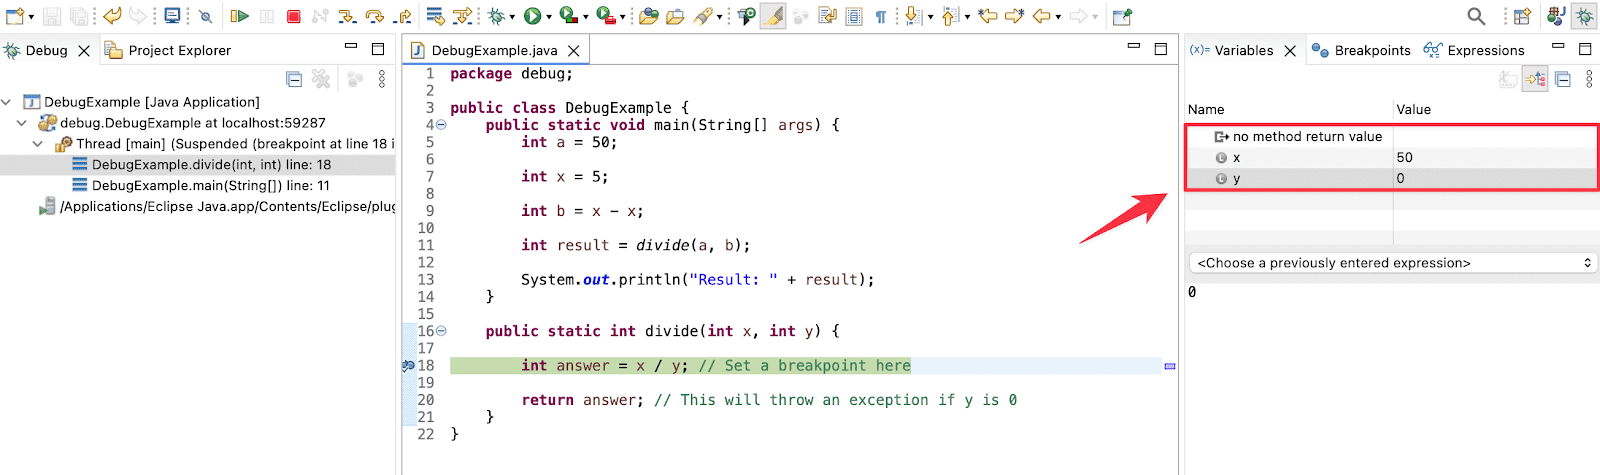
3. Inspect variables at the breakpoint: Once the program pauses at the breakpoint, you can inspect the values of variables in the Variables view. In this case, you’ll notice that the value of y is 0, which leads to the division-by-zero error.
Inspecting variables and stepping through code
4. Temporarily fix the issue: We can temporarily fix the issue by directly changing the value of y to 10, which is 5 + 5, in the variables view pane, and resume program execution to see a result.
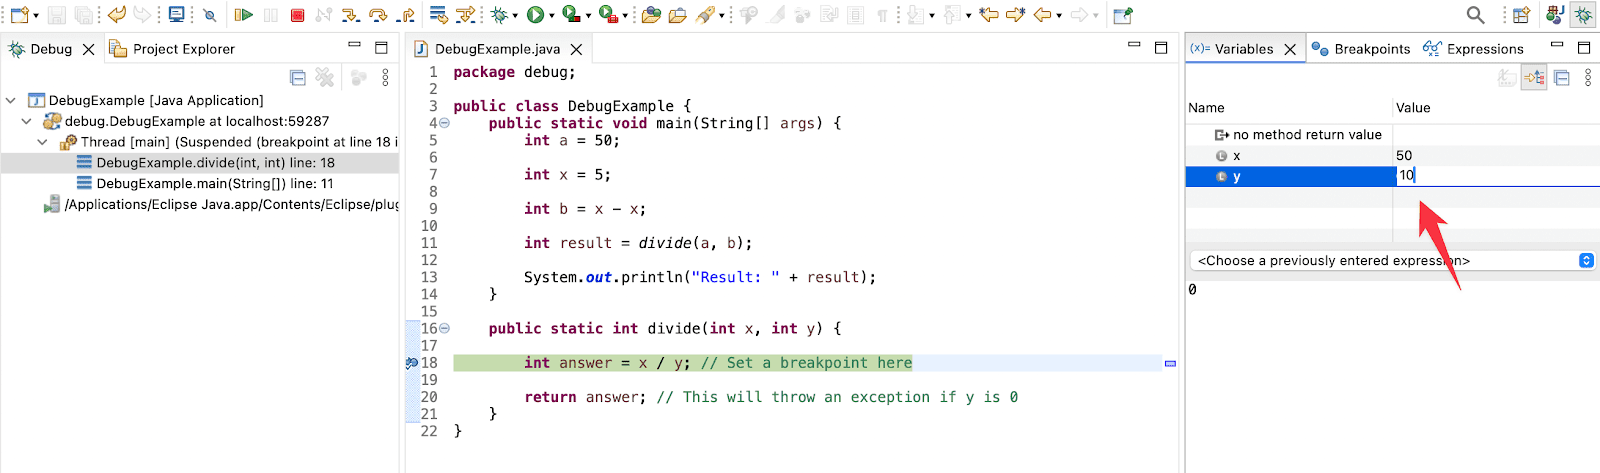
Temporary fixing the issue
Clicking the Resume button will continue running the program after making the temporary fix. This will allow you to see a result without the division by zero error.

Click the resume button to continue running the program
You can then correct the code responsible for setting the variable b value to zero and leading to the y argument holding a zero value. Change the code from int b = x - x; to int b = x + x; and run the program to see the corrected output:
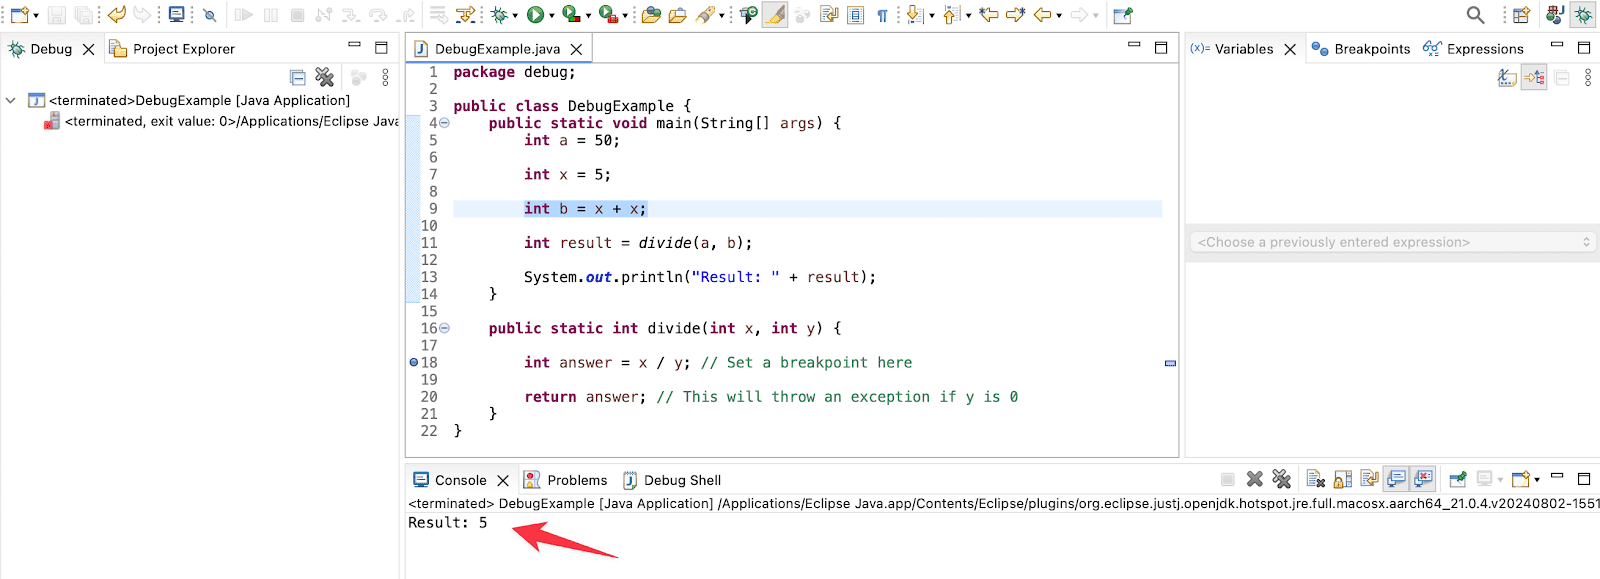
Corrected output after temporary fix
As you can see from this example, debugging allows you to identify issues in your code, understand how the program behaves, and make the necessary corrections to ensure it runs correctly.
Using Third-Party Java Logging Libraries
While the built-in java.util.logging package is sufficient for basic logging needs, third-party logging libraries offer additional features and flexibility that can be beneficial in more complex projects.
Two popular logging libraries in the Java ecosystem are Log4j and Logback. These libraries offer features such as logging to multiple destinations, filtering log messages, and configuring log levels dynamically.
To learn more about these libraries and how they can be integrated into your Java projects, you can refer to the official documentation:
Sentry offers integration with both libraries. Consult the guides to learn how to set up Sentry with Log4j and with Logback.
How Sentry Can Help with Logging and Debugging in Java
Sentry helps you track issues in real time and provides insights into the errors that occur in your application. You can integrate Sentry into your Java application to catch errors and monitor performance.
To get started, you’ll need to add the Sentry Java SDK to your project and configure it using your data source name (DSN).
You can obtain a DSN by creating a project in the Sentry dashboard and navigating to [Your-Project] > Project Settings > Client Keys (DSN).
You can add Sentry to your project by including the plugin in your build tool. Here’s how you can add Sentry to your project using Maven:
Add the following configuration in the pom.xml file (replace the values with your own):
<dependencies>
	<dependency>
		<groupId>io.sentry</groupId>
		<artifactId>sentry</artifactId>
		<version>7.18.0</version>
	</dependency>
</dependencies>
<build>
	<plugins>
		<plugin>
			<groupId>io.sentry</groupId>
			<artifactId>sentry-maven-plugin</artifactId>
			<version>0.0.8</version>
			<extensions>true</extensions>
			<configuration>
				<debugSentryCli>true</debugSentryCli>
				<org><"YOUR_ORG_HERE">
				</org>
				<project>java</project>
				<authToken>${env.SENTRY_AUTH_TOKEN}</authToken>
			</configuration>
			<executions>
				<execution>
					<goals>
						<goal>uploadSourceBundle</goal>
					</goals>
				</execution>
			</executions>
		</plugin>
	</plugins>
</build>
Consult the Sentry for Java documentation for detailed instructions on how to set up Sentry in your Java project.
Let’s see how to integrate Sentry into our example division program from earlier:
import io.sentry.Sentry;
import java.lang.Exception;

public class Main {

    public static void main(String[] args) {

        Sentry.init(options -> {
            options.setDsn("YOUR_DSN_HERE");
            options.setTracesSampleRate(1.0);
            options.setDebug(true);
        });

        try {

            int result = divide(50, 0); // This will throw an exception
            System.out.println("Result: " + result);

        } catch (Exception e) {
            Sentry.captureException(e); // This will send the exception to Sentry
        }
    }

    public static int divide(int x, int y) {
        return x / y;
    }

}
After configuring the application with your DSN value, you can run your Java application and any errors will be logged to your Sentry project.
Now that you’ve got Sentry capturing exceptions, let’s look at how you can also send structured logs directly from your Java app.
Sending structured logs in Java
Now that you’ve got Sentry capturing exceptions, let’s look at how you can also send structured logs directly from your Java app. For further details, check out or Logs documentation.
Once you’ve got basic logging in place, you can take things a step further with structured logs. Instead of just shipping plain-text messages, structured logs capture key–value pairs—like user.id or order.total—that make your data searchable and filterable inside Sentry. That means you can find what you need faster, without digging through endless lines of log output.
Sentry can store your app’s logs in a structured format so you can filter and search by attributes (key–value pairs) right in the Logs UI. In Java, this is available in the Sentry Java SDK 8.12.0+. First, enable Logs when you initialize the SDK.
import io.sentry.Sentry;

Sentry.init(options -> {
  options.setDsn("https://examplePublicKey@o0.ingest.sentry.io/0");

  options.getLogs().setEnabled(true);

});
Once enabled, you can send logs with Sentry.logger(). Use the level-specific helpers for simple messages:
import io.sentry.Sentry;

Sentry.logger().info("A simple log message");
Sentry.logger().error("A %s log message", "formatted");
For richer, structured logs, attach custom attributes with Sentry.logger().log(...). These attributes become searchable fields in Sentry:
import io.sentry.Sentry;
import io.sentry.SentryAttribute;
import io.sentry.SentryAttributes;
import io.sentry.SentryLogLevel;
import io.sentry.logger.SentryLogParameters;

Sentry.logger().log(
    SentryLogLevel.FATAL,
    SentryLogParameters.create(
        SentryAttributes.of(
            SentryAttribute.stringAttribute("my.string-attribute", "some-value"),
            SentryAttribute.booleanAttribute("my.bool-attribute", true),
            SentryAttribute.integerAttribute("my.int-attribute", 42),
            SentryAttribute.doubleAttribute("my.double-attribute", 3.12)
        )
    ),
    "log message %s",
    "param1"
);
In the Logs UI, Sentry also adds helpful defaults like environment, release, and (if a trace is active) trace.parent_span_id. For formatted messages, you’ll see message.template and numbered message.parameter.X attributes, which makes templated logs easier to query. For example, the call Sentry.logger().error("A %s log message", "formatted") produces message.template: "A %s log message" and message.parameter.0: "formatted".
If you want to tweak or drop logs before they’re sent, use beforeSend on the Logs options:
import io.sentry.Sentry;

Sentry.init(options -> {
  options.setDsn("https://examplePublicKey@o0.ingest.sentry.io/0");

  options.getLogs().setBeforeSend((logEvent) -> {
    // Modify the event here:
    logEvent.setBody("new message body");
    return logEvent;
  });

});
Already using a logging framework? You can forward those logs to Sentry too. Sentry provides integrations for Spring Boot (Logback), Logback, Log4j2, and JUL, so your existing logs can flow into Sentry alongside errors and traces.
Structured logging makes your Java logs far more useful. Each attribute you attach becomes a searchable, filterable field in Sentry, so you can slice and dice logs by environment, release, or any custom key you define. In other words, less time digging through raw text, and more time actually fixing what went wrong.
Once an error is captured, you can head over to the Sentry dashboard, where you will see a report of the error, including the affected class, the frequency of the issue, and any breadcrumbs that led to the error.
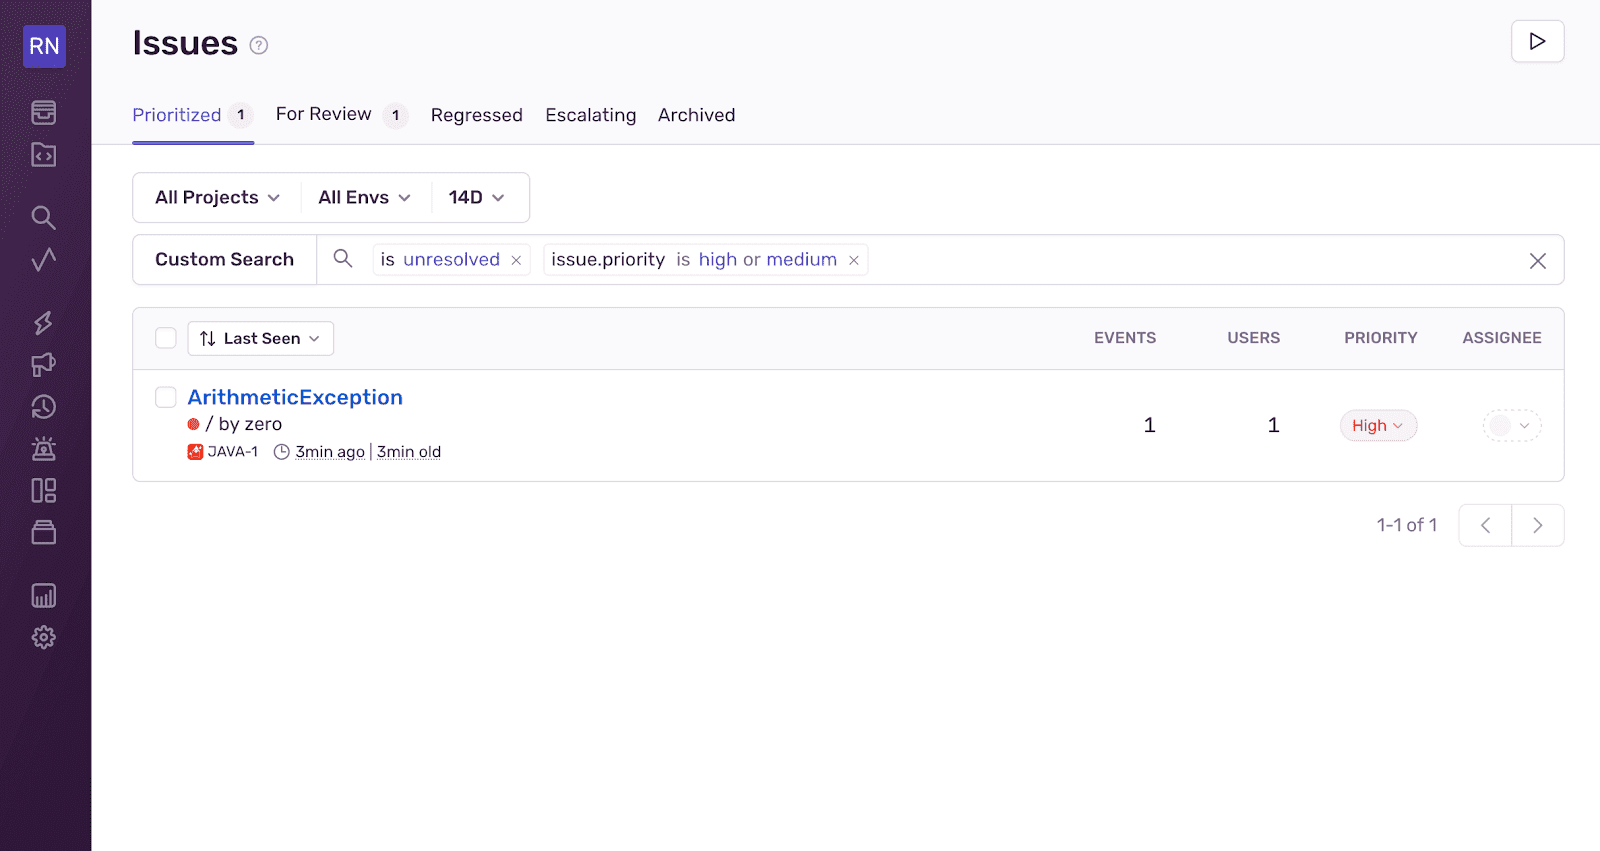
Sentry Dashboard
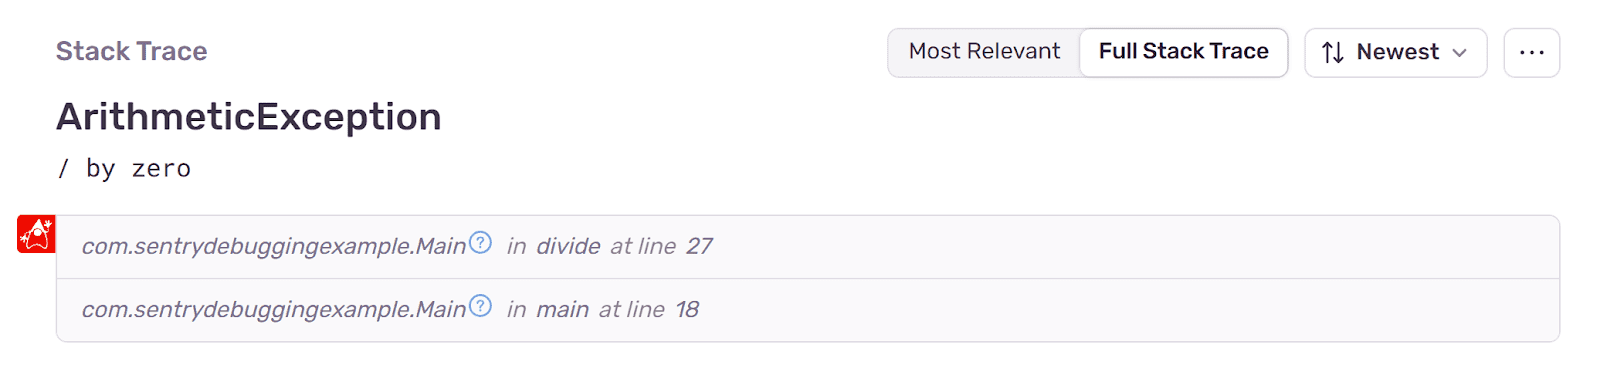
Sentry also captures the full stack trace, allowing you to pinpoint the exact location of the error in your code.
By using Sentry, you can also monitor unhandled exceptions and track performance issues to keep your code running smoothly.
Track and Manage Errors with Sentry
This guide discusses the importance of logging and debugging in Java, how to set up logging using the built-in java.util.logging package, and essential debugging techniques in Eclipse.
We’ve also looked at how third-party logging libraries like Log4j and Logback can help manage logs in complex projects.
Finally, we looked at how Sentry can enhance your Java application by providing real-time error monitoring and performance insights. By integrating Sentry into your project, you can effectively track and manage errors, ensuring your application runs smoothly and efficiently.
