A Guide to Logging in React Native
A Guide to Logging in React Native
Basic console logging is a good starting point for debugging and understanding an app. For larger, more complex apps, it’s helpful to include additional information and persist logs.
In this guide, you’ll learn how to create and view logs in React Native and how to create and save custom logs to a file. We’ll focus on JavaScript logs. We’ll also show you how to go beyond traditional logging using Sentry’s React Native SDK, which allows you to automatically report errors and exceptions to Sentry’s cloud service and view events that lead up to the error.
Want to quickly get up and running with logging React Native in Sentry? Check out our Logs Quickstart Guide for React Native.
Console Methods and Log Levels
React Native works with the same console methods used for logging in a web browser:
<CustomButton title="Continue with email" handlePress={() => { console.log('Sign in button pressed'); }} containerStyles="w-full mt-7" />
Most console methods are assigned a severity level. The four levels, ordered from least to most severe, indicate what the methods are used for:
Verbose: Logging messages for debugging.Info: Logging information when the code is working as expected, such as when a user makes a payment.Warning: Logging an event that might cause an issue.Error: Logging an error.
The table below shows the log level of some commonly used console methods:
Console Method | Log Level |
|
|
|
|
|
|
|
|
|
|
|
|
|
|
|
|
|
|
|
|
| None |
| None |
| None |
The console.debug method is identical to the console.log and console.info methods, except it has a different log level. The console.trace method is used to log a stack trace to the console.
You can determine how long an operation takes by using the console.time and console.timeEnd methods together to start and end a timer:
console.time("calculateDistance");
calculateDistance("51.50, -0.08", "48.86, 2.30");
console.timeEnd("calculateDistance");
Logging Objects
For production applications, it may be better to log an object than a string:
console.error({
    user: "Jason Daniels",
    service: "payment",
    message: "Payment failed"
});
Structured logging creates JSON-parseable log files. You can use auditing tools to query these files like a database. If possible, predefine a set of log properties to ensure your logs are organized and searchable for smoother error tracking and analysis.
How to View Console Logs
You can view console logs in the Metro bundler terminal process when you start your React Native development server. The React Native LogBox tool displays errors and warnings as on-screen notifications with red or yellow badges. You can configure LogBox to ignore some or all logs using the LogBox API:
import { LogBox } from 'react-native';

LogBox.ignoreAllLogs(); // Ignore all logs

// Ignore specific logs
LogBox.ignoreLogs([
  'Warning: componentWillReceiveProps has been renamed',
  /GraphQL error: .*/,  // Substring or regex match
]);
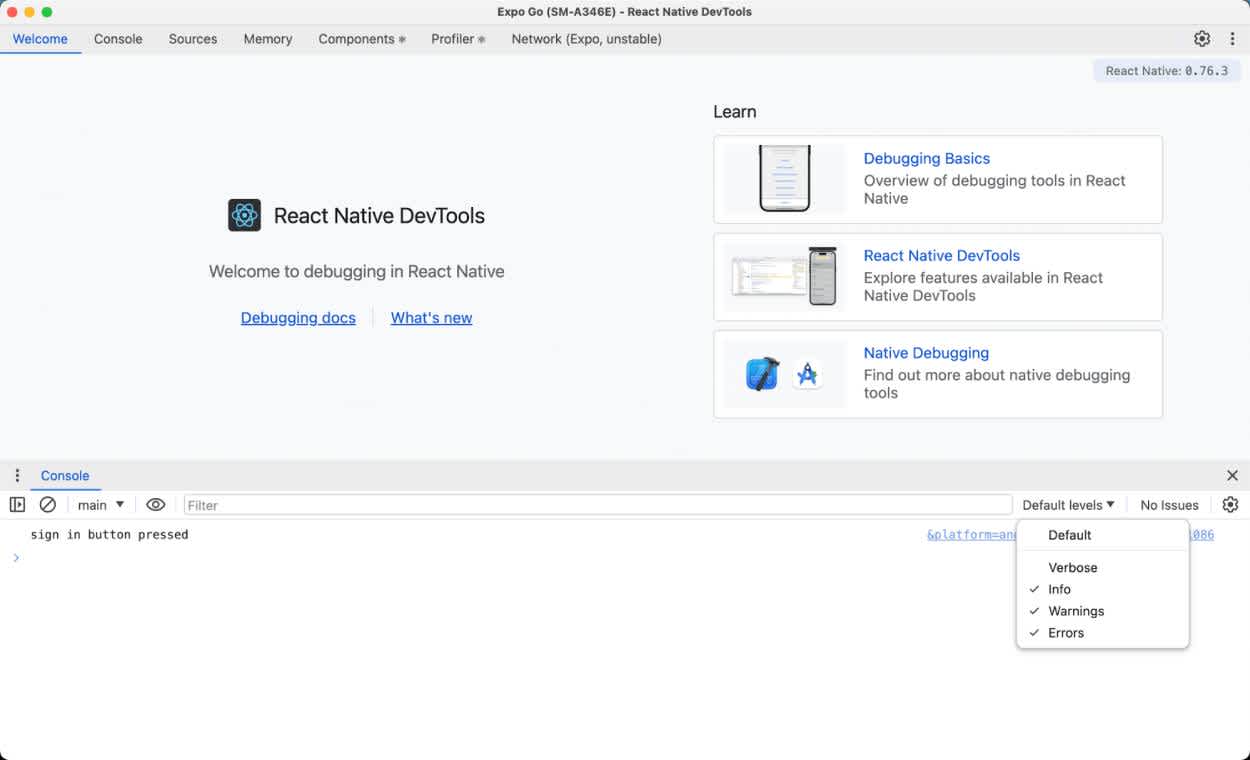
Advanced logging methods, such as console.table and console.dir, are not displayed in the terminal. You can use React Native DevTools, the built-in debugger released in React Native 0.76, to view these and improve your debugging experience. React Native DevTools supports all React Native apps running Hermes, the new JavaScript engine optimized for React Native and used as the default JavaScript engine for Expo.
React Native recommends using a React Native framework such as Expo to help you get started building production-ready apps. If you’re using Expo, you can open the debugger in Google Chrome or Microsoft Edge by pressing j after starting the development server.
React Native DevTools
In the Console tab, you can filter console logs by their log level using the Default levels dropdown menu to the right of the Filter input.
The Verbose console.debug logs are not displayed by default.
It’s best to use React Native DevTools to view logs, as JavaScript logs will be removed from Metro in React Native 0.77.
Viewing Native Logs
In projects that have exposed native code, you may need to access native logs for Android or iOS.
To access these logs, generate your app’s native iOS or Android source code and run your app using an IDE with native debugging features, such as Android Studio or Xcode.
Android
First, set up Android Studio and an Android emulator if you haven’t already.
Next, generate the native code for your project. If you’re using Expo, run the following command to add an android folder with your app’s native code, including any Java and Kotlin code, to the root of your app:
npx expo prebuild -p android
Open your native code in Android Studio:
open -a "/Applications/Android Studio.app" ./android
Build the app from Android Studio and attach the debugger to a running app. Then, you can view the native logs using Logcat.
iOS
If you’re using macOS, you can build your iOS app as follows:
First, make sure you’ve set up Xcode and Watchman to use the iOS emulator, which can only be installed on macOS.
Generate the native code for your app. Run the following Expo command to add an
iosfolder with your app’s native code, including any Objective-C and Swift code, to the root of your app:
npx expo prebuild -p ios
Open your native code in Xcode using the following command:
xed ios
Build the app from Xcode by pressing Cmd ⌘ + r or by clicking the play button in the upper-left corner of Xcode.
If you’re developing an iOS app from a Windows or a Linux machine, you need a physical iOS device and an Apple Developer Program membership.
You can learn how to create a build for an iOS device in the Expo docs.
After building the app, you can use the low-level debugger (LLDB) and other Xcode debugging tools to view its native logs.
See What’s Happening with System Logs
If you need to see logs for everything happening on your device, including logs from other apps and the OS, you can use one of the following commands:
npx react-native log-android
npx react-native log-ios
Customize Your Process with React Native Logging Libraries
For more advanced logging, you may want to customize your logging process, save logs to a local file, or send them to a remote server. Logging libraries such as react-native-logs and react-native-file-logger simplify and speed up this process.
The react-native-logs library is similar to winston, the most popular Node.js logging library, although react-native-logs is simpler. Its features include:
Custom log levels
The ability to save logs to a file
Custom transports, including a Sentry transport, for sending logs to a cloud service
Custom log colors
Namespaced logs that allow you to log messages for only certain parts of your app
The react-native-file-logger library was designed to be simple to use and uses the same log levels as the console methods. You cannot add custom log levels to this library. It offers two advantages over the react-native-logs library:
Email support: The
sendLogFilesByEmailmethod allows you to easily send log files by email.Configurable, size-based file rolling: You can customize the maximum size of the log files and the maximum number of log files kept in the library.
However, the react-native-logs library only has time-based daily file rolling. If you want to add a custom size-based file-rolling feature, you need to implement it yourself.
Using the React Native Logs Library
As the most feature-rich and customizable library, react-native-logs is a good choice for most use cases. Let’s explore it in more depth and learn how to customize log levels, send logs to a cloud service, and save logs to a file.
Creating Custom Log Levels
The createLogger() method creates a simple logger with debug, info, warn, and error log levels when called without arguments:
import { logger } from "react-native-logs";

const log = logger.createLogger();
You can create custom log levels using the configuration object:
import { logger } from "react-native-logs";

const log = logger.createLogger({
  severity: "error",
  levels: {
      error: 0,
      warn: 1,
      info: 2,
      http: 3,
      verbose: 4,
      debug: 5,
      silly: 6
  },
});
These are the log levels used by winston.
The severity sets the least important log level to log to the console. It defaults to debug or the first custom level.
The logger’s log methods include the log level and a timestamp:
log.debug('sign in button pressed'); // 10:41:24 | DEBUG : sign in button pressed
You can also pass in an object to the log methods:
log.debug({ name: "Mark", age: 33 });
If you add multiple message arguments, the logger joins them together:
const errorObject = {
    status: 404,
    message: "Undefined Error",
};
log.error("New error occurred", errorObject);
This logs:
14:08:33 | ERROR : New error occurred
{
  "status": 404,
  "message": "Undefined Error"
}
Customizing Log Level Colors
Transports in react-native-logs are functions for displaying, saving, or sending log messages.
The consoleTransport allows you to format the console log output. Import it as follows:
import { consoleTransport } from "react-native-logs";
You can use the colors property to set a color for each log level:
  transport: consoleTransport,
  transportOptions: {
    colors: {
      info: "blue",
      warn: "magenta",
      error: "red",
    }
  },
Note that there is a limited list of available colors to choose from.
You can view the log colors in React Native DevTools:
React Native DevTools console
Sending Logs to a Cloud Service
You can write your own custom transport to send logs to a cloud service and save them to a database:
import { logger, transportFunctionType } from "react-native-logs";

const sendLog = async (msg) => {
  try {
    const response = await fetch('https://example.com/logs/', {
      method: 'POST',
      headers: {
        'Accept': 'application/json',
        'Content-Type': 'application/json',
      },
      body: JSON.stringify(msg),
    });
  } catch (error) {
    console.error('Failed to send log:', error);
  }
};

const customTransport: transportFunctionType<{ myCustomOption: string }> = (msg, rawMsg, level, extensions, options) => {
  if (level === 'error') {
    sendLog(msg);
  }
};

const log = logger.createLogger({
  transport: customTransport,
  transportOptions: {
    myCustomOption: "option",
  },
});
The custom transport takes in the following arguments:
msg: any: The log message, which the logger formats as[time] | [namespace] | [level] | [msg]r
awMsg: any: The log messagelevel: { severity: number; text: string }: The log levelextension?: string | null: The log namespaceoptions?: any: The transportOptions object
Logging to a File
You can use the fileAsyncTransport to save logs to a file.
First, install expo-file-system or react-native-fs:
import { fileAsyncTransport } from "react-native-logs";
import * as FileSystem from 'expo-file-system';
If you use plain React Native, you can use RNFS by importing it from the react-native-fs library instead of the Expo file system:
import RNFS from "react-native-fs";
You can use multiple transports by passing in an array to the transport property:
transport: [consoleTransport, fileAsyncTransport],
transportOptions: {
    FS: FileSystem, // For plain React Native, you can use RNFS, so this would be 'FS: RNFS'
    fileName: `my-app_log.txt`,
    filepath: FileSystem.documentDirectory,
Each app has only read and write access to locations in the following directories:
The react-native-logs library has basic file rolling. You can configure the fileAsyncTransport to create a new file every day by using {date-today} in the fileName:
fileName: `log_my-app_{date-today}.txt`,
How to View Log Files in Android Studio
The easiest way to view Android log files during development is to use the Android Studio Emulator to test your app on a virtual Android device.
If you don’t have an Android build, create one as follows:
Run the emulator.
Build your app locally using the compile command from Expo CLI, which generates the
androiddirectory in the root directory of your project:
npx expo run:android
This command compiles your project to the
androidfolder using your locally installed Android SDK, then installs and launches your app in the Android Studio Emulator.
If you already have an Android build, open it in the Android Studio as follows:
Start the development server.
npx expo start
Press s to switch to the development build.
Then, press a to open the app in the Android Emulator.
Use the Android Studio Emulator to view the log files in your virtual Android device’s file system:
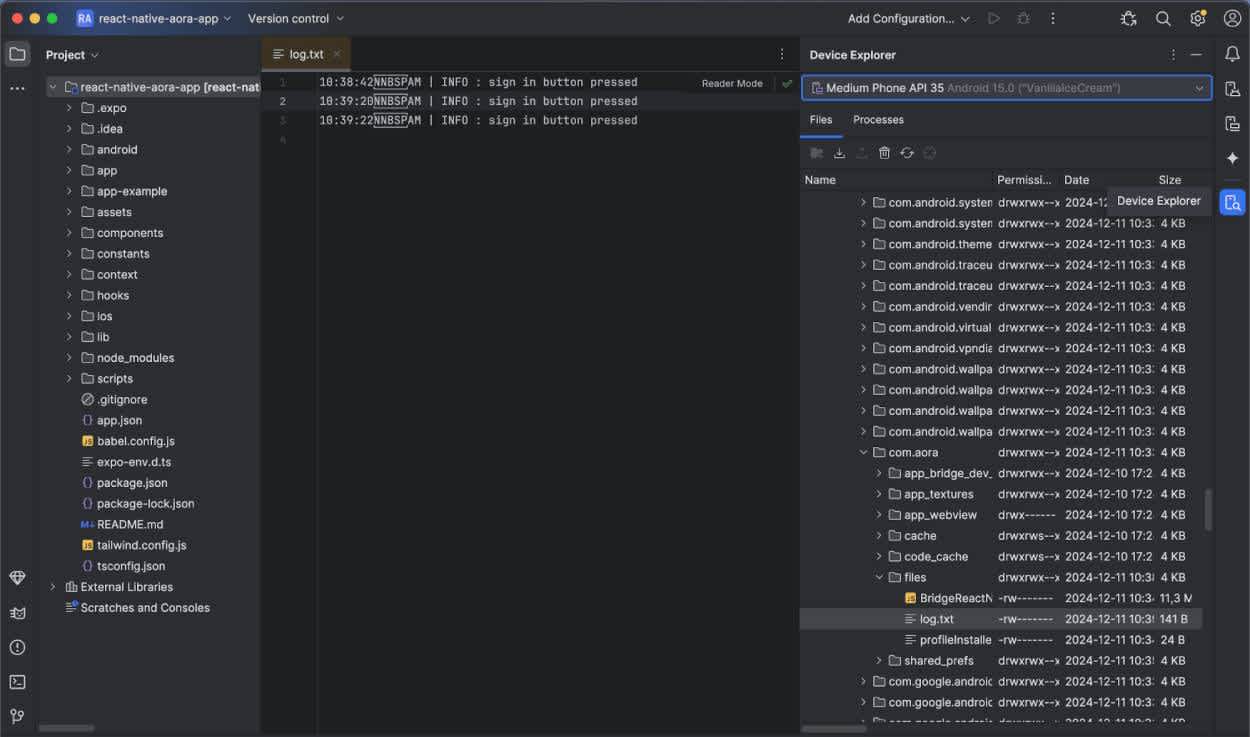
Open your project in Android Studio and click the Device Explorer button in the tool window bar, found on the right side of your screen.
If you used the
FileSystem.documentDirectoryfile path, you can find yourreact-native-logslog files in thedata/data/com.<name of your app>/filesfolder:Android Studio Device Explorer
Right-click on the file and choose Save as to save the file to a specific folder on your computer.
Viewing Log Files in Xcode
The easiest way to view iOS log files during development is to use the Xcode Simulator.
If you don’t have an iOS build, create one as follows:
Build your app locally using the compile command from Expo CLI, which generates the
iosfolder in the root directory of your project.
npx expo run:ios
This command compiles your project to the
iosfolder, then installs and launches your app in the Xcode Simulator.
If you already have an iOS build, open it in Xcode as follows:
Start the development server.
npx expo start
Press s to switch to the development build.
Then, press i to open your iOS app in the Xcode Simulator.
There are two ways to find the log file location on your computer:
You can use the following console log:
console.log(FileSystem.documentDirectory);
You can use Xcode command-line tools to list all the apps installed on the currently running Simulator:
xcrun simctl listapps booted
The printed object has a property called
org.name.your-app-name. In this object, the value of theDataContainerproperty is the file path to the simulated iOS device storage (excluding thefile://prefix).
Integrating Sentry With Your React Native Application
We often get asked: “Isn’t Sentry just logging?”. Sentry is a complement to your logging setup, not a replacement. Logging tracks all your application events and writes them to files or a database where they can be audited, whereas Sentry focuses on reporting application errors and exceptions. An exception is an event that interrupts normal code execution, such as a syntax error. Sentry collects detailed data about what went wrong and provides you with the information needed to reproduce and fix issues in production. You can also set up alerts in Sentry to monitor problems with your code and their impact on your users in real time.
The Sentry React Native SDK automatically reports errors and exceptions in your app and allows you to enable the following optional features:
Tracing - monitors interactions between multiple services or apps.
Profiling - collects and analyzes performance profiles from users.
To use the Sentry React Native SDK, first sign up for a Sentry account and create a React Native project in your Sentry organization.
If you’re using Expo, make sure you use Expo SDK version 50 or newer in your app. The sentry-expo package supports Expo SDK version 49 and older.
Install the Sentry React Native SDK by running the Sentry wizard:
npx @sentry/wizard@latest -i reactNative
This command automatically configures your project by adding and modifying files to enable Sentry monitoring. These changes only need to be made once, and you should commit the modified files to your version control system.
The setup steps add code for initializing the SDK and adding the Sentry Expo and Metro plugins.
The final step gives you a code snippet that you can add to your application to create a test error:
<Button title='Try!' onPress={ () => { Sentry.captureException(new Error('First error')) }}/>
Make sure that you import Sentry from @sentry/react-native:
import * as Sentry from '@sentry/react-native';
Build the Release version of your app to send the test event to Sentry:
Rebuild your React Native app and run the development build in an Android or iOS emulator, as described in the viewing log files sections above.
Press the test button in the emulator.
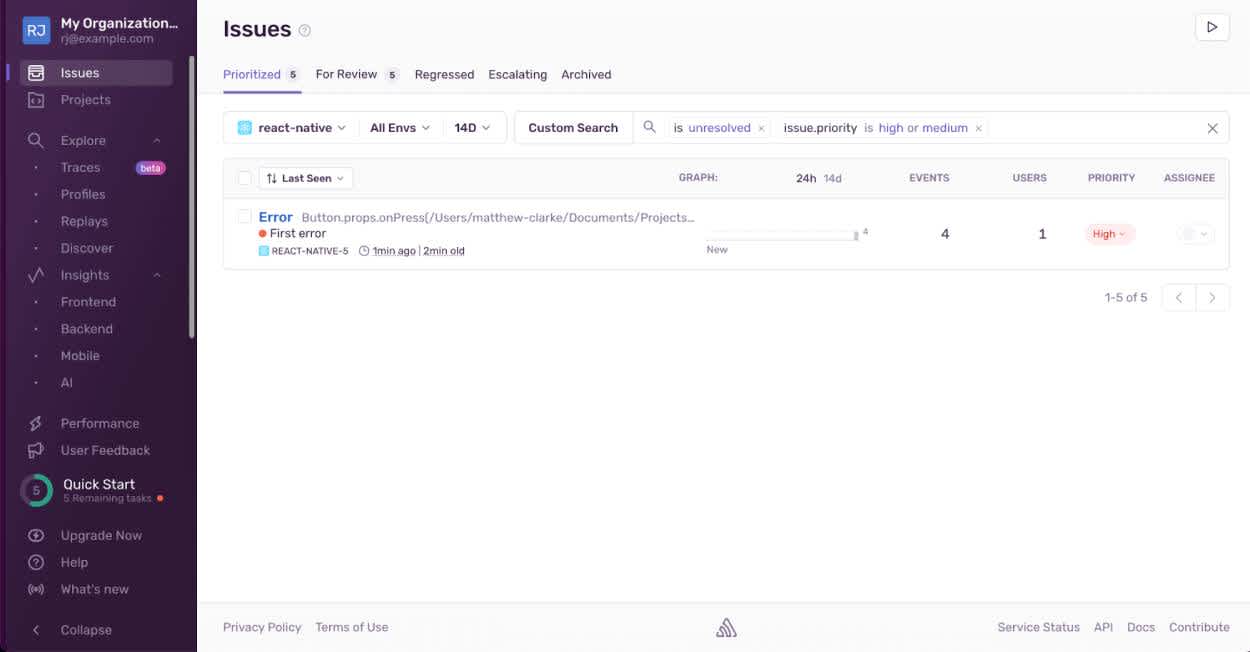
Now, you should see the test error logged to your Sentry project’s Issues page.
Sentry Issues page
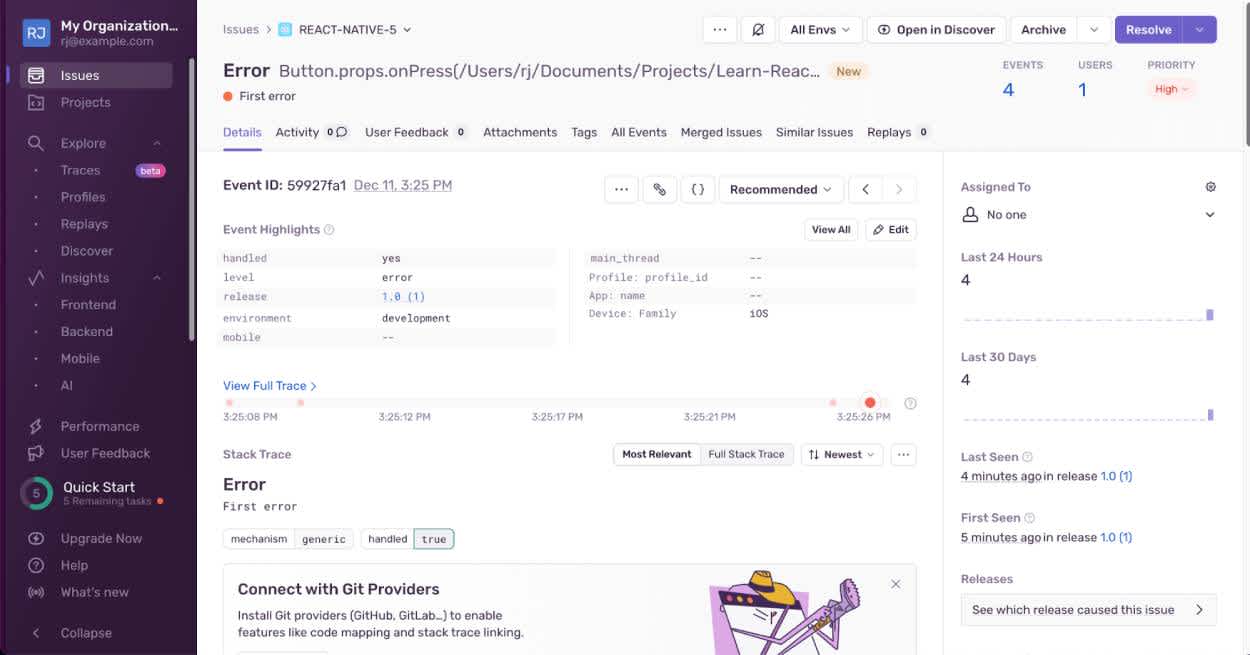
Click on the error row in the table to view the error details:
Sentry error details
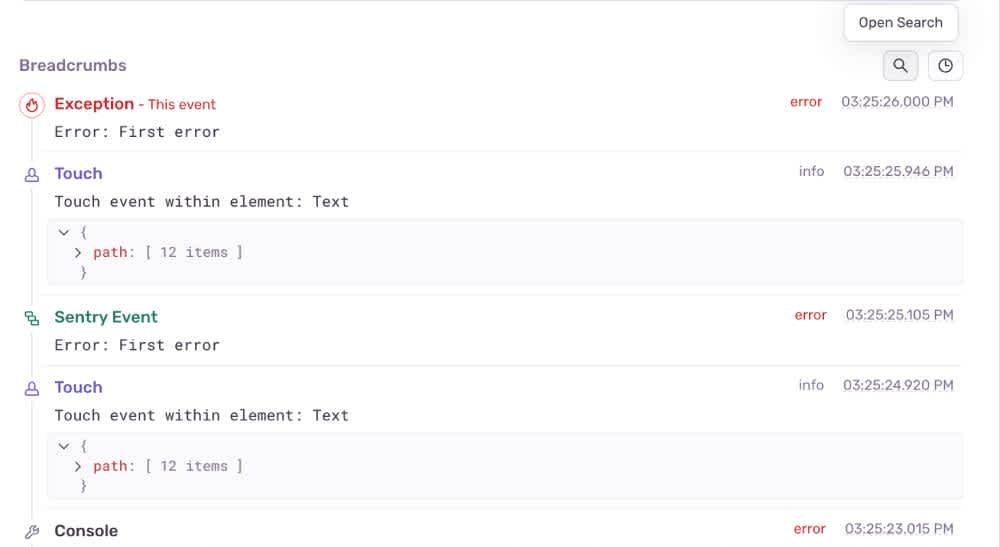
On this page, you can see the Stack Trace of the error and Breadcrumbs showing the events leading up to the error.
You can explore the breadcrumbs to help you determine what caused the error:
Click the Open Search button to the right of the Breadcrumbs section to search through the breadcrumb events.
Sentry error breadcrumbs
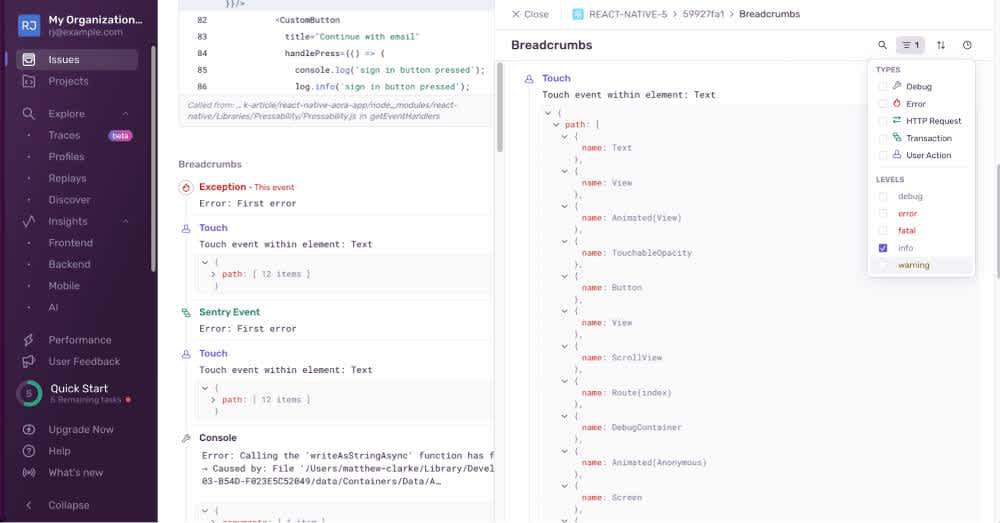
Filter the events by type and log level:
Breadcrumbs filtering
The react-native-logs library has a Sentry transport for sending logs to Sentry.
In the
transportOptionsobject, you can use theerrorLevelsproperty to specify which log levels are considered errors; all other log levels are treated as breadcrumbs.
import { logger, sentryTransport } from "react-native-logs";
import * as Sentry from "@sentry/react-native";

const log = logger.createLogger({
  severity: "debug",
  transport: sentryTransport,
  transportOptions: {
    SENTRY: Sentry,
    errorLevels: "error",
  },
});

log.warn("Send this log to Sentry as breadcrumb");
log.error("Send this log to Sentry as error");
If you don’t set the
errorLevels, all messages will be treated as errors.
You may have privacy concerns about logging user data and tracking user activity. Sentry takes user privacy seriously and allows you to exclude data from error logs.
Monitoring your React Native Application with Sentry
In this guide, you learned how to set up logging in React Native with the react-native-logs library, how to view log files using Android Studio and Xcode, and how to use Sentry error tracking alongside your React Native logging.
Next, you can learn how to use Sentry to monitor application performance or try out Session Replay for Mobile. Session Replays are reproductions of user sessions, which you can view to help you identify issues and develop a better understanding of user pain points.

