AI-driven caching strategies and instrumentation
AI-driven caching strategies and instrumentation


The things that separate a minimum viable product (MVP) from a production-ready app are polish, final touches, and the Pareto 'last 20%' of work. Most bugs, edge cases, and performance issues won't show up until after launch, when real users start hammering your application. If you're reading this, you're probably at the 80% mark, ready to tackle the rest.
This article covers application caching: how to use it for cutting tail latency, protecting databases, and handling traffic spikes, plus how to monitor it once it's running in production.
This article is part of a series of common pain points when bringing an MVP to production:
Paginating Large Datasets in Production: Why OFFSET Fails and Cursors Win
AI-driven caching strategies and instrumentation (this one)
Building a mental model for caching
Good caching multiplies your performance, scalability, and cost efficiency. Done right, it gives you sub-millisecond responses and absorbs traffic spikes without crushing your origin servers. Done wrong (aggressive caching, bad invalidation, wrong strategies) it creates subtle bugs, stale data, and degraded user experience (UX) that's hard to debug and usually only shows up after it's already affected a lot of users.
Before looking for caching opportunities, you need a mental model for what should and shouldn't be cached. Here's a checklist:
✅ Cache if most are true:
Expensive: slow CPU, slow input/output (IO), heavy DB, big joins/aggregates, external application programming interface (API)
Frequent: called a lot (high requests per minute (RPM)) or sits on hot paths (page load, core API)
Reusable: same inputs repeat (low key cardinality)
Stable-ish: data doesn't change every second (or can tolerate staleness)
Spiky load: bursty traffic where cache absorbs thundering herds
Tail hurts: P95/P99 is bad, and misses correlate with slow requests
Safe to serve stale: user impact low, or can use stale-while-revalidate (SWR)
Invalidation is easy: time to live (TTL) works, or updates have clear triggers
Small-ish payload: memory cost reasonable, serialization cheap
❌ Don't cache (or be very careful) if any are true:
High cardinality keys: per-user / per-page / per-filter explosion → mostly misses (pagination is a special case - see note below)
Highly mutable: correctness demands freshness
Personalized / permissioned: easy to leak data via key mistakes
Hard invalidation: no clear TTL, updates unpredictable
Already fast: saving 5ms isn't worth complexity
Cache stampede risk: expensive recompute + synchronized expiry (needs locking / jitter)
There's a special rule for caching paginated endpoints - cache page 1 + common filters first. Page 1 and a small set of common filters are usually hot and reused, so caching pays off. As page numbers increase, key cardinality explodes and reuse collapses, so deep pages will naturally miss and that's fine. Optimize for protecting the backend and reducing tail latency on the entry points, not for achieving uniform hit rates across all pages.
Finding caching opportunities in production
Once you know what should be cached, the next question is where caching will actually matter. In production systems, good caching candidates show up through pain, usually in three forms.
Backend pain (start here)
For backend and full-stack systems, this is the most actionable signal.
Look for:
Transactions with bad P95/P99
Endpoints with heavy database (DB) time
Repeated queries, joins, aggregates
Fan-out (one request triggering many downstream calls)
Lock contention or connection pool pressure
These are places where caching immediately reduces real work.
User pain (confirmation)
Slow page loads, janky interactions, timeouts. Web Vitals like Time to First Byte (TTFB), Largest Contentful Paint (LCP), and Interaction to Next Paint (INP) help confirm that backend slowness is actually affecting users. They're most useful once you already suspect a backend bottleneck.
Cost pain (the long-term signal)
Even if your users aren't complaining yet, repetition is expensive:
High DB read volume
Paid external API calls
Recomputed rollups and counts
Cost often lags behind performance problems, but it's a strong motivator once traffic grows.
A simple prioritization heuristic is cost density:
requests per minute * time saved per request
An endpoint that's moderately slow but hit consistently is usually a better caching target than a pathological endpoint nobody touches.
Example: a slow paginated endpoint
Consider a paginated endpoint performing a heavy database query with no caching.
In Sentry > Insights > Backend, filtering by API transactions (above the table) surfaces this:
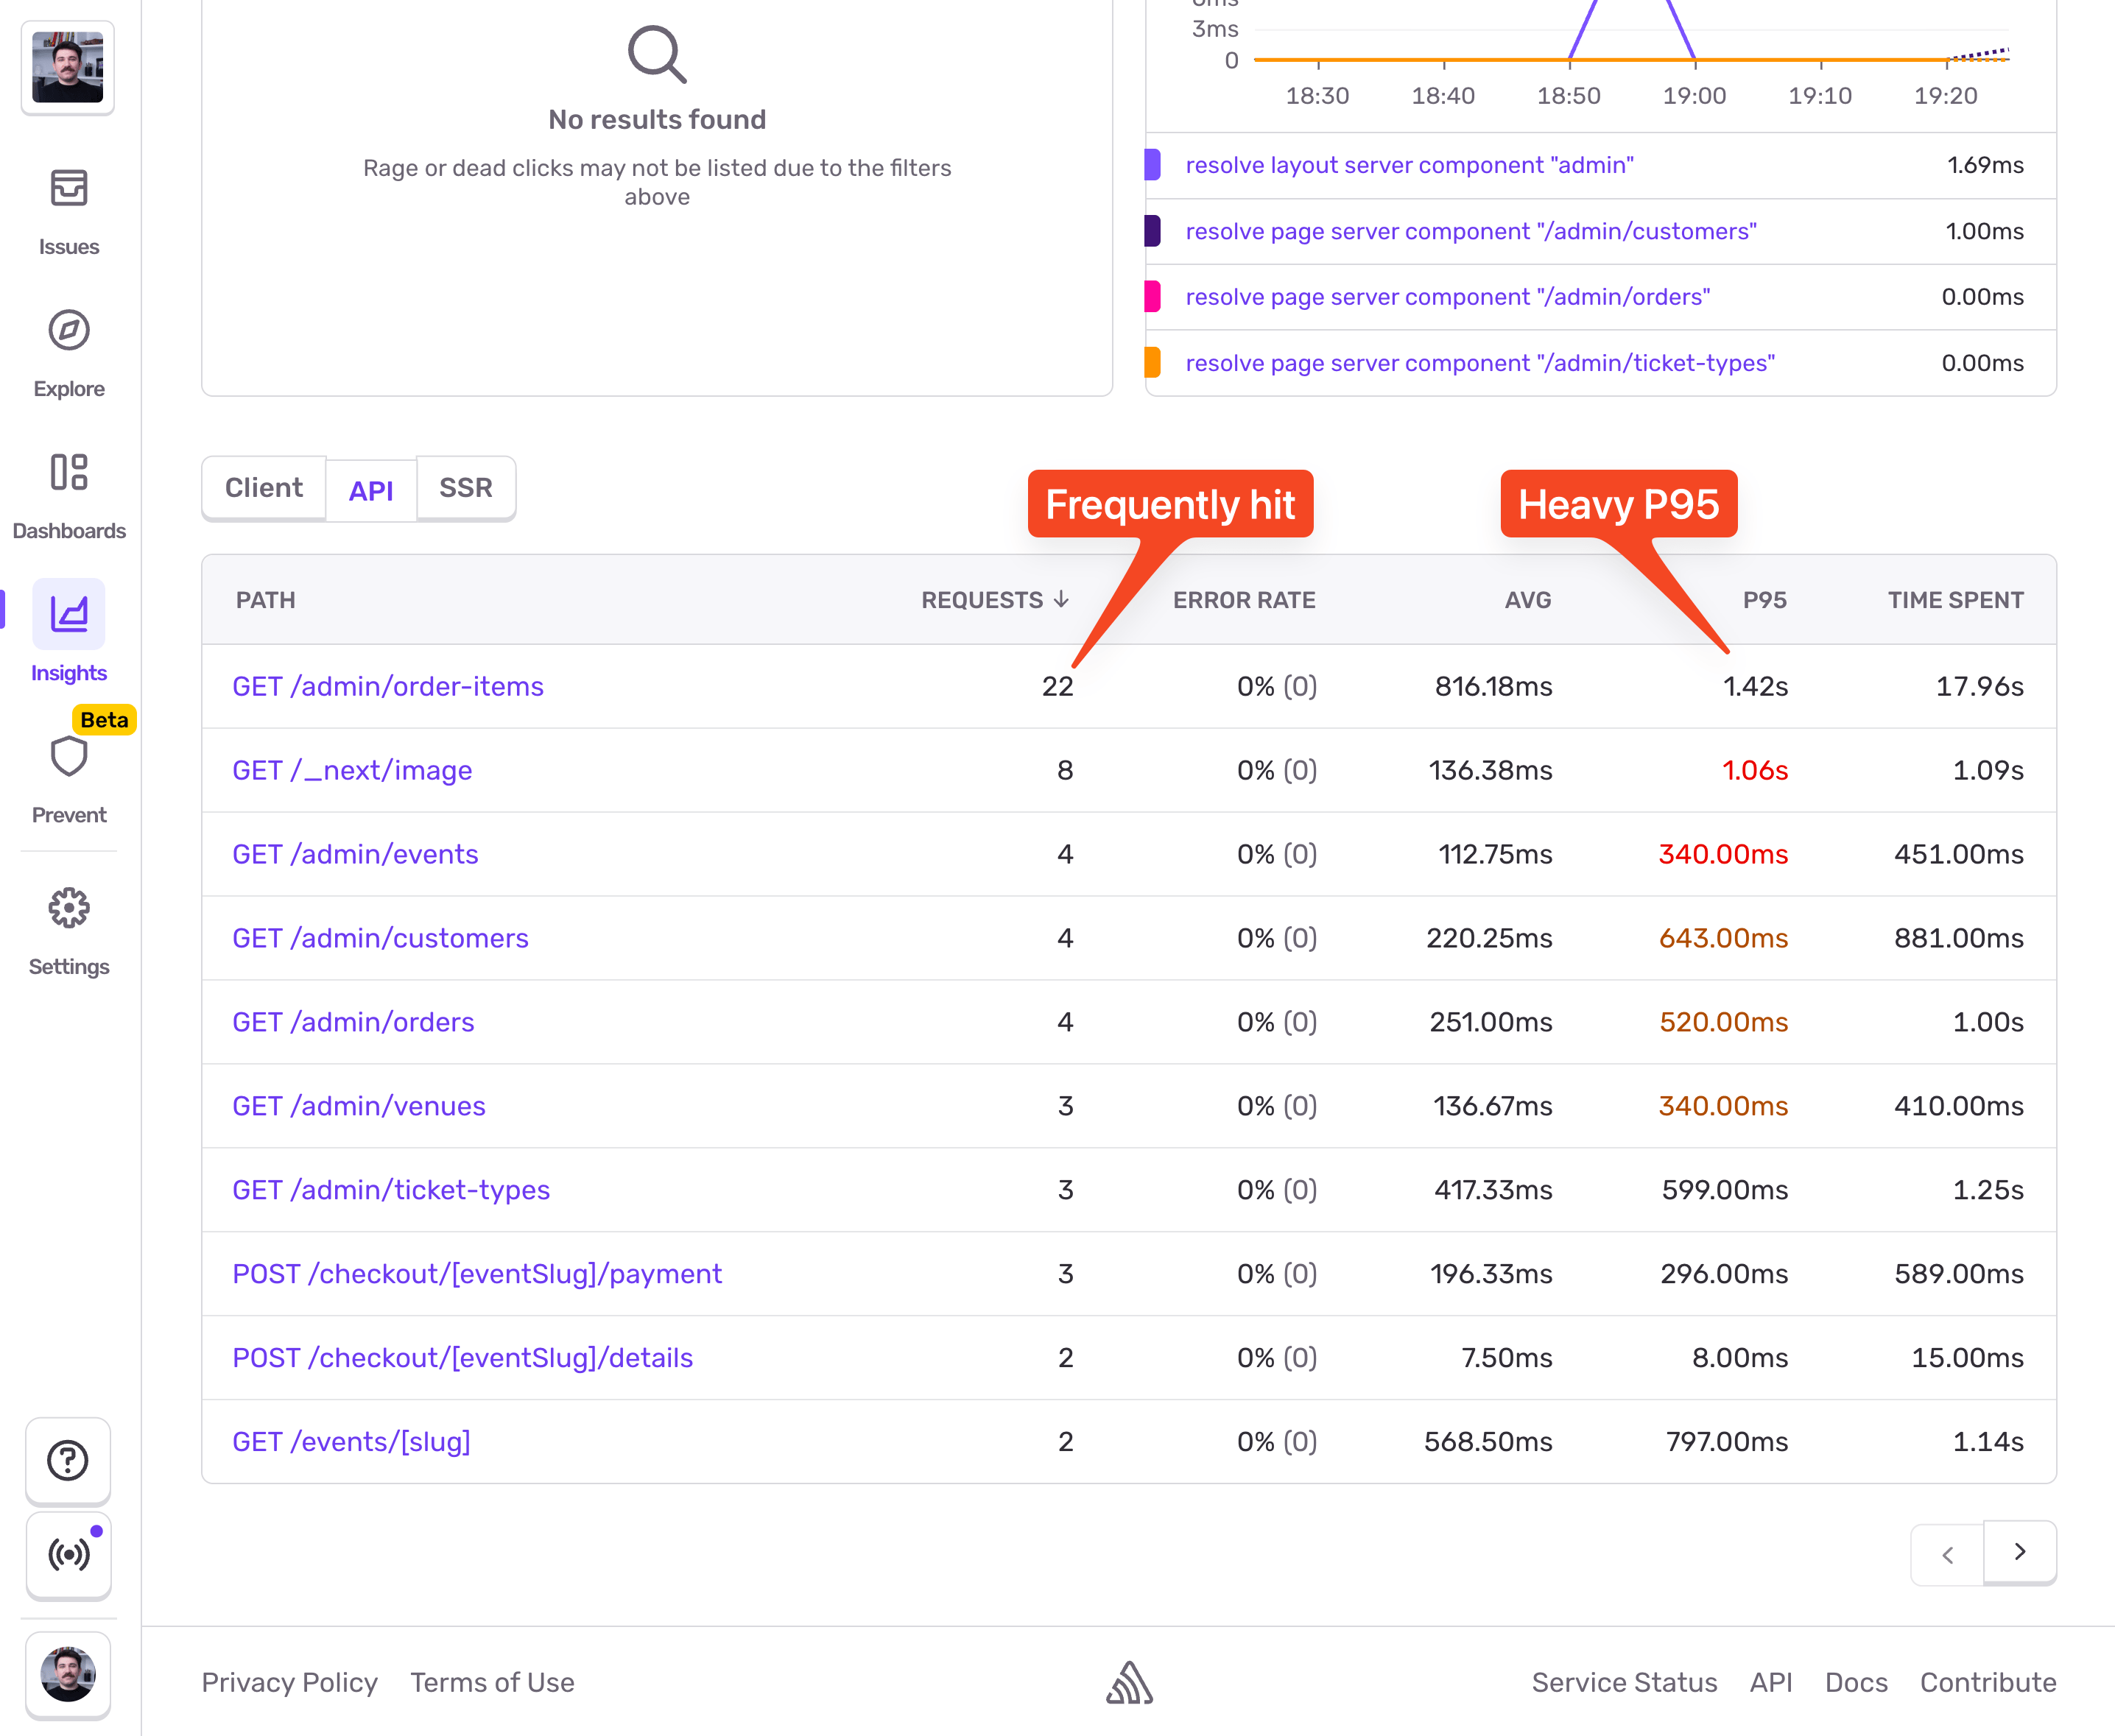
The GET /admin/order-items endpoint has potential for caching. Let's dive into it. I'll pick a slower event and inspect the trace view:
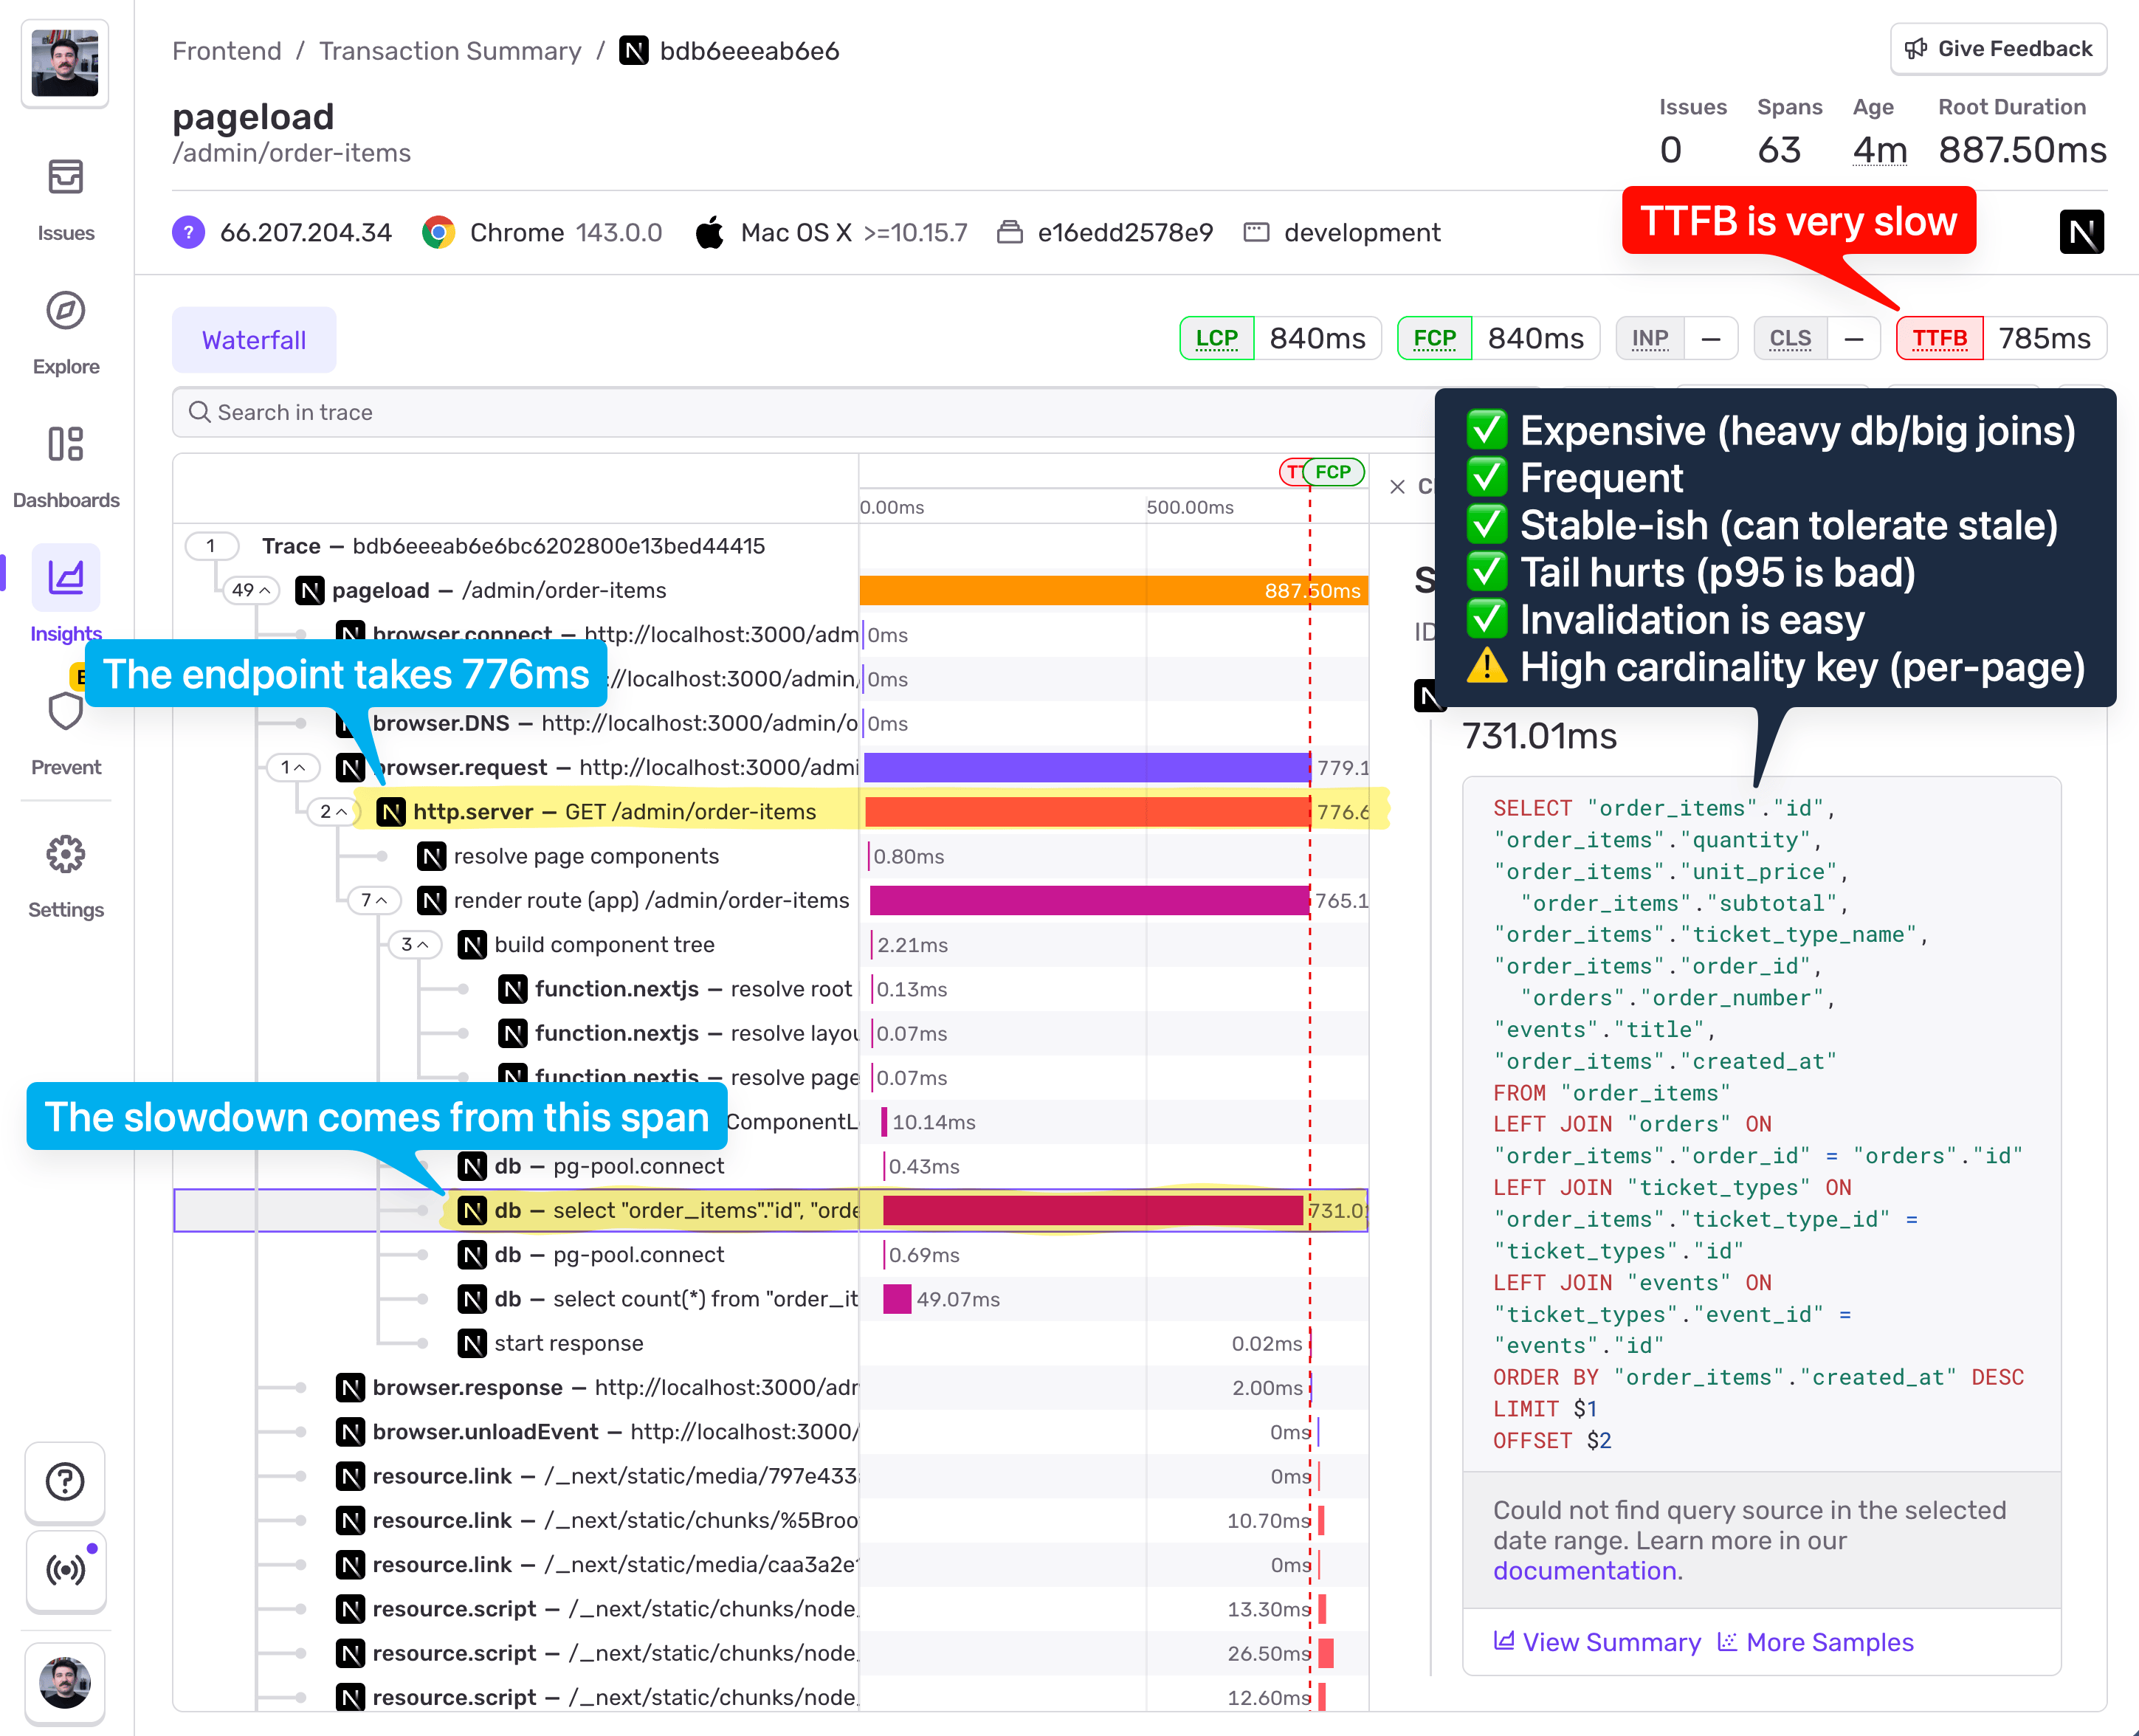
From the screenshot, we can see:
776ms total duration
731ms spent in a single DB span
Multiple joins
LIMIT + OFFSET pagination
Poor TTFB in Web Vitals
Against the checklist:
✅ Expensive (heavy db query, joins)
✅ Frequent (high throughput)
✅ Stable-ish (can tolerate brief staleness)
✅ Tail hurts (bad P95)
✅ Invalidation is easy (writes are controlled)
⚠️ High cardinality key (pagination)
This is a strong candidate for selective caching, not blanket caching.
Applying and instrumenting caching
Sentry comes with Cache Monitoring too. It helps you see your caching hit/miss rates across your application, and inspect specific events captured in production when the cache was either hit or missed.
Instrumenting caches can be done both automatically and manually. If you're using Redis, you can leverage the automatic instrumentation. If not, manual instrumentation is just as easy.
The most straightforward approach is to just ask Seer to do it for you. At the time of publishing this article, Seer's "open-ended questions" feature is private access only, but I'll give you a little sneak peek. You can access it with Cmd + / and straight up ask it to instrument caches for you:
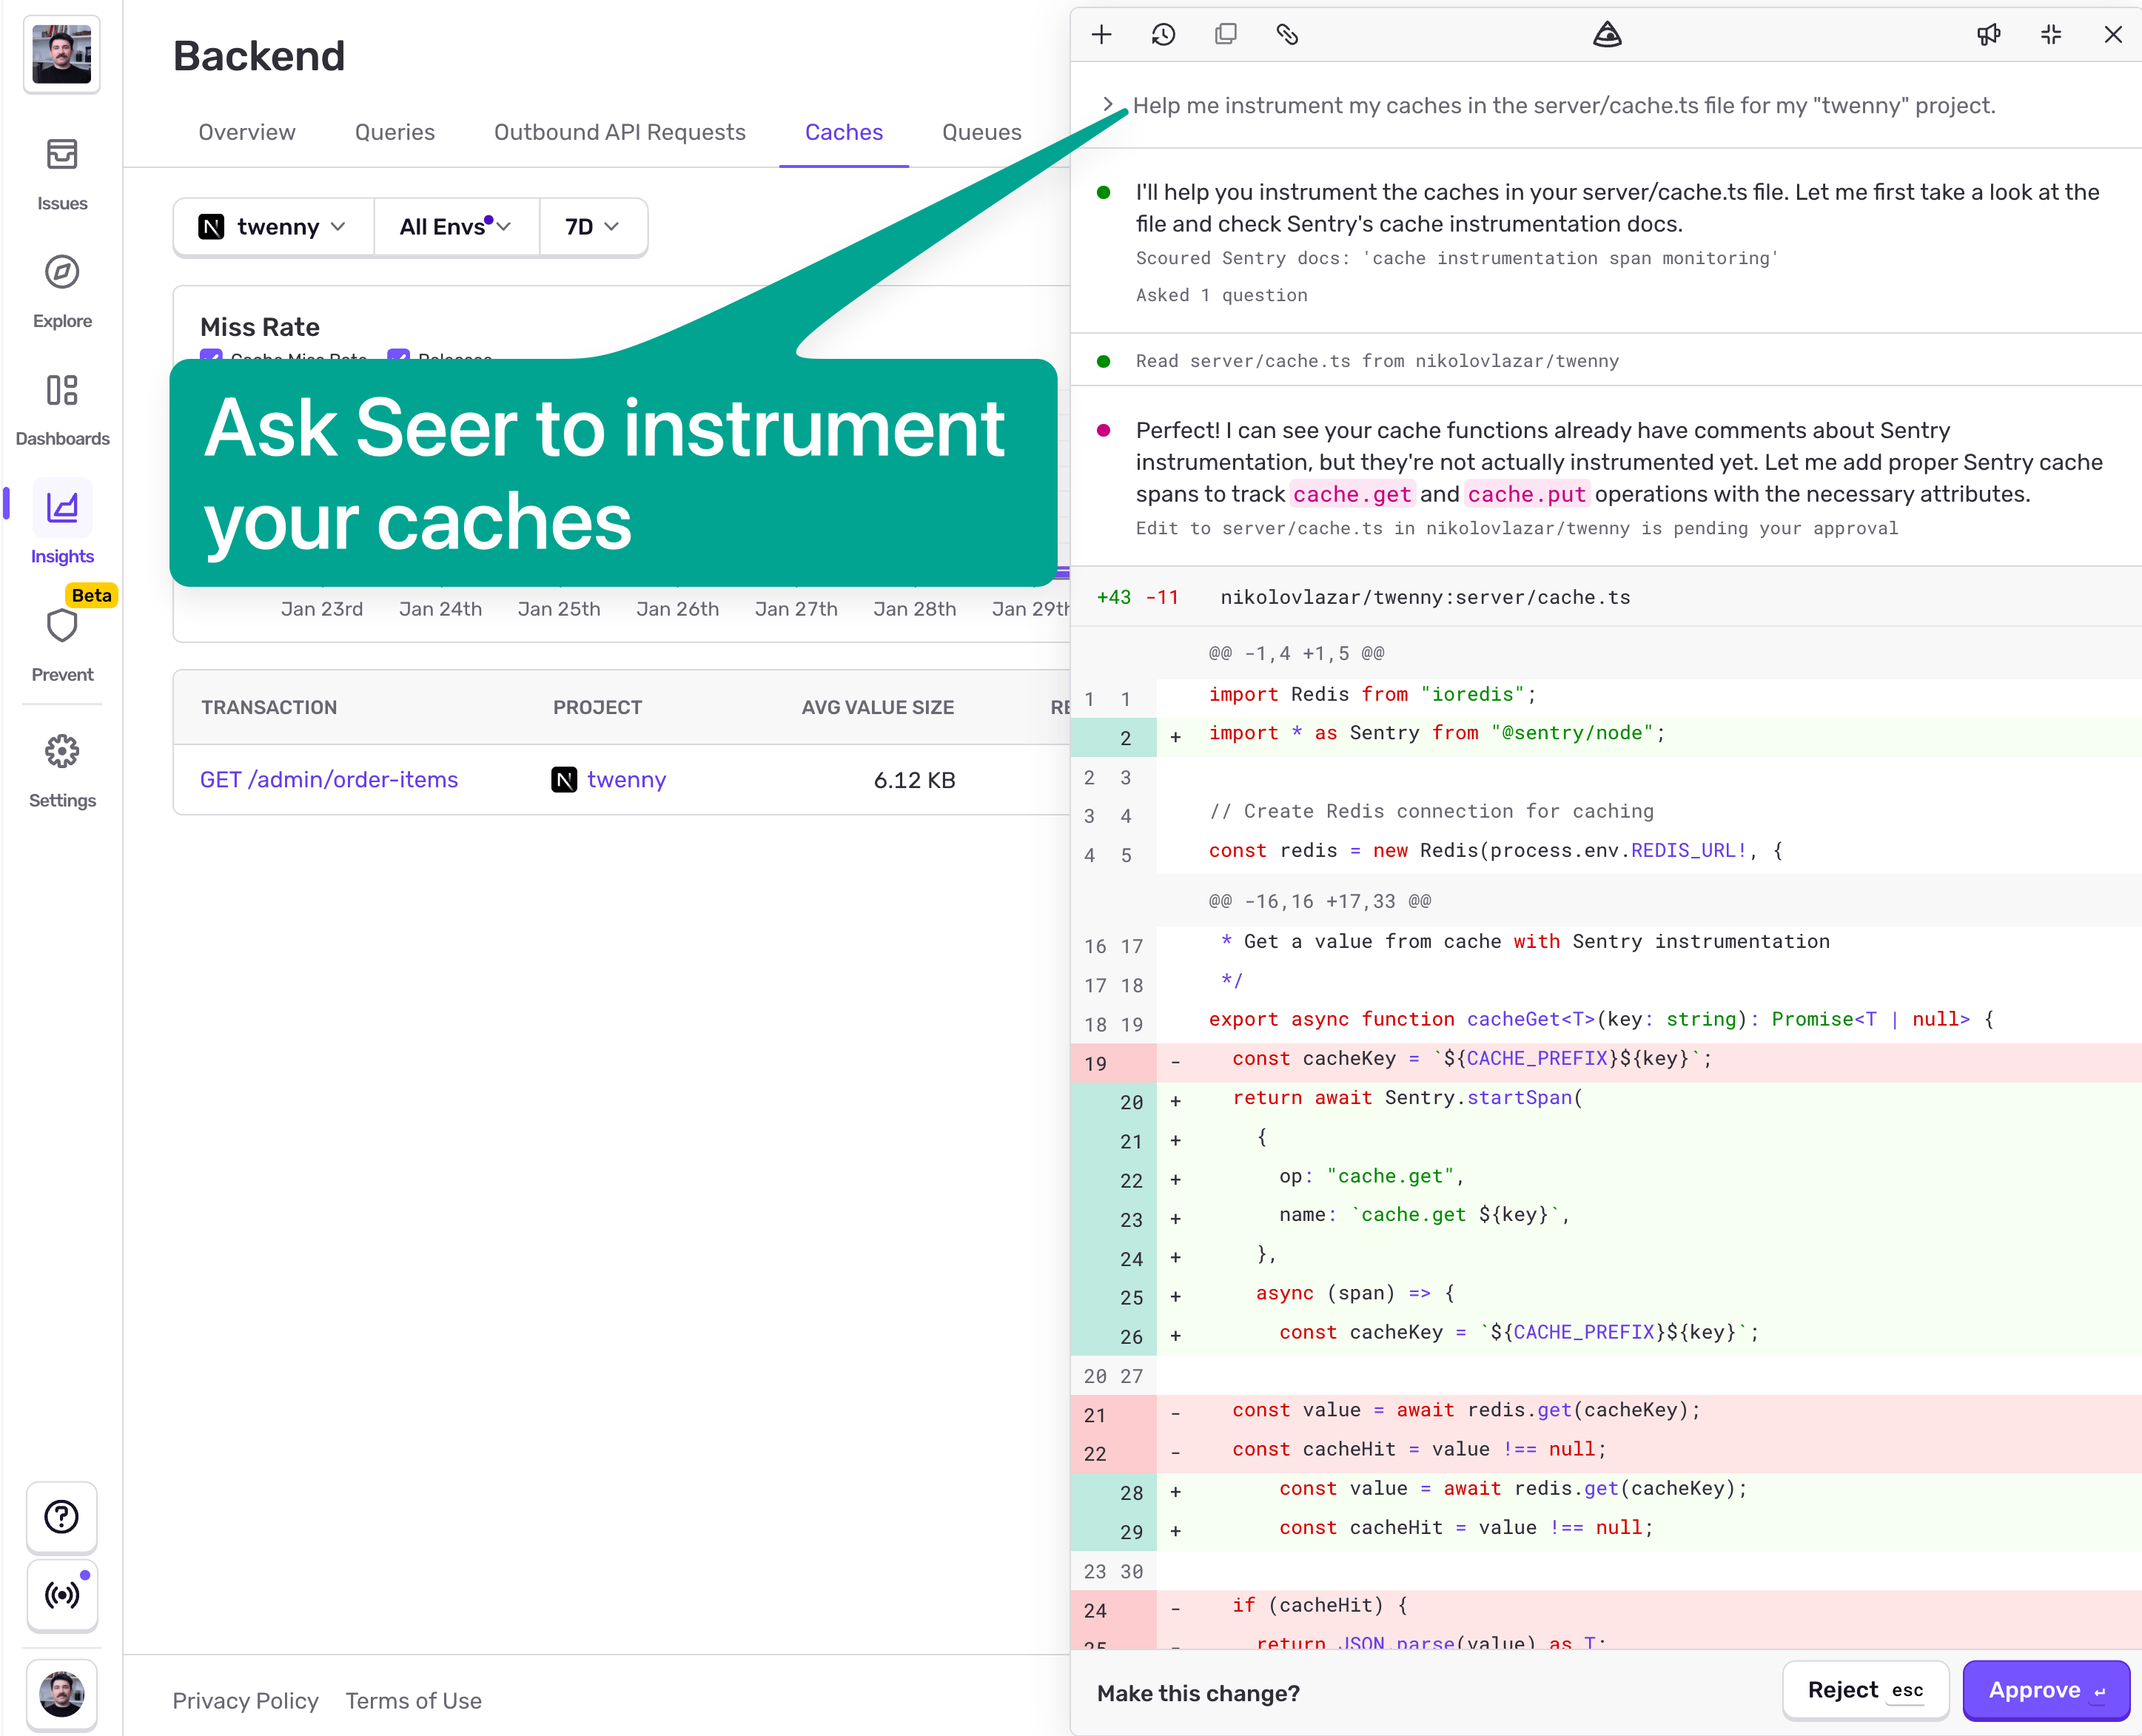
Seer will then open a PR on your repo, so you can merge it and be done with it.
In case you don't have access to this Seer feature yet, this is all you need to do to instrument your caches:
import * as Sentry from "@sentry/nextjs"; // Change import for your framework
import Redis from "ioredis";

const CACHE_PREFIX = "cache:";

const redis = new Redis(process.env.REDIS_URL!, {
  maxRetriesPerRequest: 3,
});

// -------------------------
// Getting values from cache
// -------------------------

export async function cacheGet<T>(key: string): Promise<T | null> {
  const cacheKey = `${CACHE_PREFIX}${key}`;

  return Sentry.startSpan(
    {
      name: cacheKey,
      op: "cache.get",
      attributes: {
        "cache.key": [cacheKey],
        "network.peer.address": process.env.REDIS_URL,
      },
    },
    async (span) => {
      const value = await redis.get(cacheKey);
      const cacheHit = value !== null;

      span.setAttribute("cache.hit", cacheHit);

      if (cacheHit) {
        span.setAttribute("cache.item_size", value.length);
        return JSON.parse(value) as T;
      }

      return null;
    }
  );
}

// -----------------------
// Setting values in cache
// -----------------------

export interface CacheOptions {
  /** Time to live in seconds */
  ttl?: number;
}

export async function cacheSet<T>(
  key: string,
  value: T,
  options: CacheOptions = {}
): Promise<void> {
  const cacheKey = `${CACHE_PREFIX}${key}`;
  const serialized = JSON.stringify(value);
  const { ttl = 30 } = options; // Default 30 seconds TTL

  return Sentry.startSpan(
    {
      name: cacheKey,
      op: "cache.put",
      attributes: {
        "cache.key": [cacheKey],
        "cache.item_size": serialized.length,
        "network.peer.address": process.env.REDIS_URL,
      },
    },
    async () => {
      await redis.setex(cacheKey, ttl, serialized);
    }
  );
}
That's it. All we need to do is wrap the redis.get and redis.setex with Sentry.startSpan and provide caching-specific span attributes. If you're not using JavaScript on your backend, you can simply rewrite these functions in your language of choice. As long as you're sending spans that have the correct op and attributes, you'll get caches instrumentation right.
Now we can just use these two functions:
export async function listOrderItems(page: number = 1) {
  const cacheKey = `order-items:page:${page}`;

  // Try to get from cache first (always check - helps track access patterns)
  const cached = await cacheGet<OrderItemsResult>(cacheKey);
  if (cached) {
    return cached;
  }

  // Cache miss - fetch from database
  const result = await fetchOrderItems(page);

  // Only cache the first page to avoid Redis bloat
  // cache.get still runs for all pages to track access patterns
  if (page === 1) {
    await cacheSet(cacheKey, result, { ttl: CACHE_TTL });
  }

  return result;
}
Monitoring and optimizing caches
Once we deploy this we start seeing caches coming in:
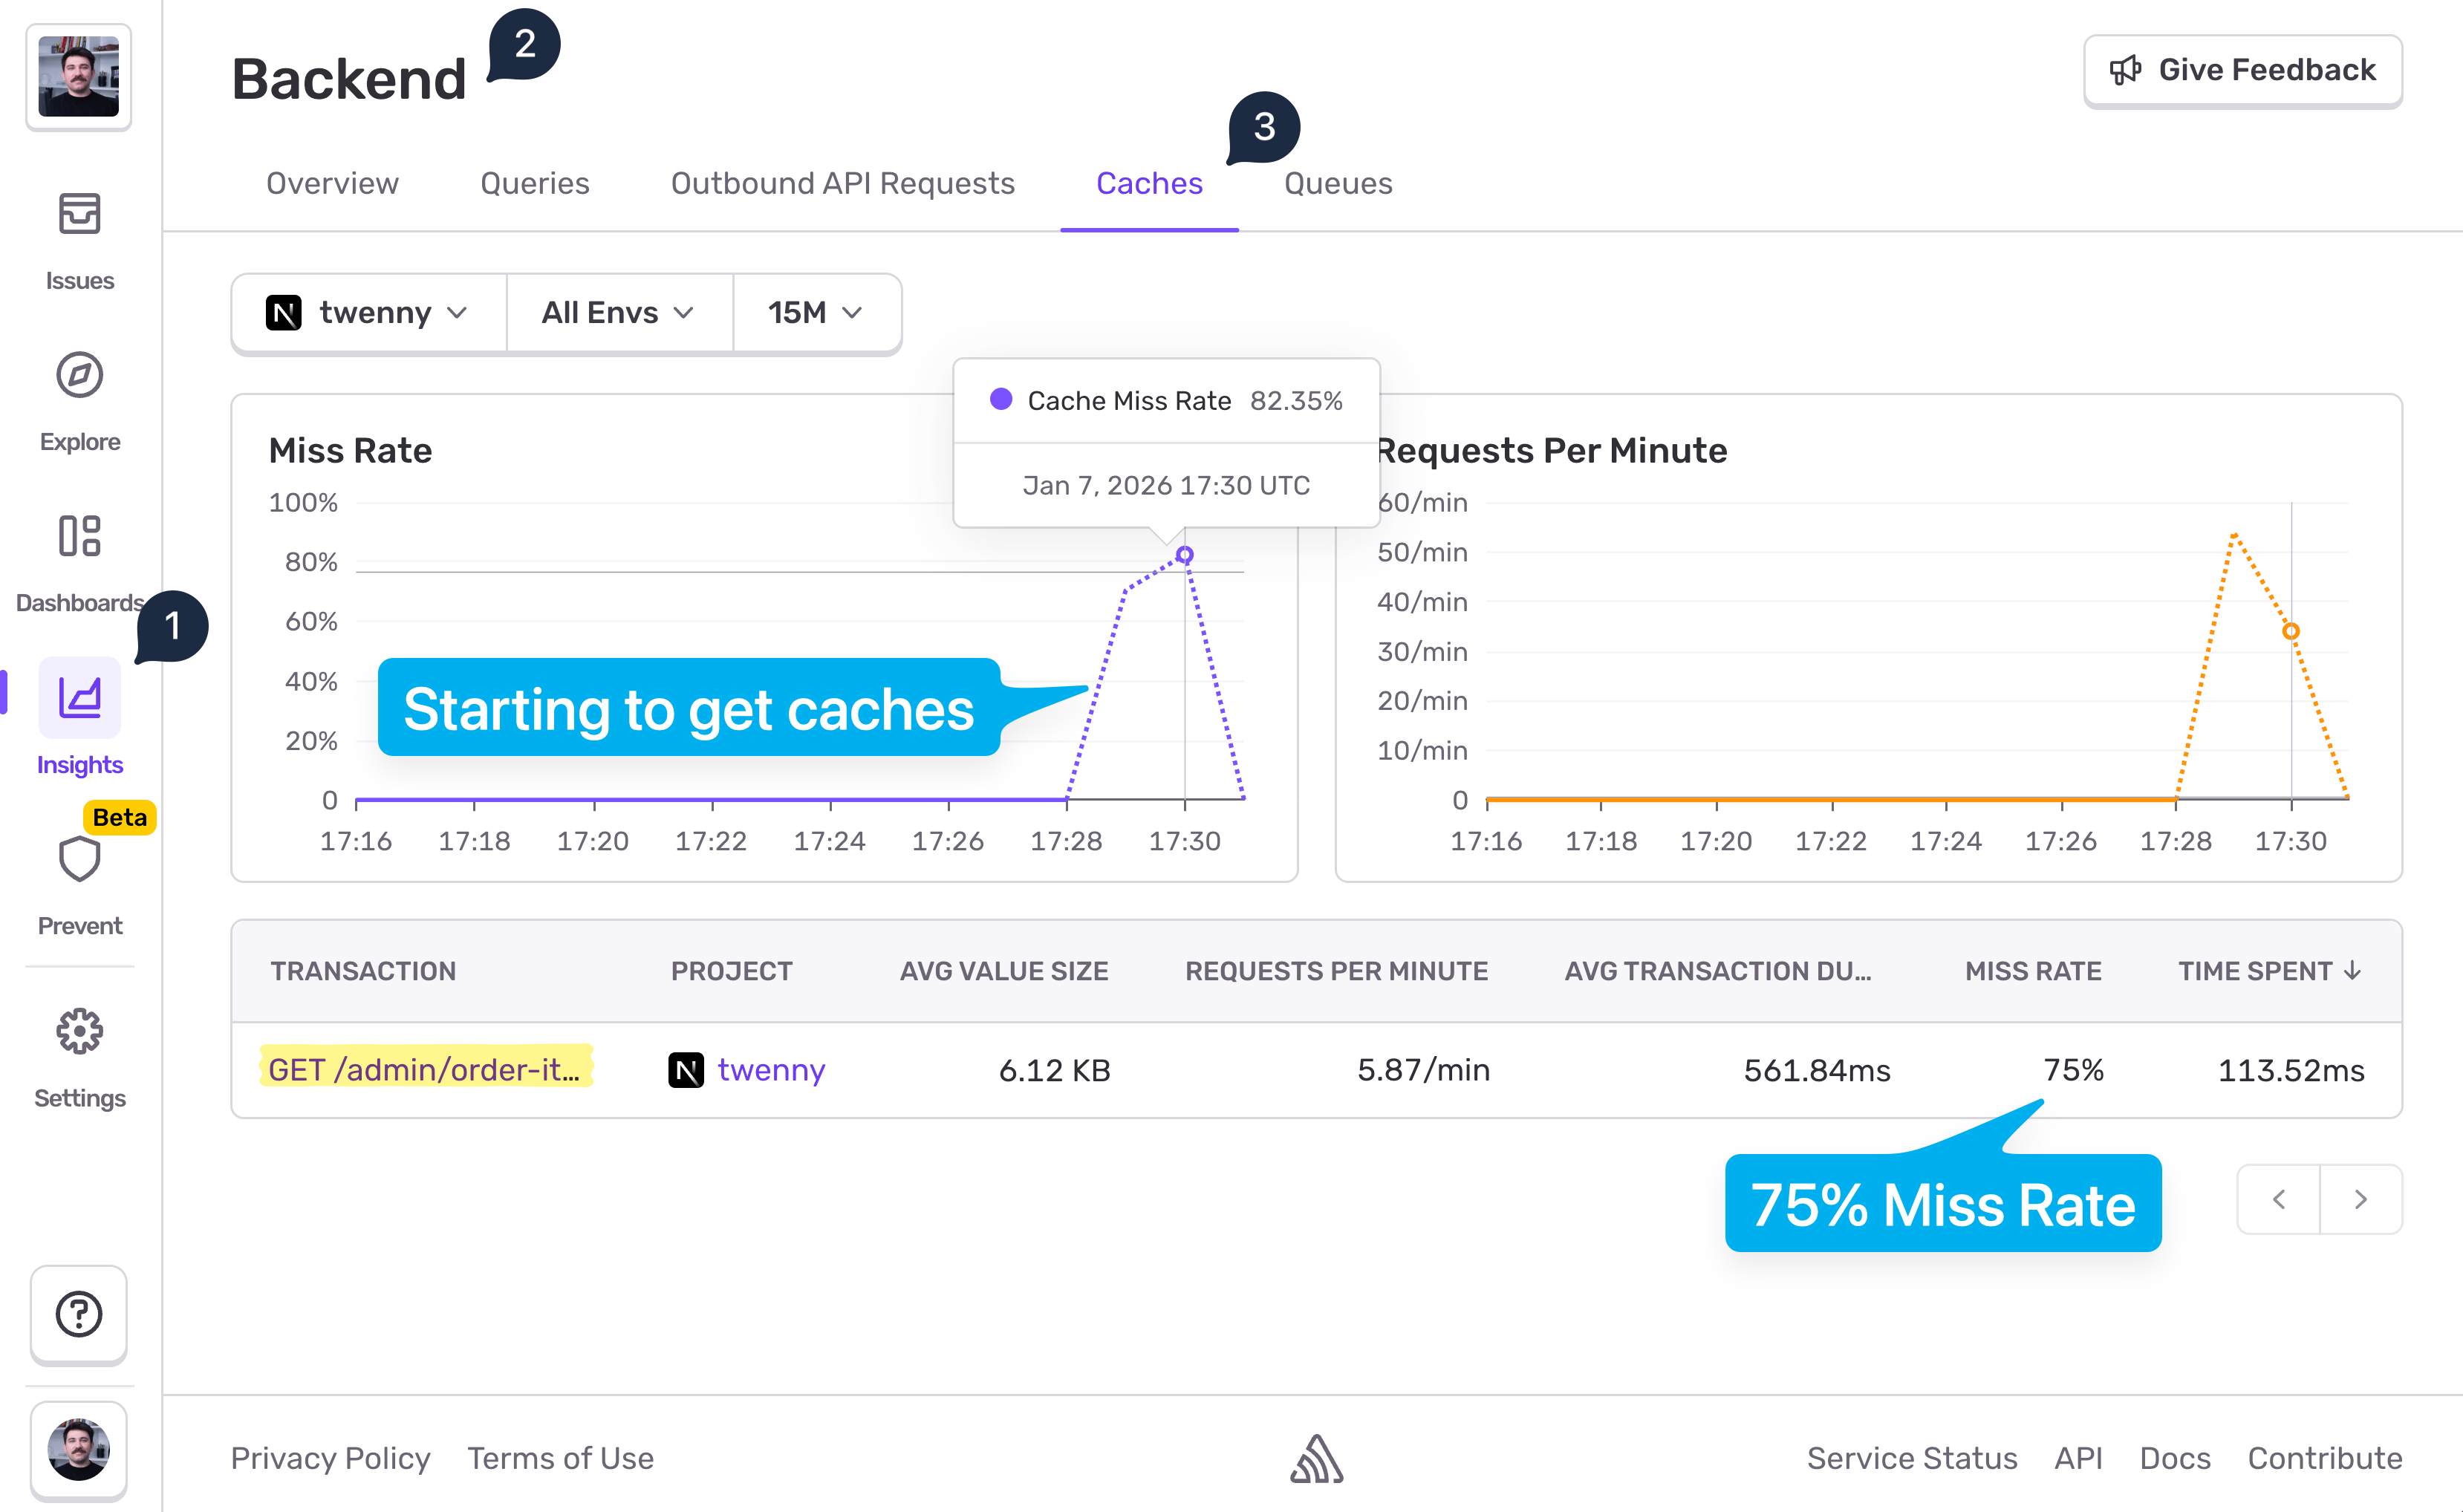
The data shows 75% Miss Rate on that endpoint. That's neither good nor bad by itself. The goal is not to reach 0% miss rate. If you do, you're probably hiding bugs. There is no "goal value" for the miss rate you should aim for. The miss rate % should only align with your expectations. 75% Miss Rate on this endpoint might make sense, but there also might be room for optimization. Let's click into the transaction to see actual events:
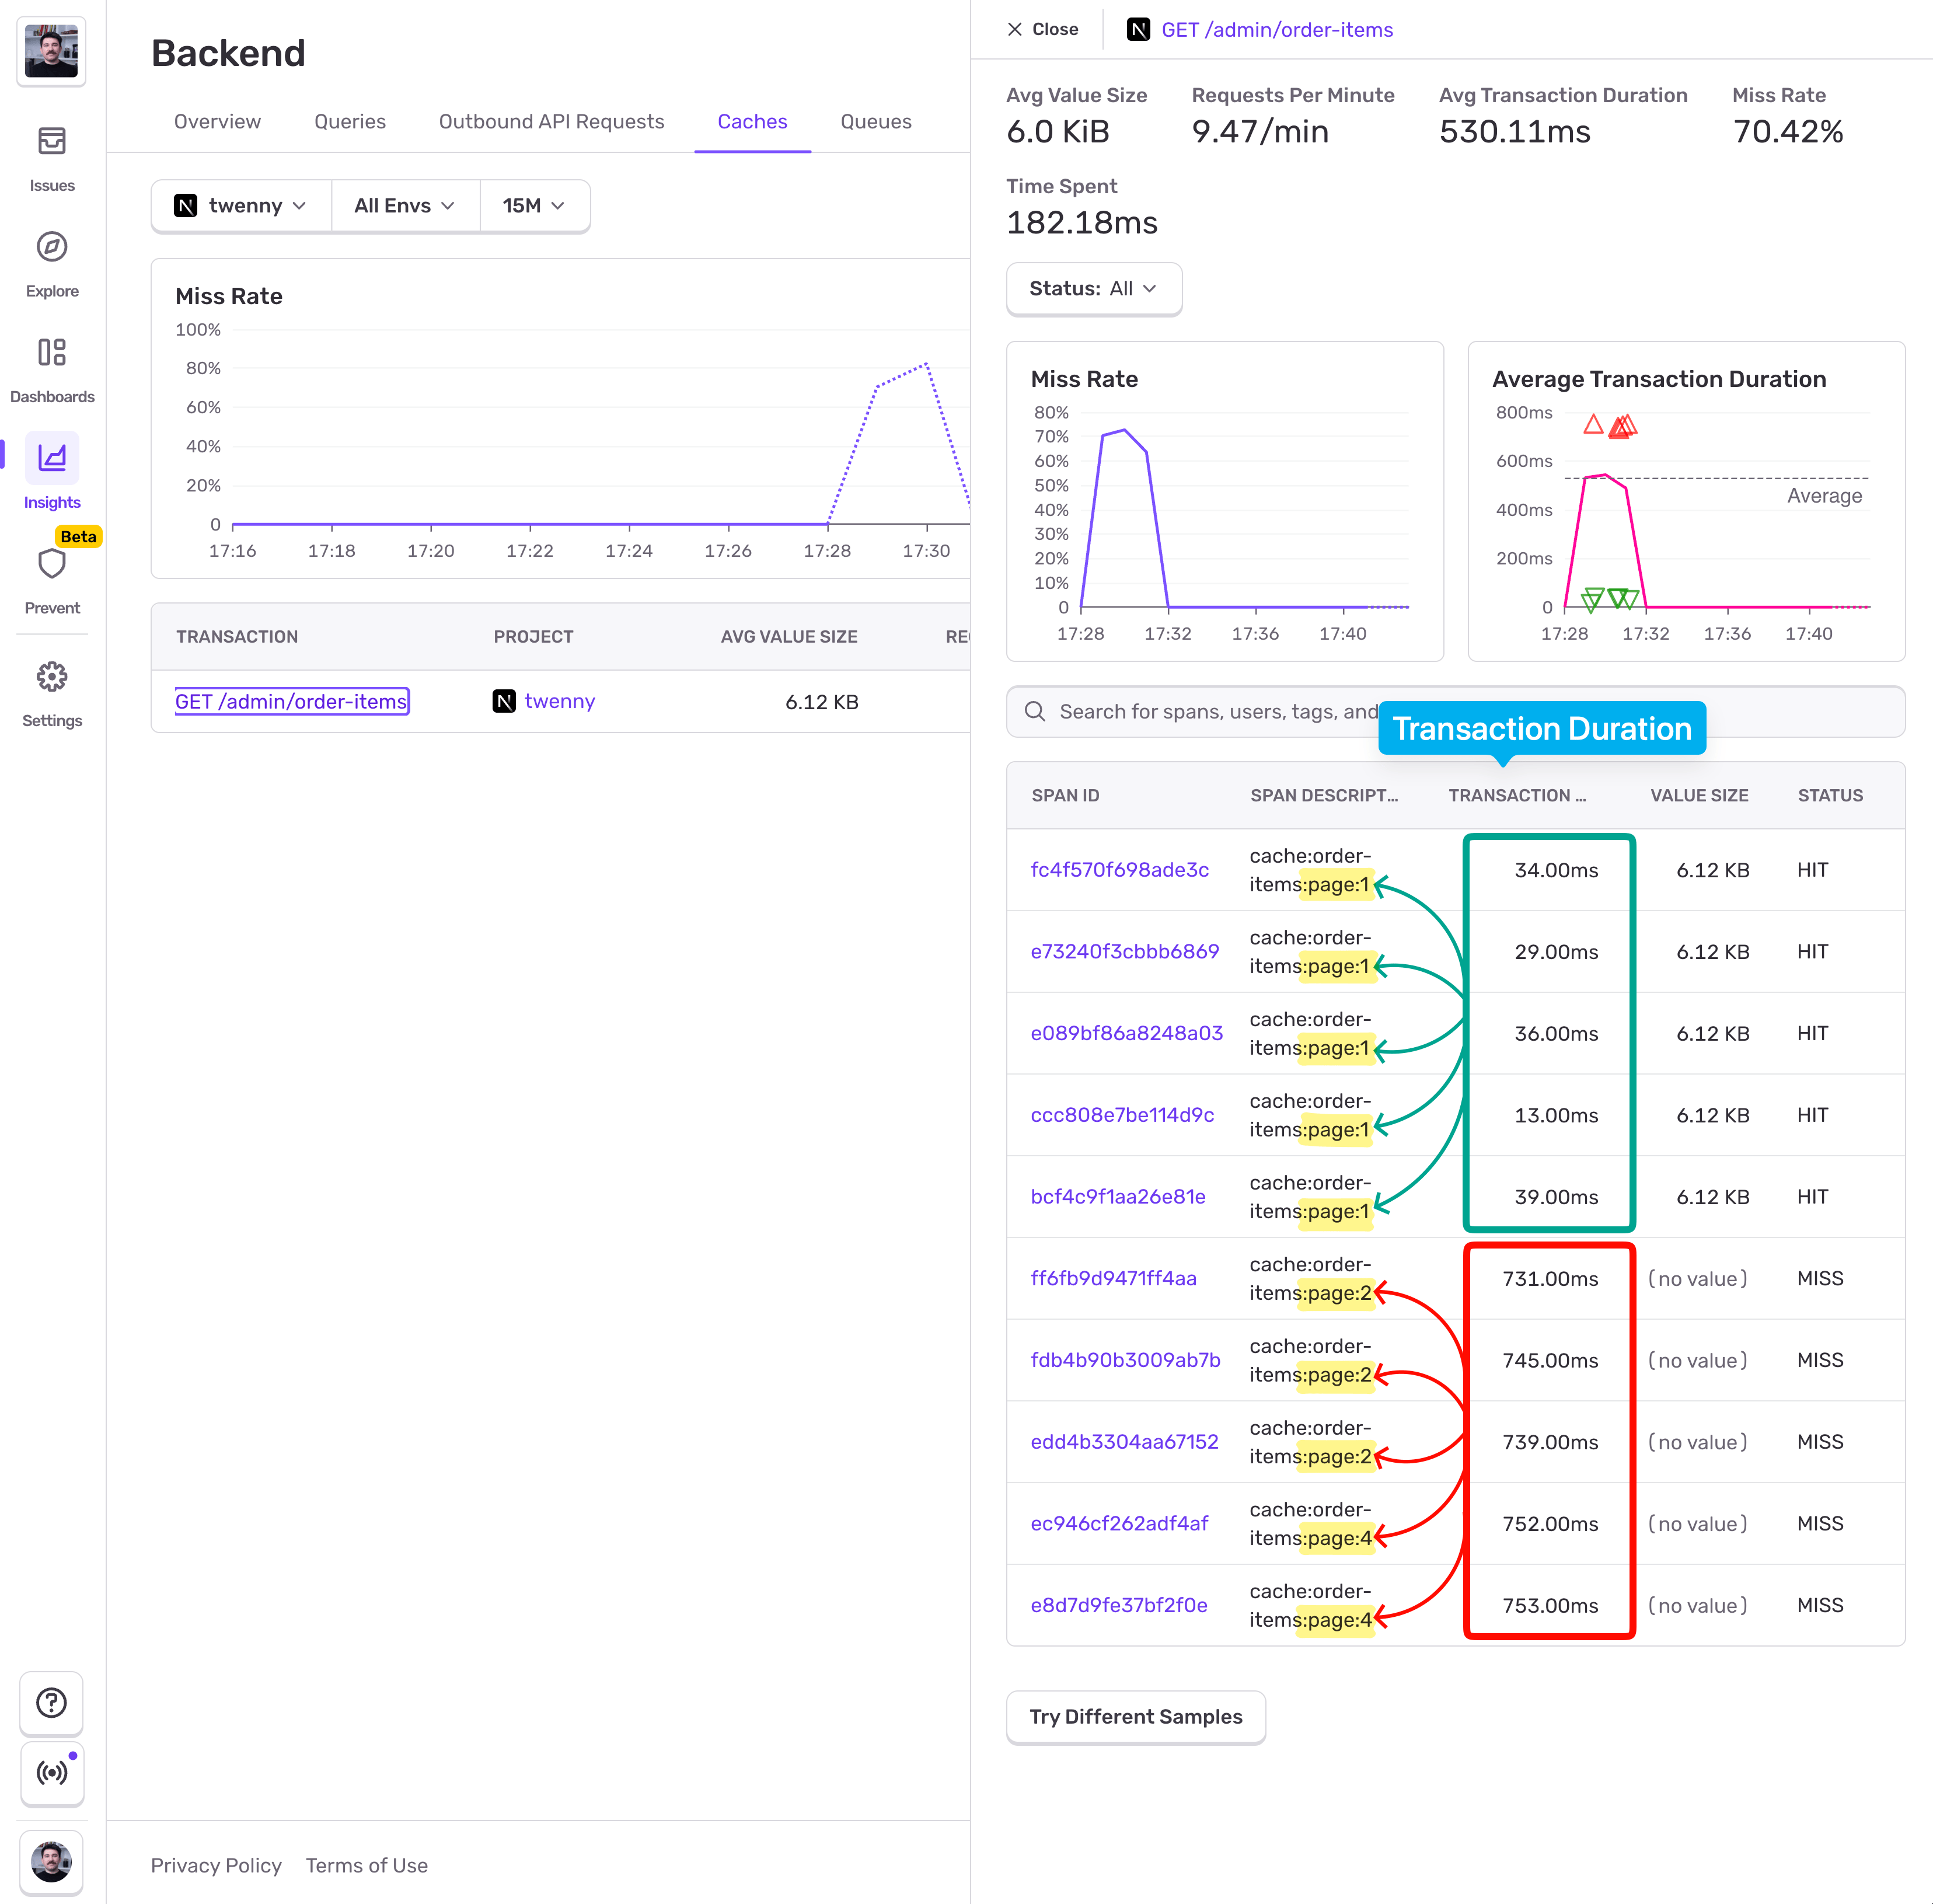
From the screenshot above we can see that cache hits happen only on page 1, and misses on the other pages. And that's because we followed the caching paginated endpoint advice - only cache page 1 and common filters. Users were visiting multiple pages, but Page 1 accounted for 25% of the visit, hence the 75% Miss Rate. From the Transaction Duration column we can see that Page 1 loaded in under 40ms, while for other pages the users had to wait >700ms.
So our caching implementation is working, and users are experiencing faster page loads. From this point on we'll know that for our /admin/order-items endpoint the normal miss rate sits around 75%. If we introduce a bug later on, for example buggy cache keys (missing params, extra params), new filters or sorting, per-user or per-flag keys creeping in, accidentally including volatile data in keys (timestamps, request IDs, locale), or mess up the TTL, this number is going to shoot up, and we'll see it in the chart. A spike in the chart will indicate to us that we broke caching and the users are experiencing slowdowns.
AI-assisted cache expansion in production
Remember the "cache only page 1 + common filters" rule? We're going to bend it a little bit. If we want to bring down the 75% Miss Rate above, we'll need to expand caching to cover more pages than just page 1, but we have to be careful not to over-expand because we'll bloat our Redis instance.
Here's a practical AI-assisted approach to help make a good cache expansion decision:
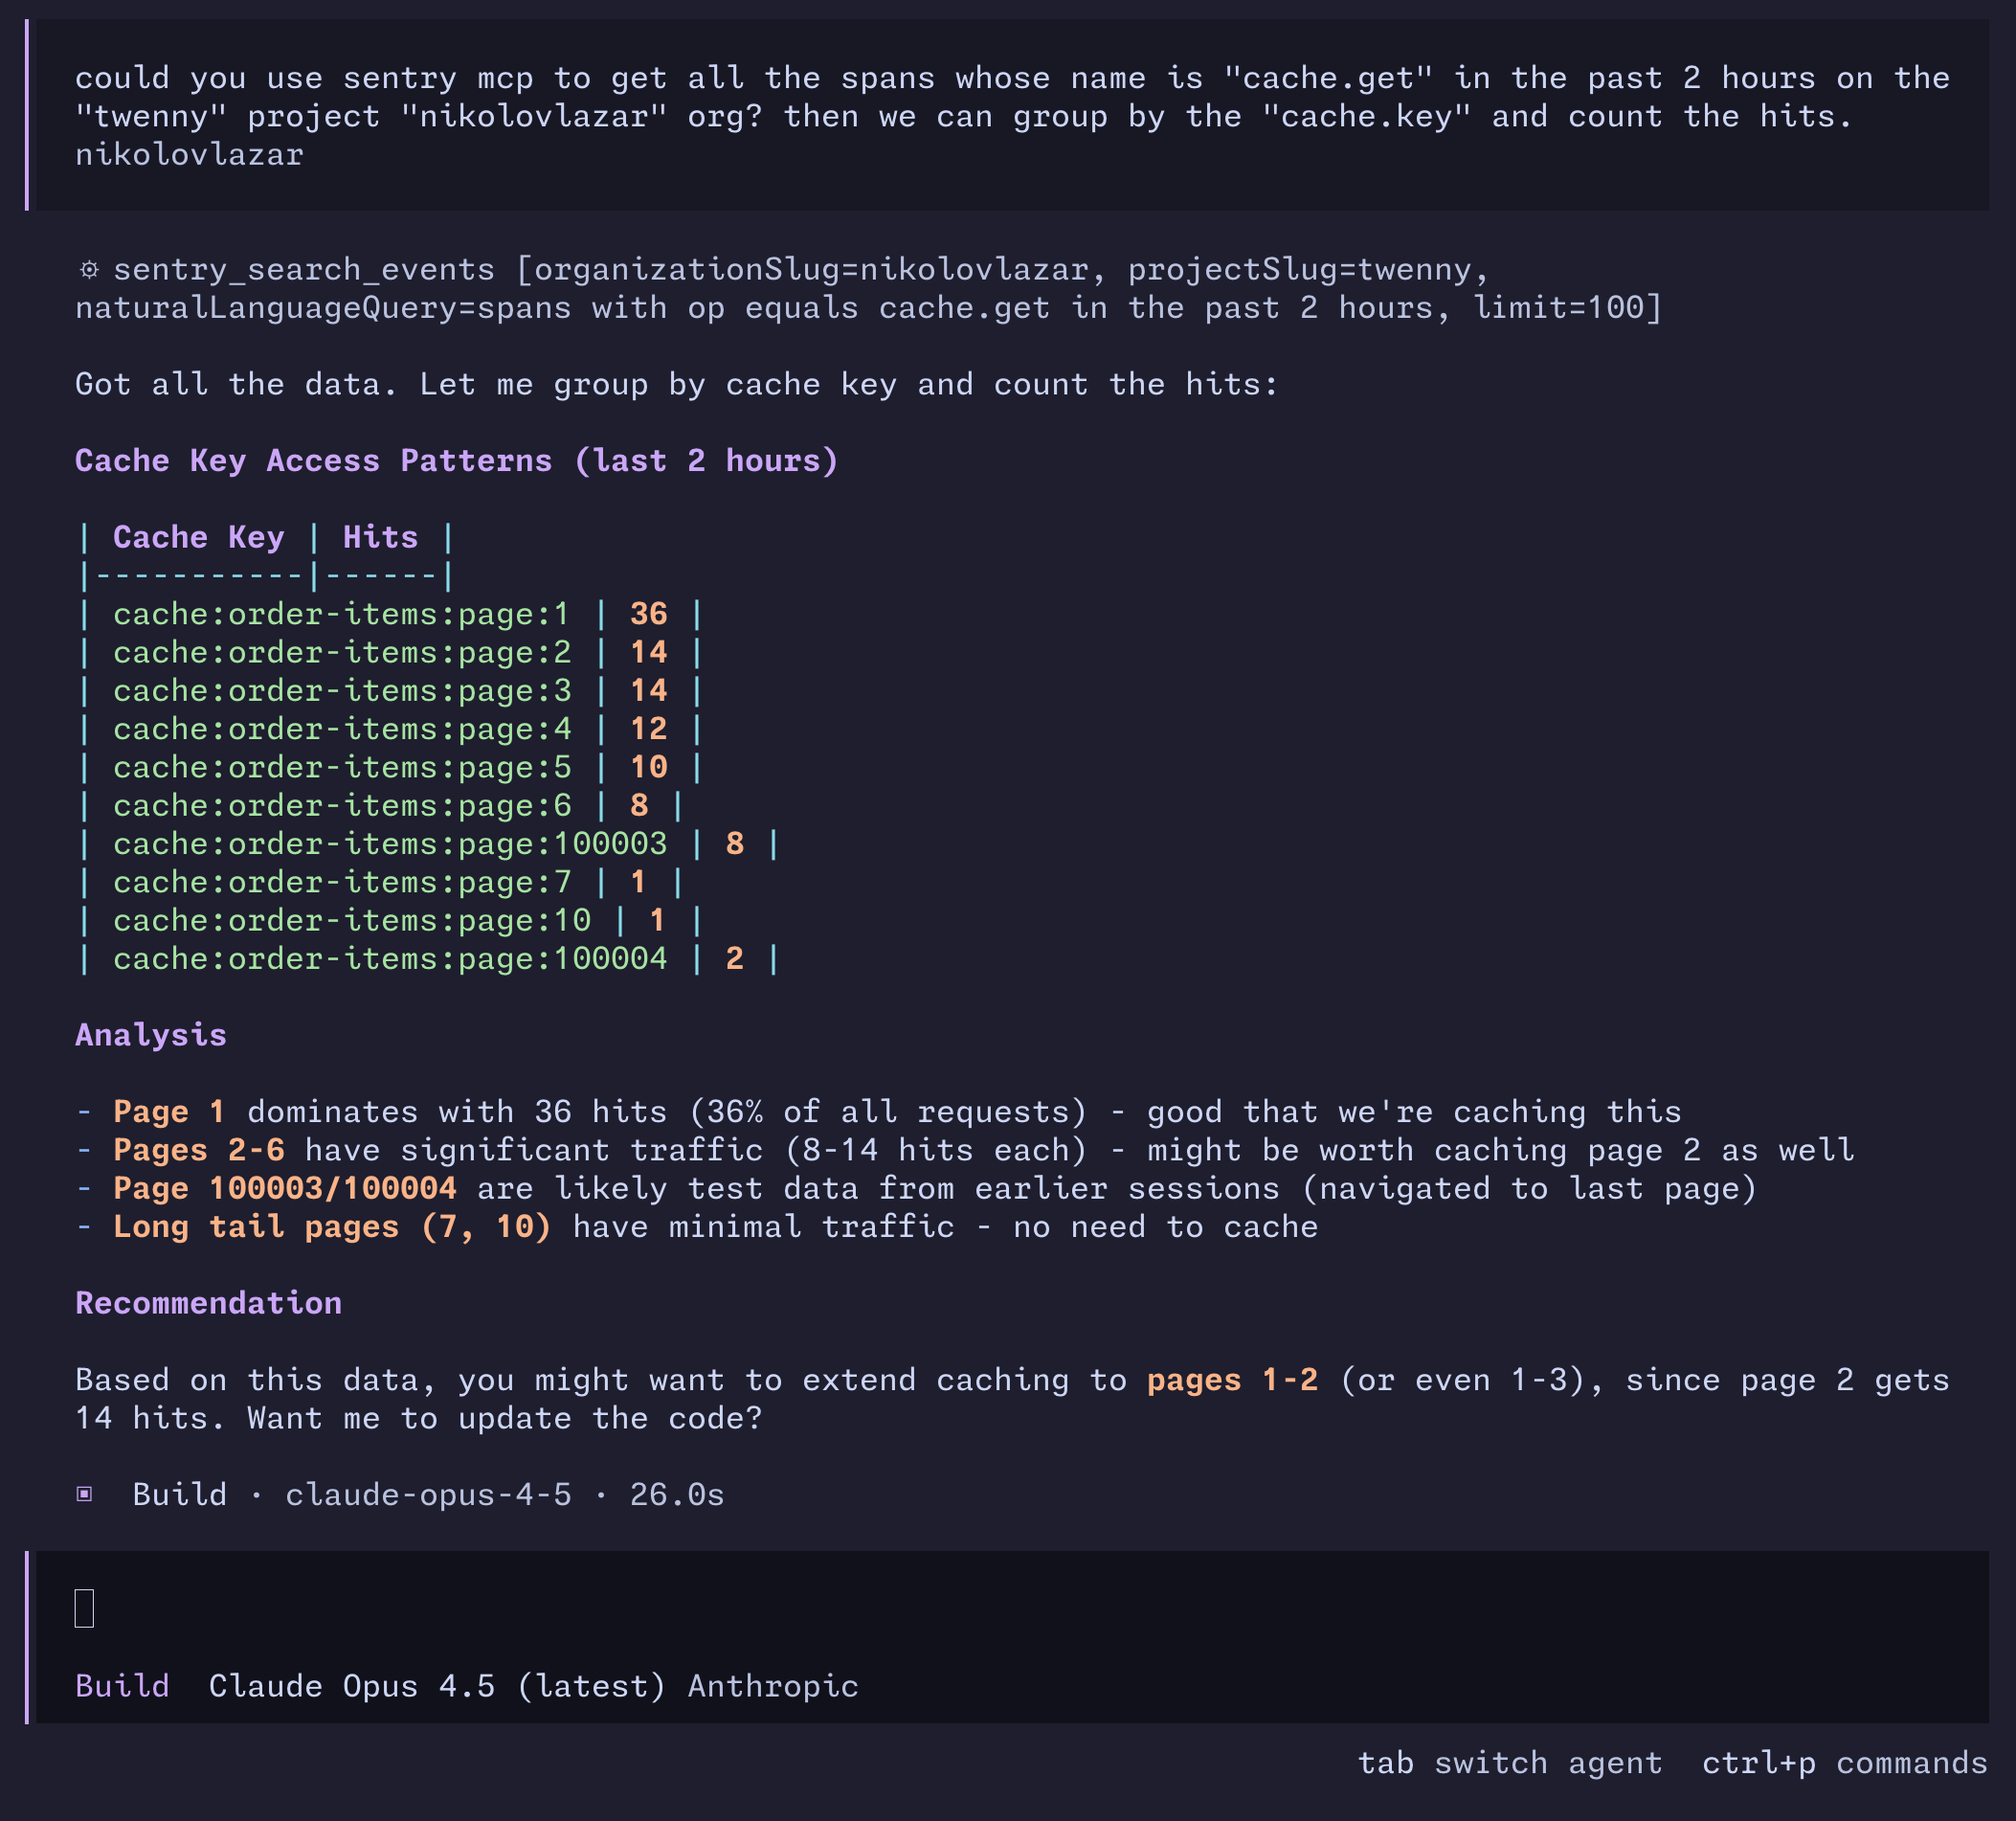
You can use Sentry Model Context Protocol (MCP) to pull all the cache.get spans from your project and group them by the cache.key property, and then ask the agent to suggest how we can expand the caching. Looking at the screenshot, we can see that Page 1 remains with the most hits, but Pages 2 - 6 have significant traffic too. Long-tail pages like 7 and 10 have minimal traffic so no need to cache, and there's also some test data that it discarded. It suggested me to expand the cache to Page 3. Let's see how that affects the Miss Rate:
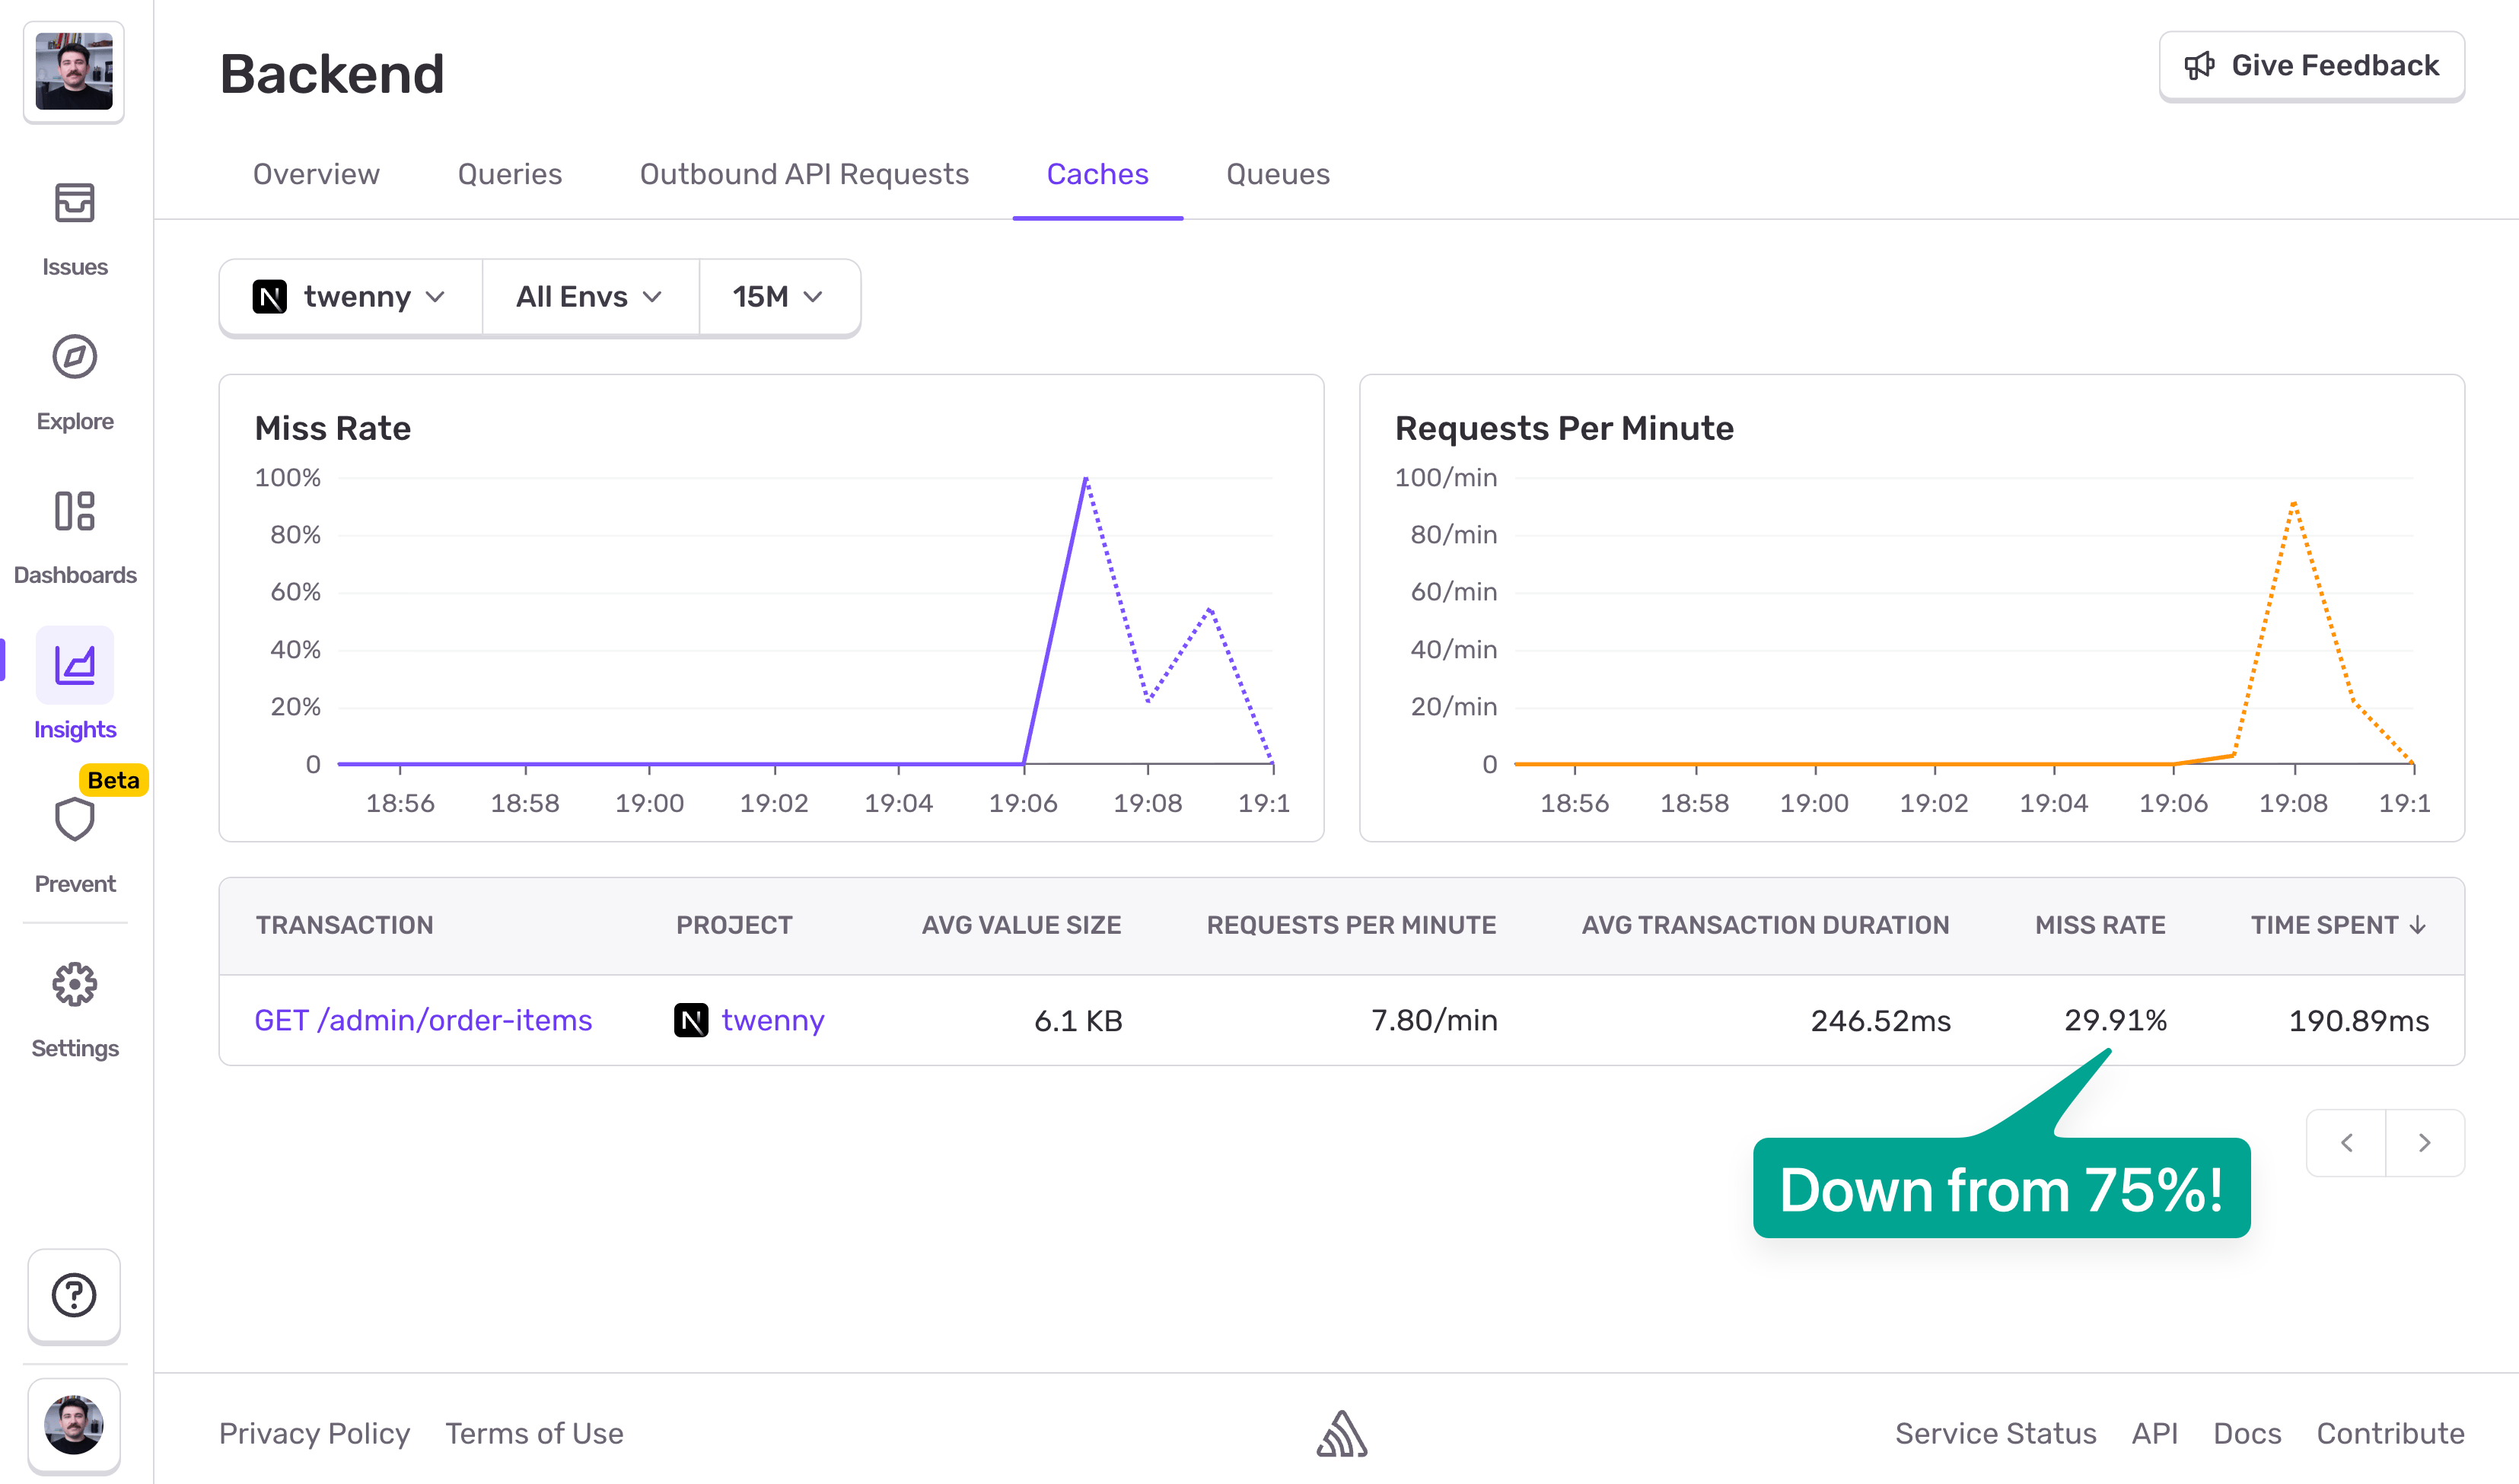
Would you look at that! We're now at 30% Miss Rate, down from 75%. This means roughly only 1 in 3 requests will hit the database. But it's important to keep an eye on Redis memory as well. Pushing caching from Page 1 to Page 3 might bloat our Redis instance, and in that case caching won't be worth it. Redis bloat = hot paths evictions, which in other words means we'd be undoing the performance gains we got from caching in the first place.
Alerting on miss rate deviations
The last thing you want to do is to set up an alert that notifies you (email, Slack) when there's an anomaly in cache misses. Head to Sentry > Issues > Alerts, pick Performance Throughput, and create an alert with the following options:
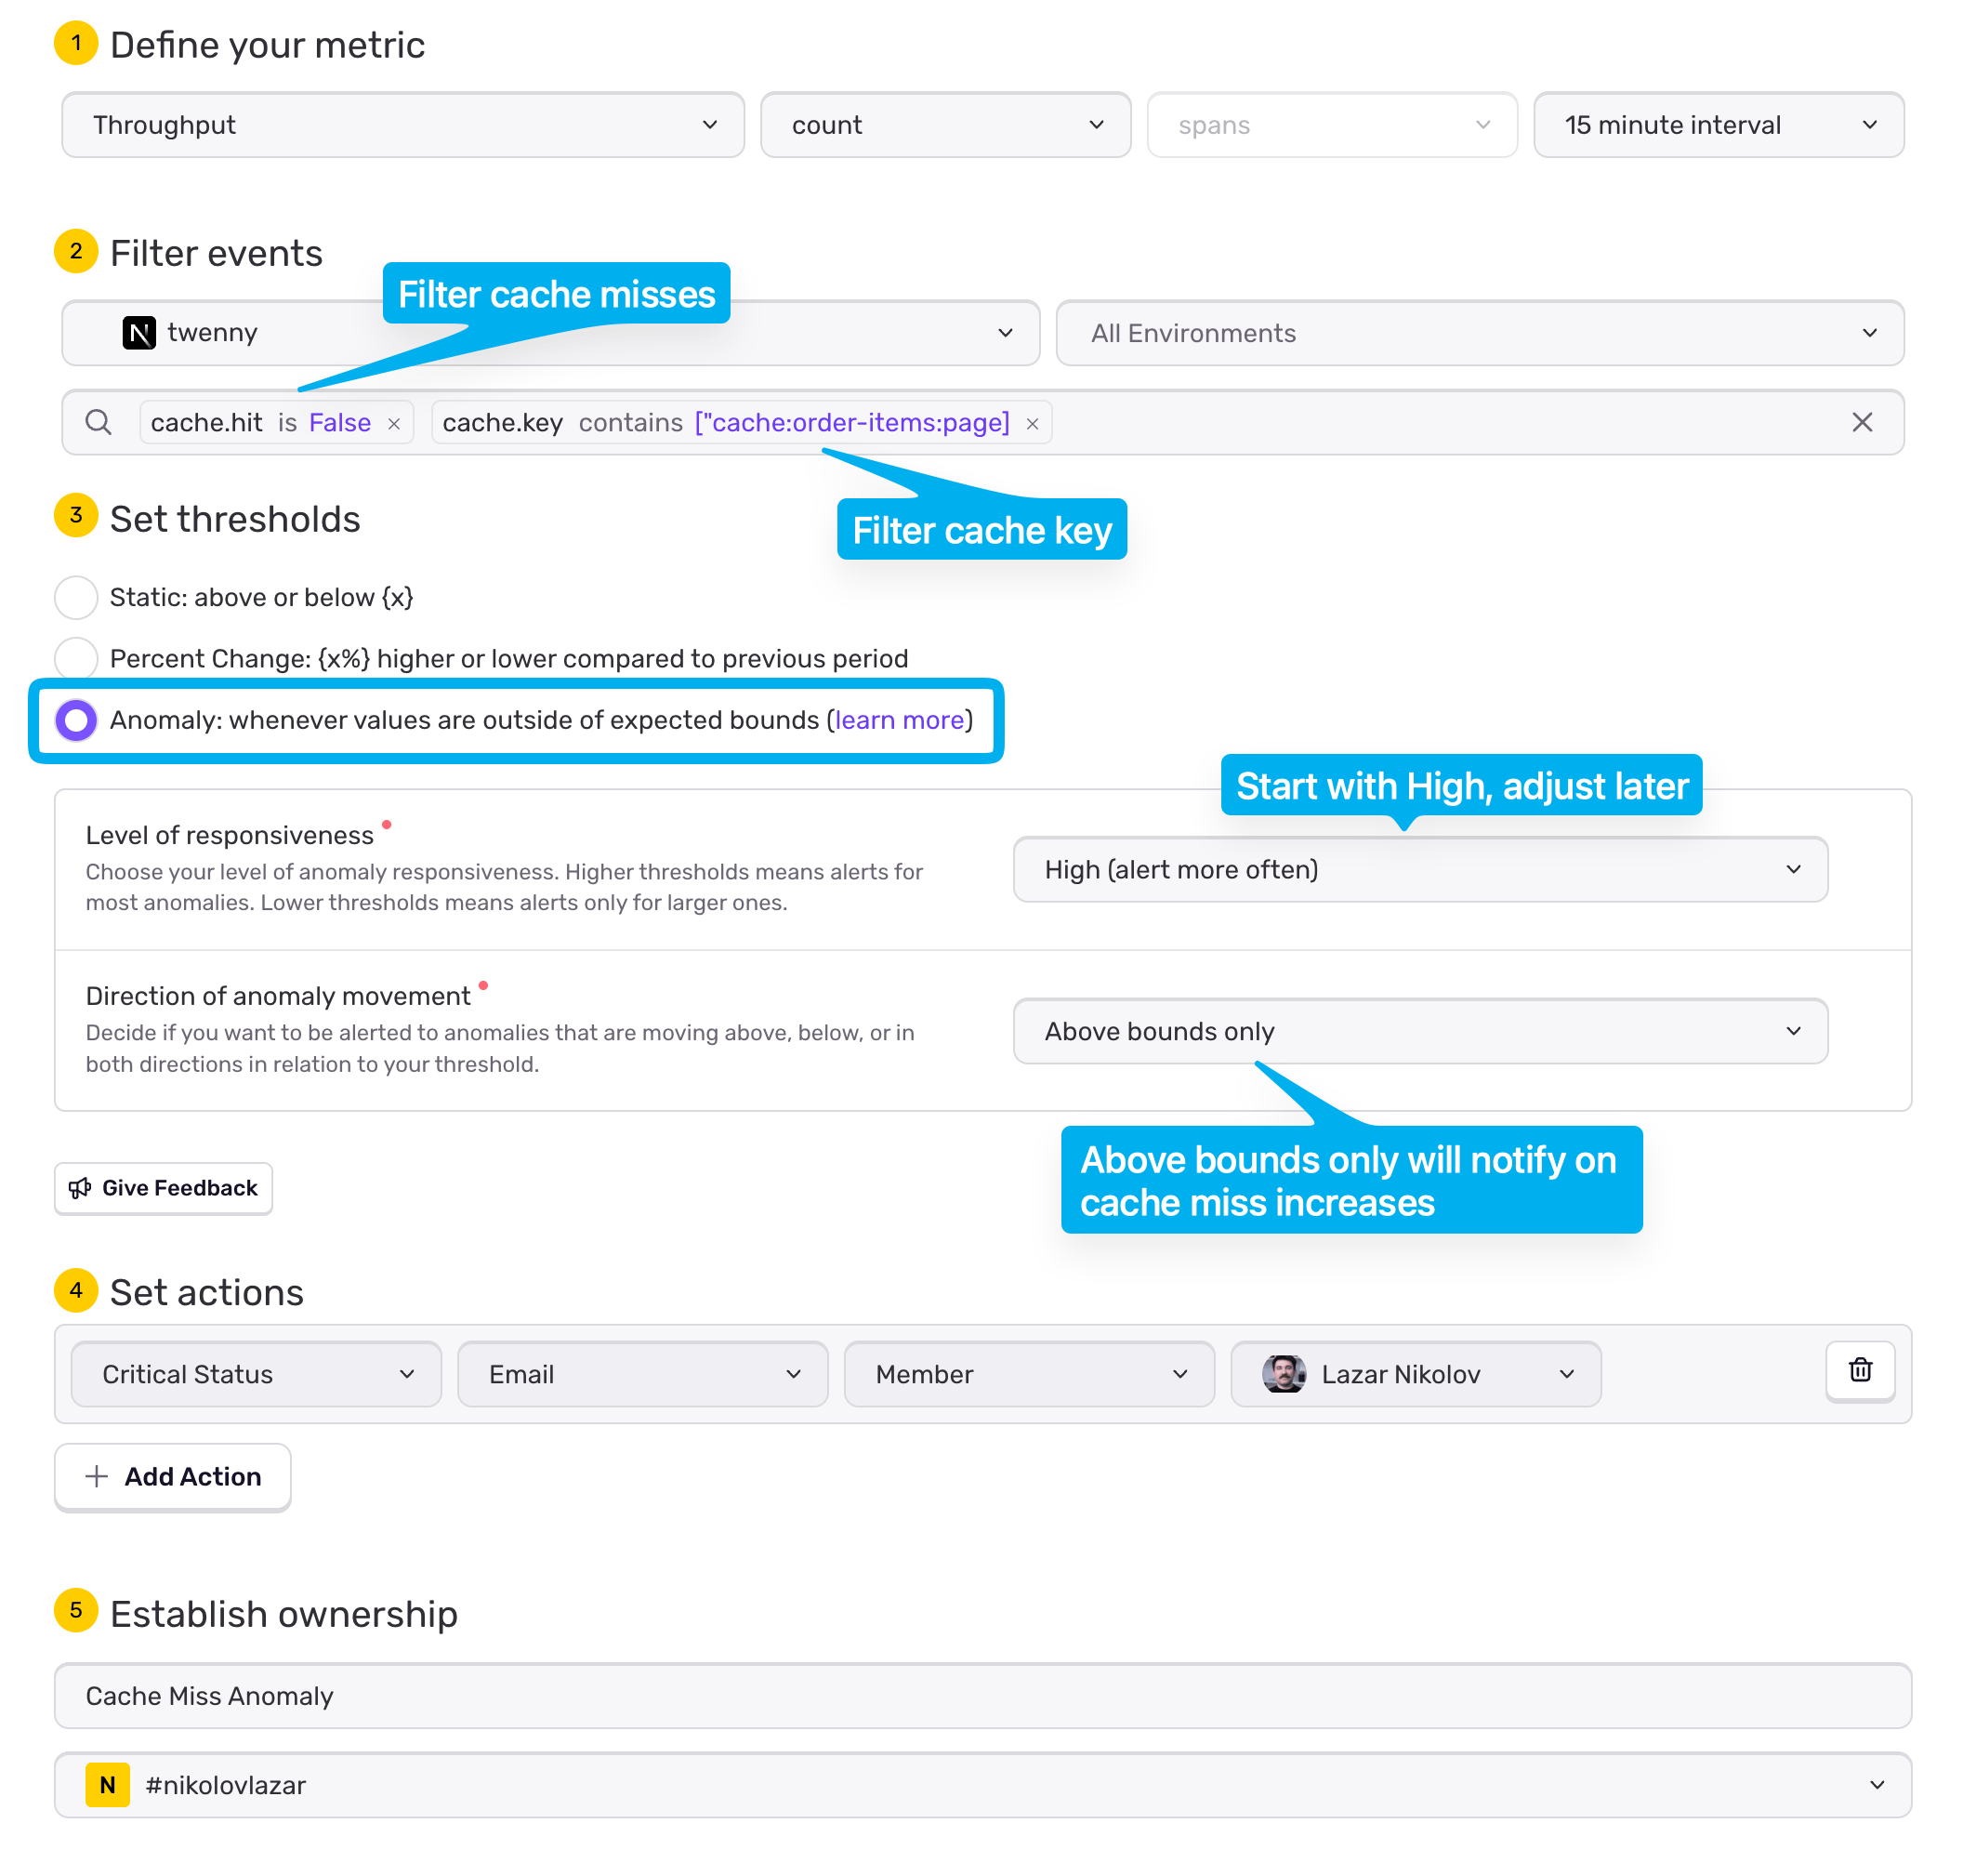
Make sure you pick your project and environment correctly
You'd want to filter on
cache.hitbeingFalse, and on yourcache.keyas wellSet the thresholds to Anomaly
Start with High level of responsiveness, and tune later
For Direction of anomaly movement you'd want Above bounds only so you only get notified on cache miss increases
Lastly, define your action, whether you want an email to yourself, or your team, or a slack message in a specific channel
Name it and hit "Save Rule"
That's it. Now if you accidentally break the caching mechanism, it'll result in a flood of cache misses, and Sentry will pick it up and notify you about it. You're free to filter as you want, and create as many alerts as you want. cache.hit and cache.key are not the only attributes you can filter on. Play with the filter bar to figure out all the ways you can filter on.
Where to go from here
At this point, caching is working. The endpoint is faster, the database is protected, and you have a baseline Miss Rate that reflects normal behaviour. From here on, the work is less about adding caching, and more about making sure it keeps doing what it's supposed to do.
The first thing to watch is Miss Rate deviations, not the absolute number. A stable line that suddenly jumps usually means something changed: a cache key bug, new filters or sorting, increased cardinality, or a TTL or invalidation mistake introduced during a deploy. Those changes tend to show up in cache metrics before users start complaining.
Next, always read Miss Rate together with latency. A higher Miss Rate that doesn't affect P95/P99 is usually harmless. A higher Miss Rate that brings the database spans back into the critical path is a regression worth acting on.
As you expand caching, keep an eye on Redis memory and evictions. Improving hit rates by caching more pages only helps if hot keys stay resident. Memory pressure that causes frequent evictions can quietly undo your gains and make cache behaviour unpredictable.
Finally, revisit cache boundaries as traffic evolves. Usage patterns change. What was a long-tail page last month may become hot after a product change or a new workflow. Cache strategies should evolve with real traffic, not stay frozen around initial assumptions.
If you treat cache metrics as guardrails (baseline Miss Rates, latency correlations, and post-deploy checks) caching becomes a stable part of your system instead of a fragile optimization you're afraid to touch.