Automate, Group, and Get Alerted: A Best Practices Guide to Monitoring your Code - Part 2
Automate, Group, and Get Alerted: A Best Practices Guide to Monitoring your Code - Part 2
Missed part one? Check out the full guide here.
As companies grow, so do their products, teams, and the number of external tools. For engineers, that can mean code sprawl, data silos, notification fatigue, and some "what the...?" moments along the way as they try to make sense of it all.
To help combat the chaos, Sentry provides several ways to manage the volume, noise, and potential team disconnects that come with launching and scaling projects so you can see the issues that actually matter and solve them faster – without the expletives.
3. Solve issues faster with ownership rules, alerts, and trace view
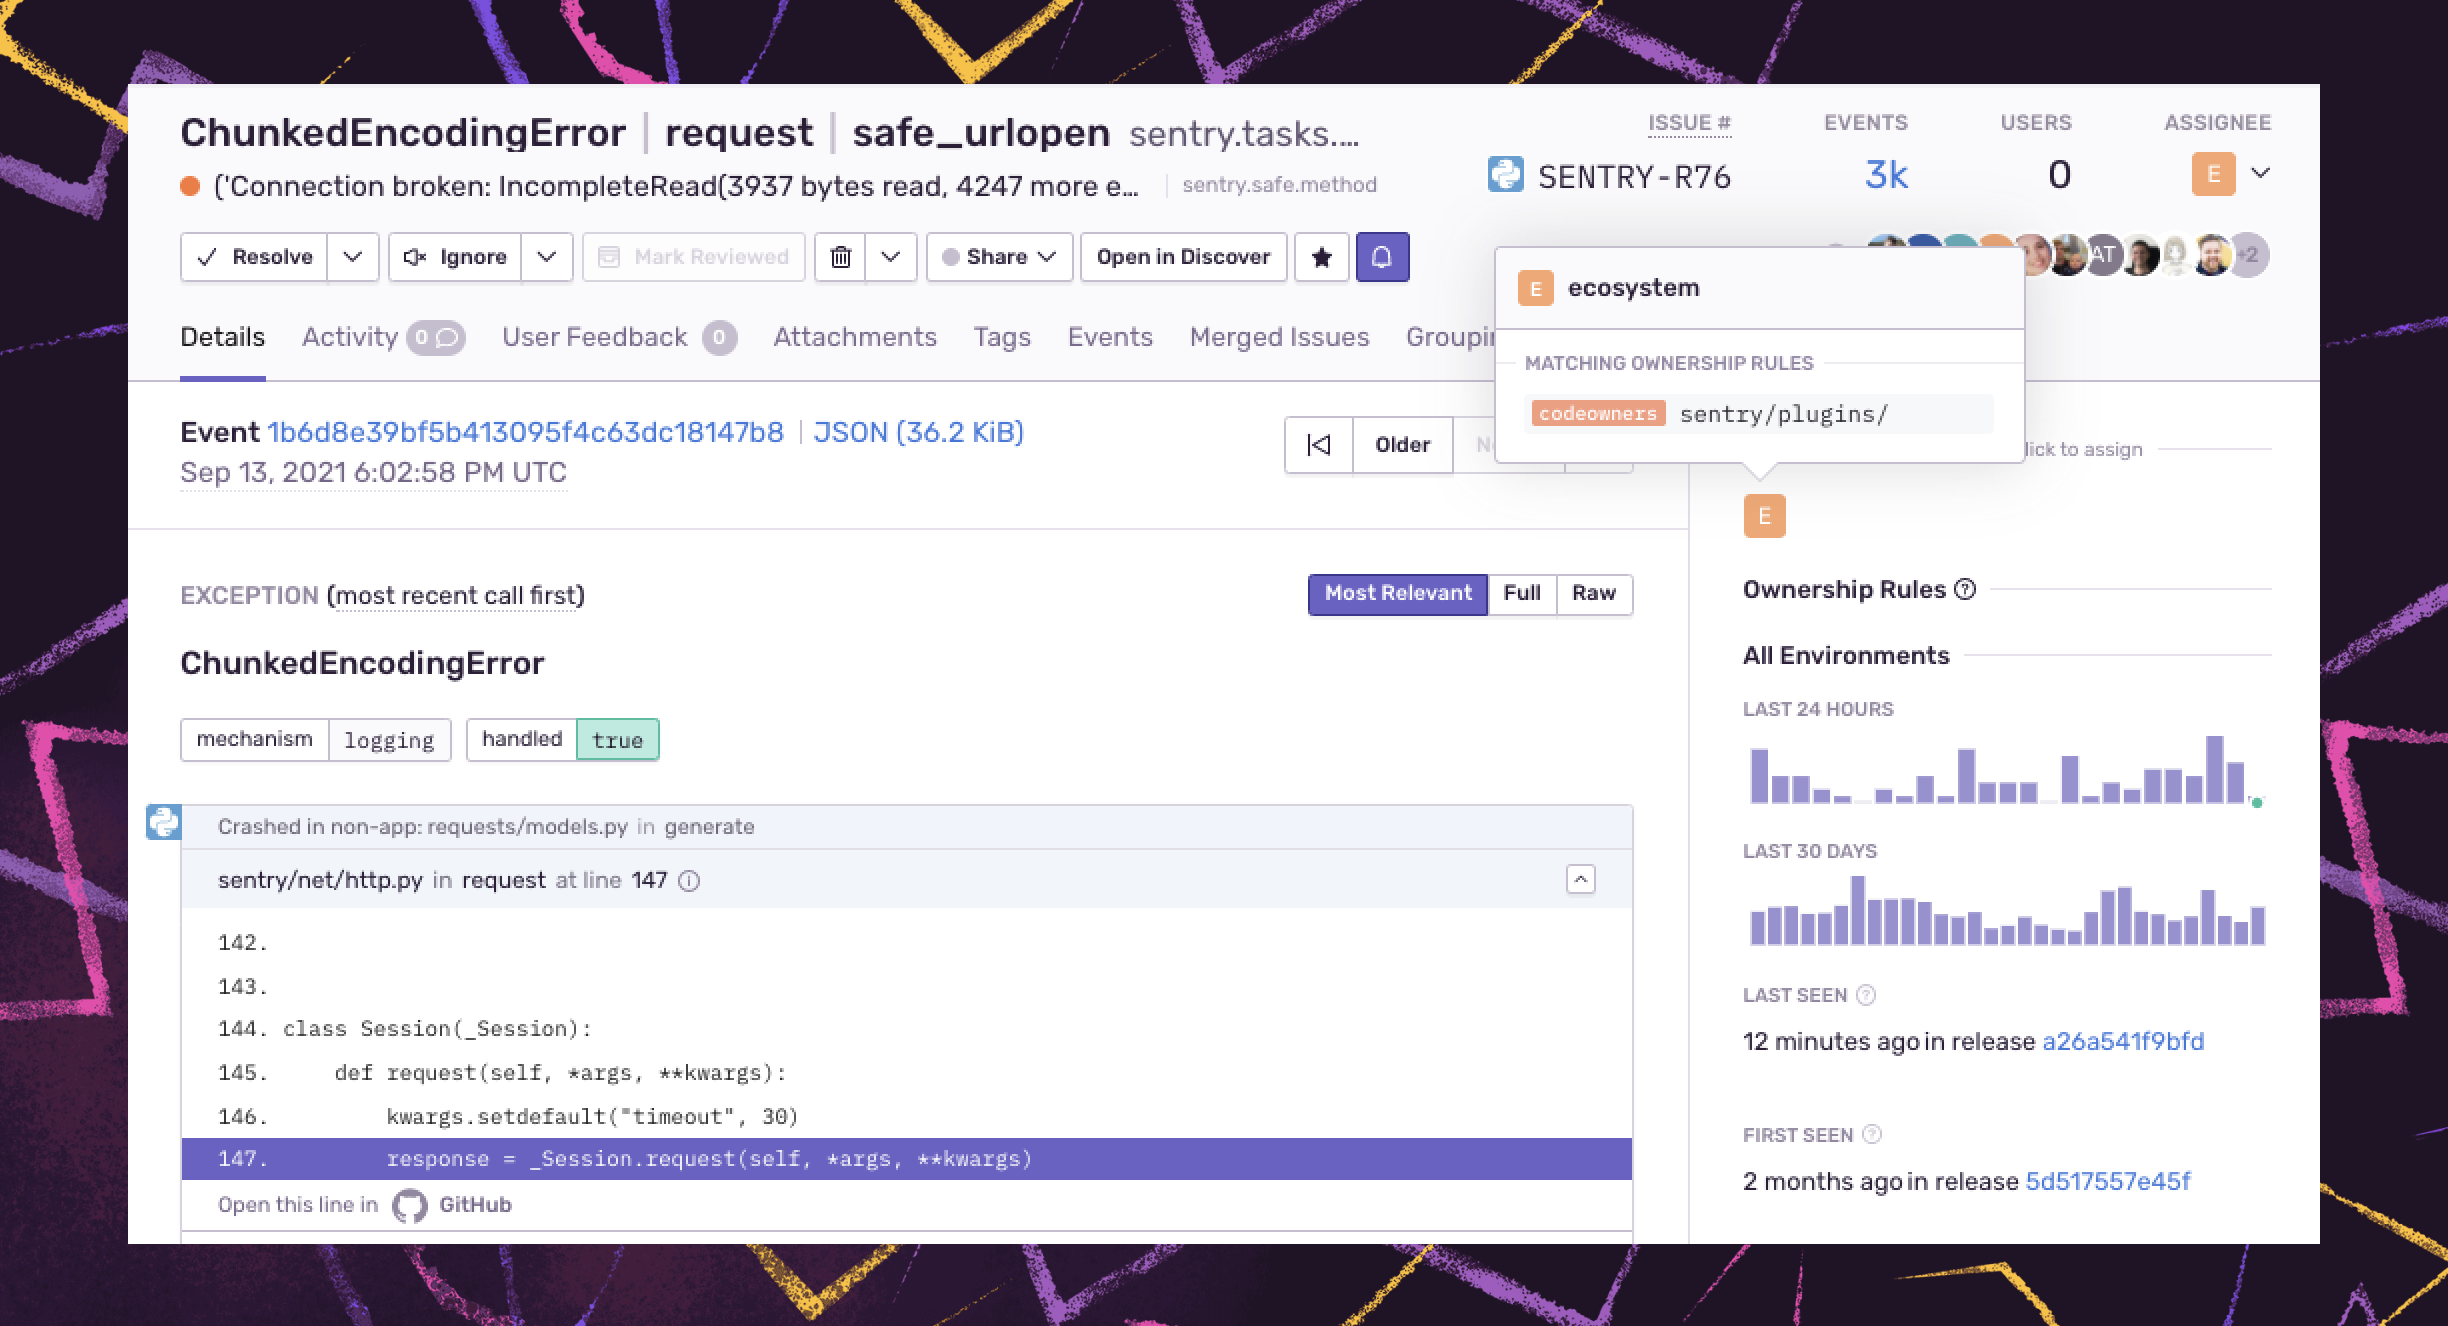
Teams can take action faster when issues are owned. Sentry provides ownership rules to facilitate finding the who behind the code so you can streamline time to resolution.
For those that currently use GitHub or GitLab CODEOWNERS files, you can now import your existing files in Sentry using Code Owners, allowing you to automatically assign issues or route alerts to the responsible individuals or teams.
Sentry uses ownership rules to surface suggested assignees during the triage process and assign those issues to team members automatically, so developers only see the issues they care about, and product owners spend less time managing the queue.
We also have the concept of Suspect Commits. Suspect Commits highlights the commit that introduced the error and the person who introduced it, so you can reproduce and solve the issues you own faster. In your release process, add a step to create a release in Sentry and associate it with commits from your linked repository to get started.
Set alerts and notifications
Coupled with Ownership Rules, you can set alerts and notifications to go directly to the corresponding individual or team who owns the code in the tools they use every day like Jira, Slack, email, and Pagerduty. Slack, for example, can send workflow notifications, deploy notifications, and alerts directly to teams and individuals where they can triage and resolve issues directly in chat.
However, it is not enough to alert the right people in the right place. The most effective alerts are also sent at the right time, frequency, and with the right context to take action quickly.
That's why we offer issue and metric alerts, so you only receive alerts when an issue meets specific trigger criteria you set, like if a resolved issue is re-appearing or an issue is affecting a percentage of sessions.
Percent-based alerts, for example, adjust to the changes in app usage so you can set alerts to trigger when an issue exceeds a certain percentage of user sessions in a period, allowing you to prioritize issues based on user impact.
Performance-based metric alerts are another way to leverage aggregates (p50 duration, p75 LCP, etc.) to improve alerting triggers and behavior. Metric alerts tell you when a metric crosses a threshold, such as a spike in the number of errors in a project, or a change in a performance metric, like latency, Apdex, failure rate, or throughput.
To further control noise, Sentry not only evaluates the specified "When" trigger criteria each time it receives a new event but also checks the "If" conditions filters, such as if the issue is older than a certain duration or if the event is from your latest release. Last, Sentry will only send a notification after checking the Action Interval, which controls how often the alert can be triggered for a particular issue.
Triage performance issues with trace view and trace navigator
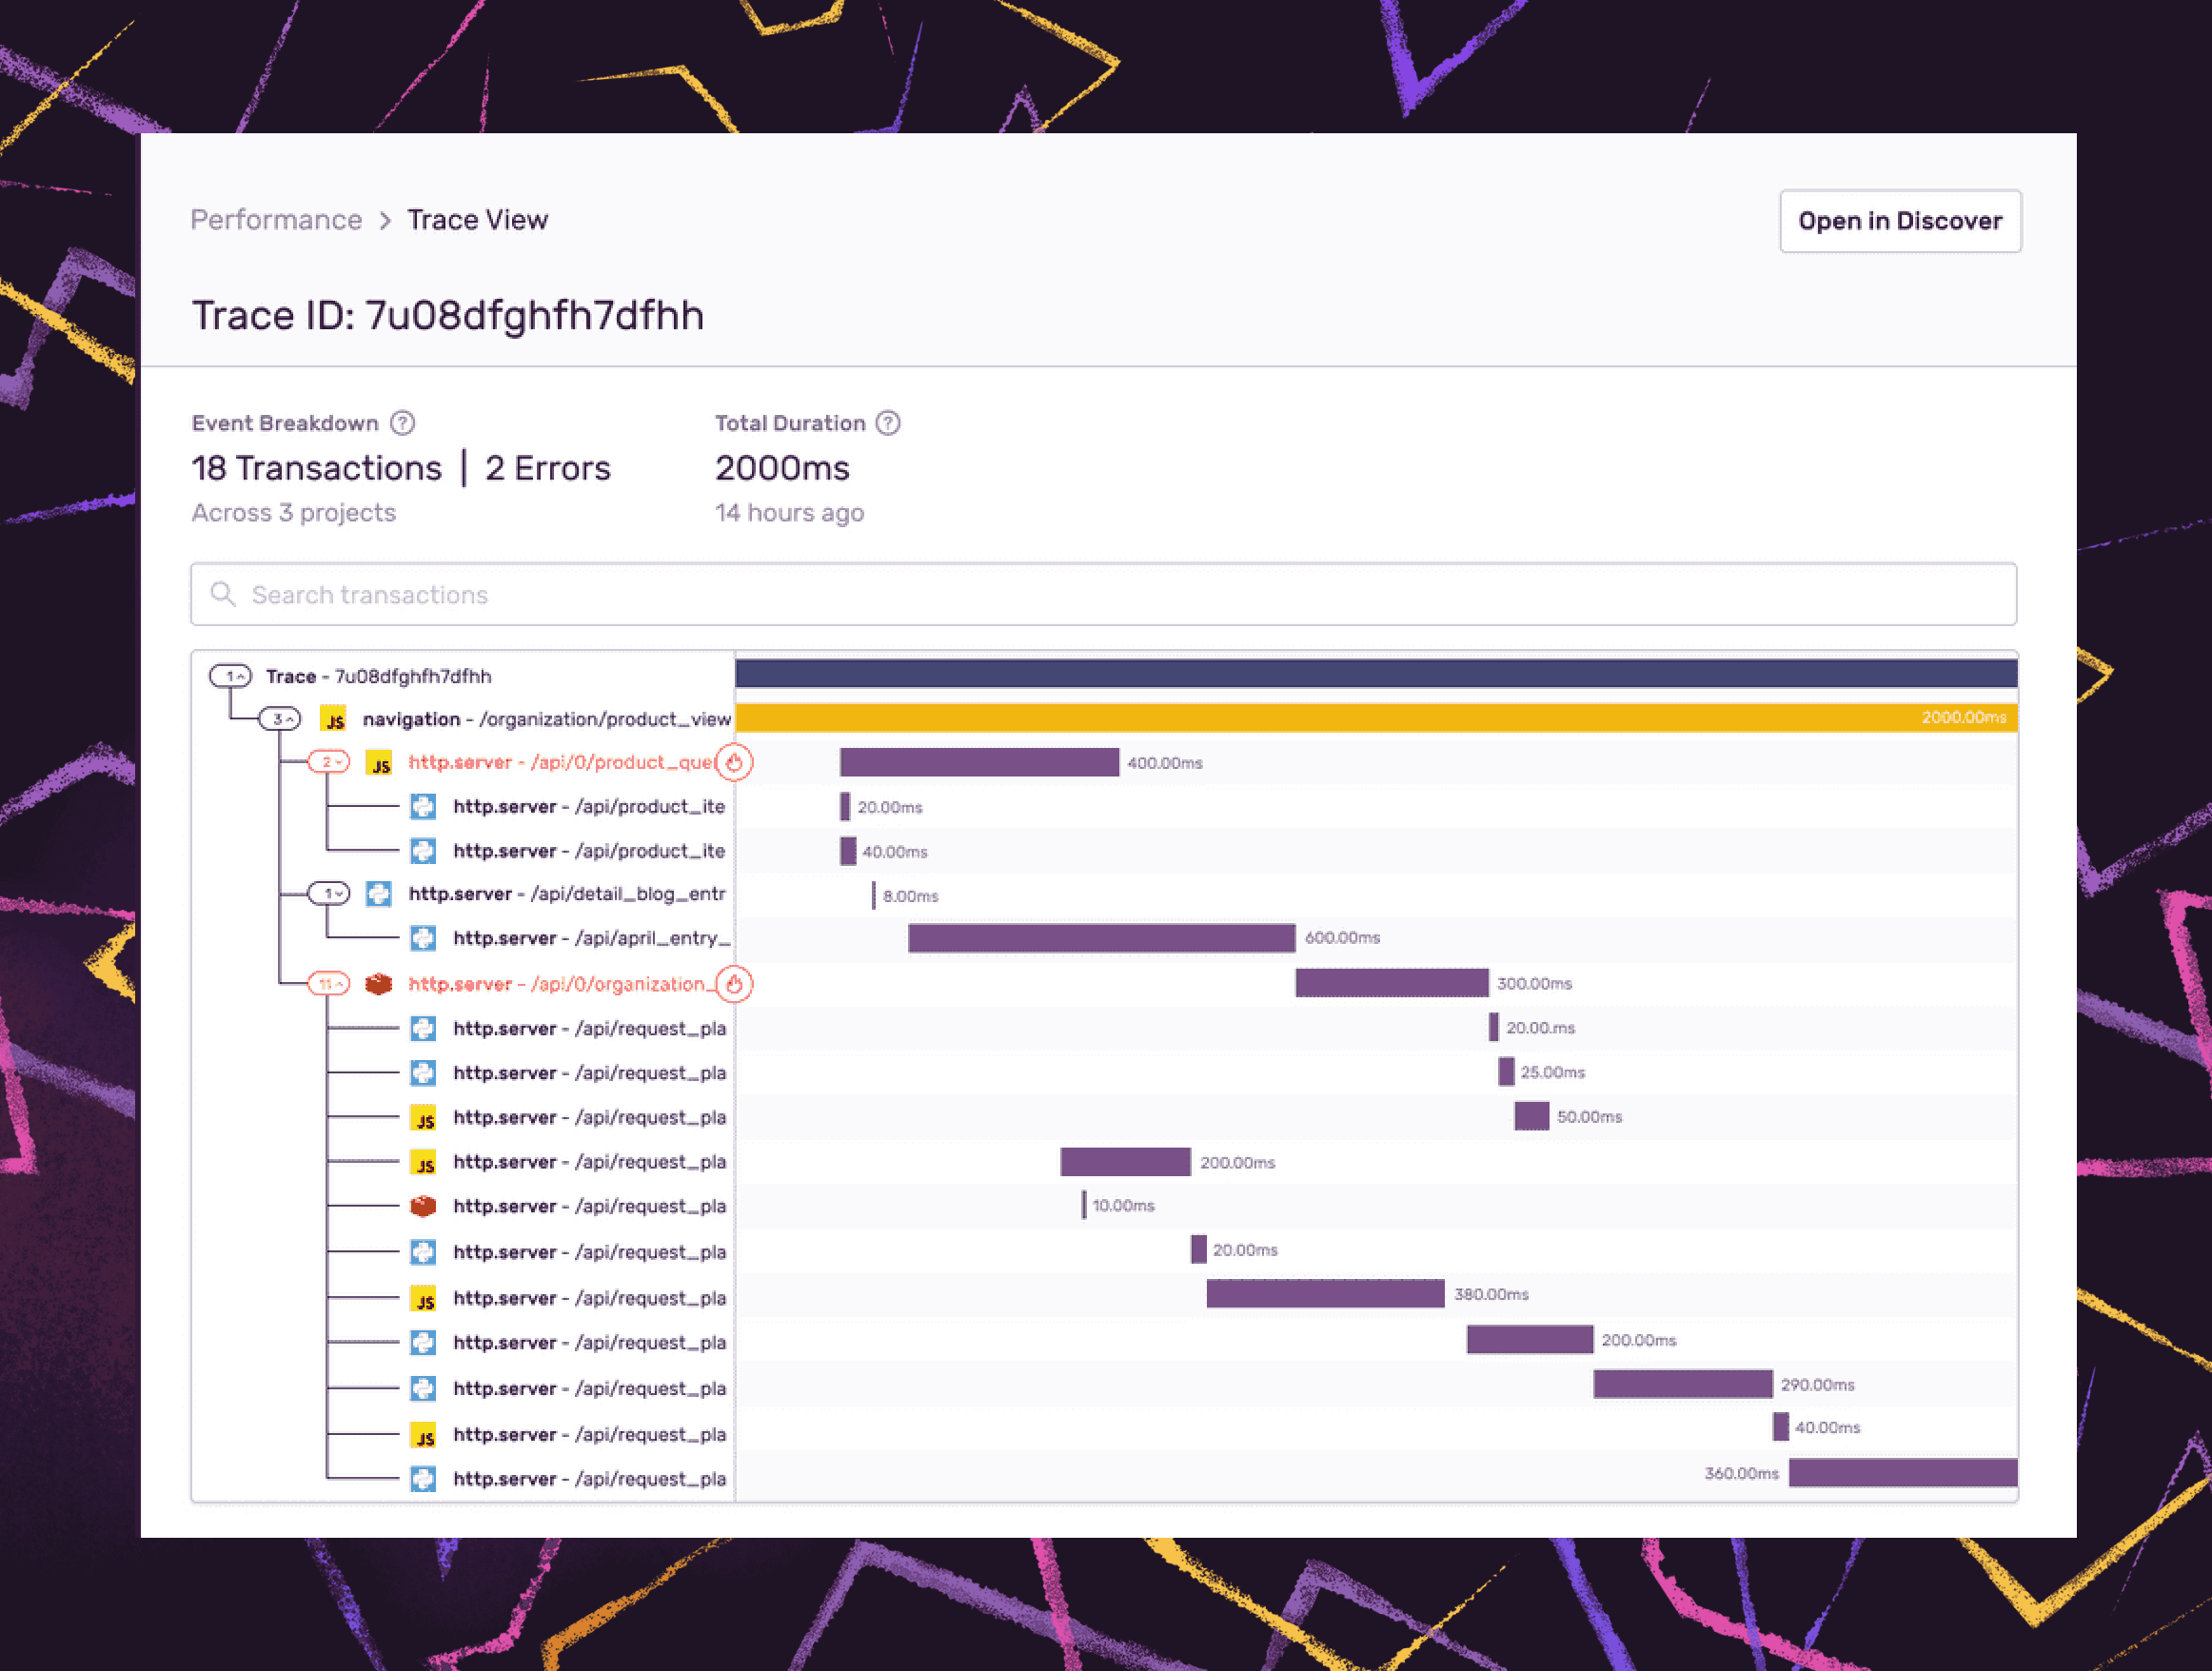
Leveraging transactions in addition to errors forms a more complete picture of the interconnectedness of your services as they grow. Trace view and trace navigator are tools to help accelerate triage at scale.
Trace view provides a broad visualization of the transactions comprising a single trace. This view can be helpful when debugging errors related to slow services or transactions. Trace navigator provides an abbreviated view of the entire trace giving you a relative context to reference as you follow the path of a request across services and into errors that occurred during the journey.
4. Collaborate across teams with project filters and activity tab
With a growing and more distributed codebase, issues can often cut across project concerns and time zones.
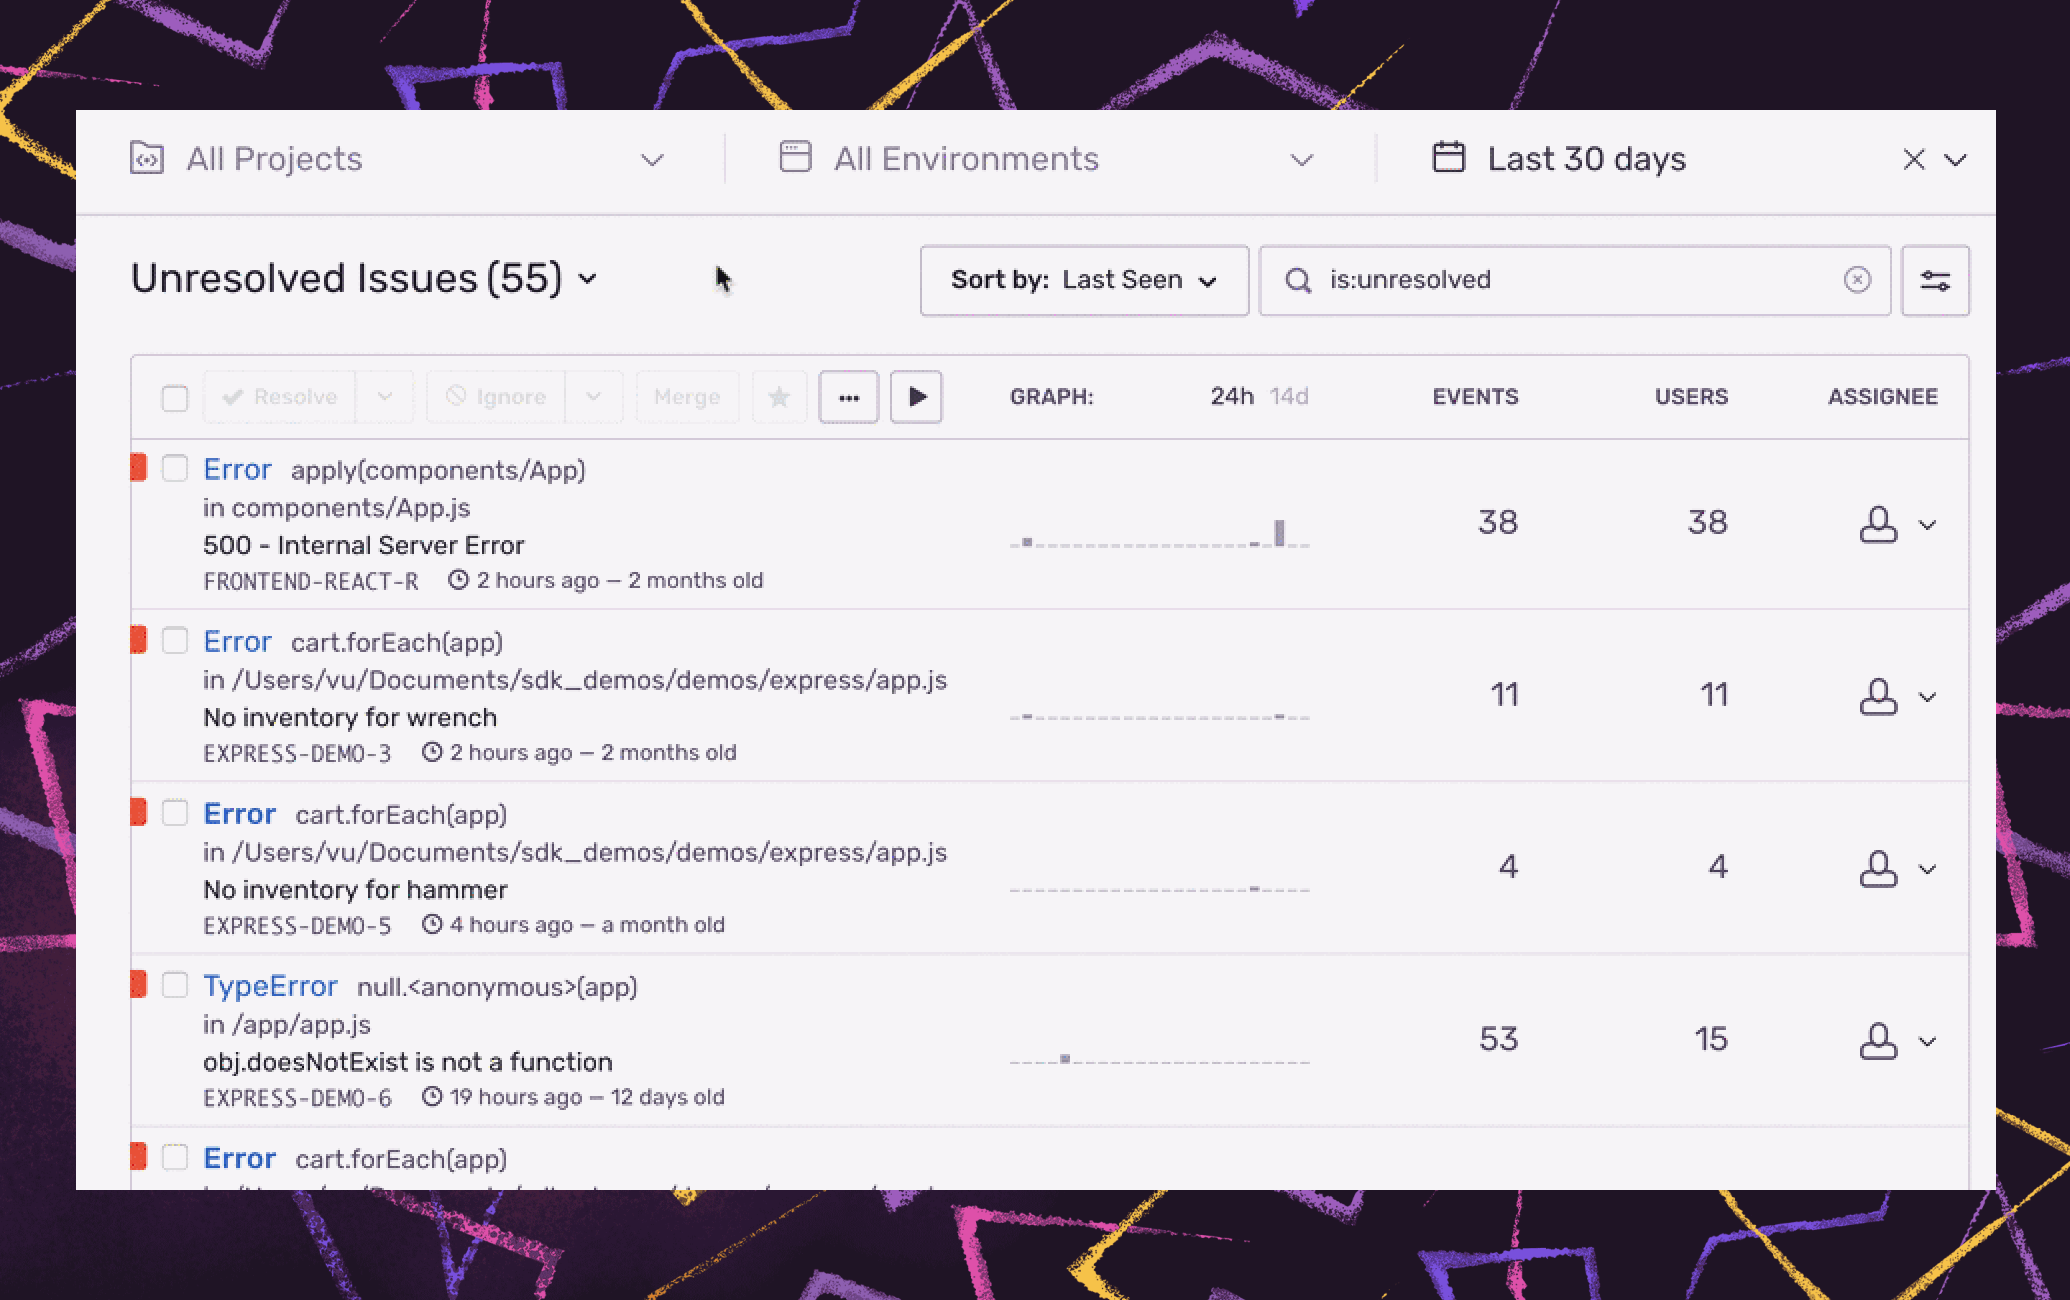
A universal issue view with cross-project issues
Cross-project issues
within the Issue Stream offer stakeholders the ability to aggregate errors or performance issues across multiple Sentry projects into a single view.
With cross-project issues, you get a unified view of all your projects and environments so you can see what's impacting your service across any client. You can also drill down into specific projects or environments and sort issues by things like impact, frequency, or priority, so you can quickly see your top issues and triage accordingly.
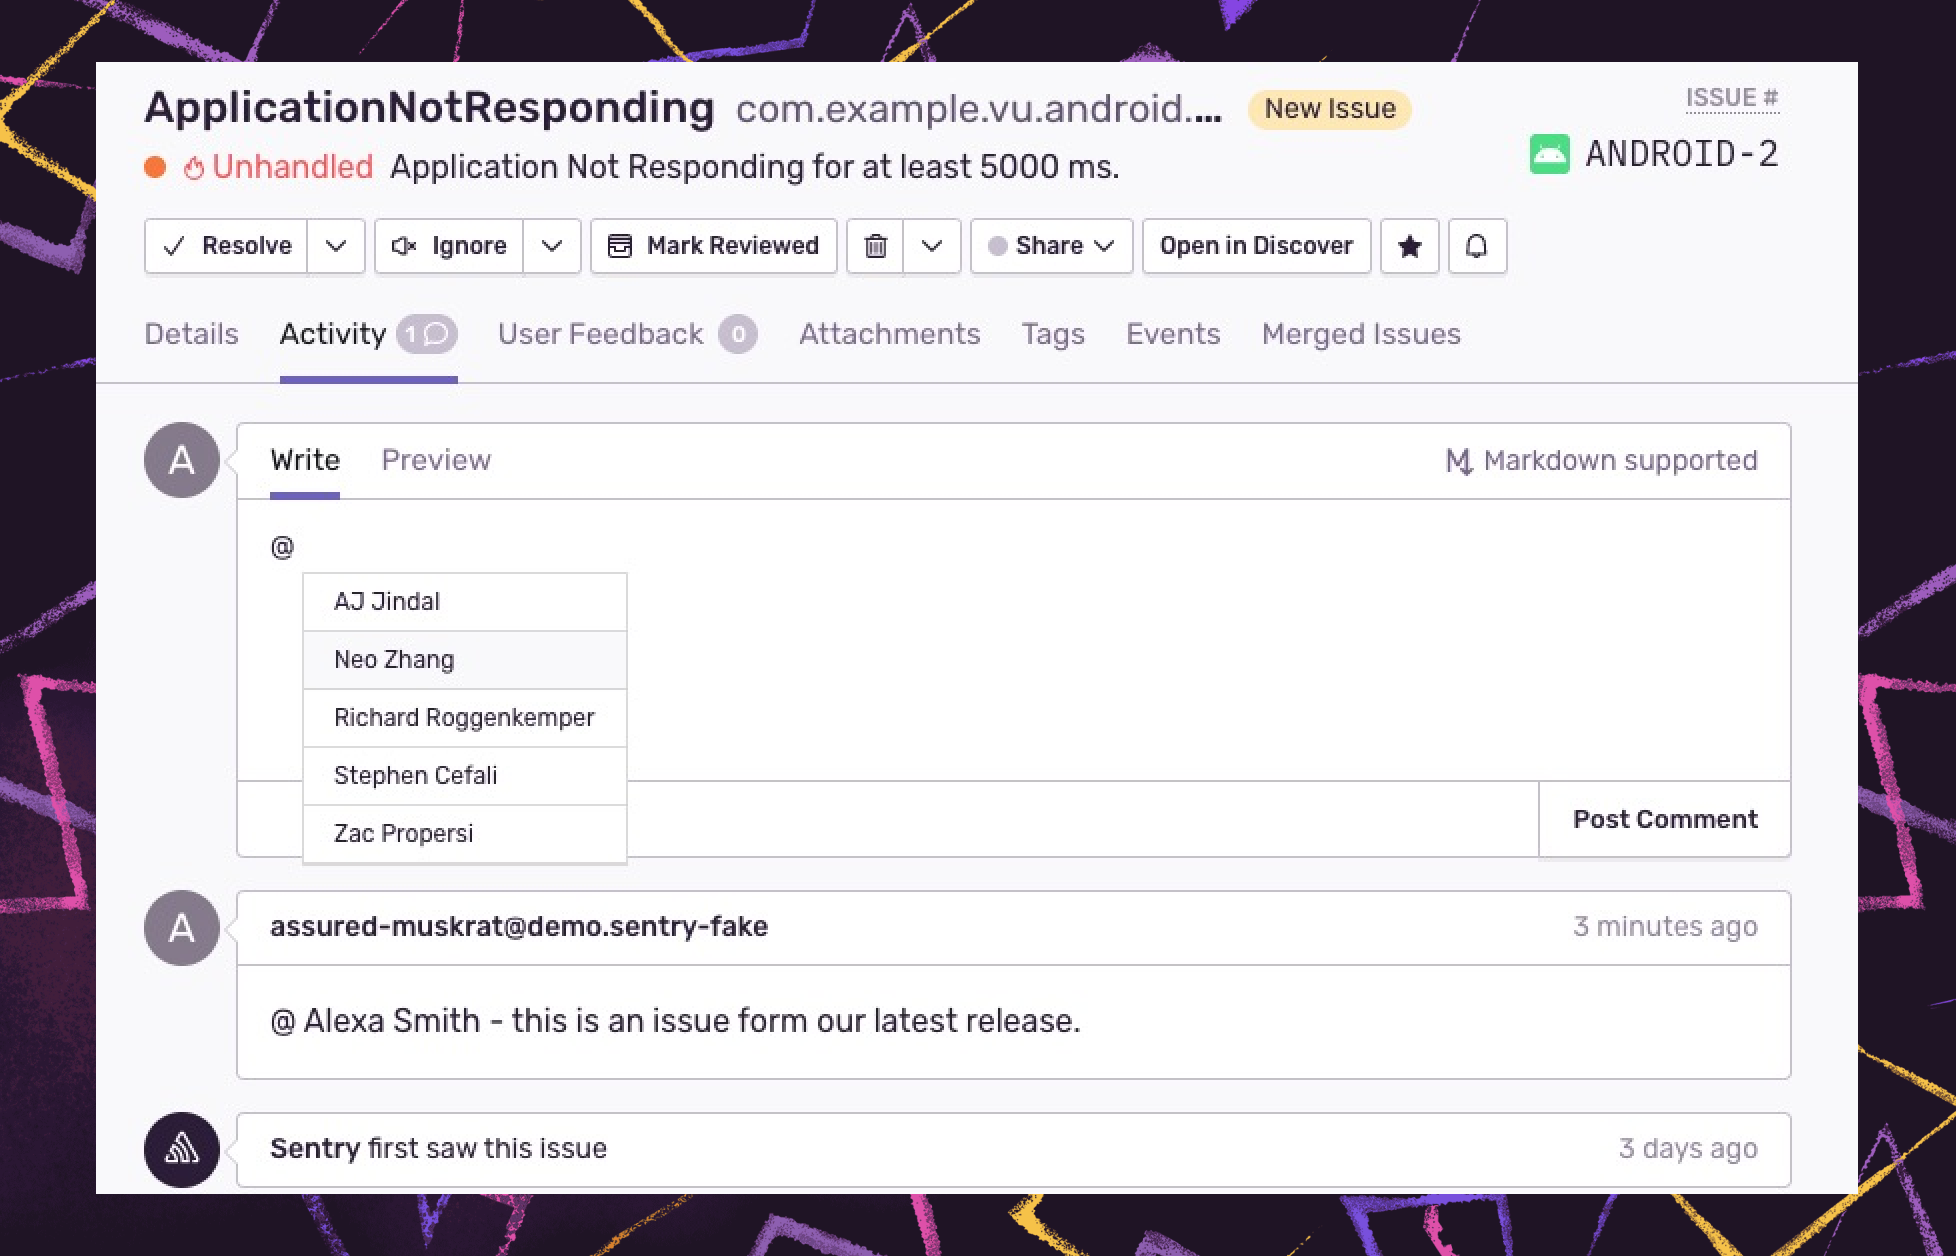
Streamline issue chatter with activity tab
Last, consolidate communication either within Sentry using the activity tab where team members can see and comment on their event activity history directly, or sync context from Sentry into the project management tools your teams use already.
5. Learn from issues to improve your workflow with Discover and Releases
To understand and share how your application health and stability change over time as event and release volume increase, use Discover Queries, Dashboards, and Release Health. Here are a few ways you can incorporate meaningful data into your workflow:
Answer critical business issues with Discover
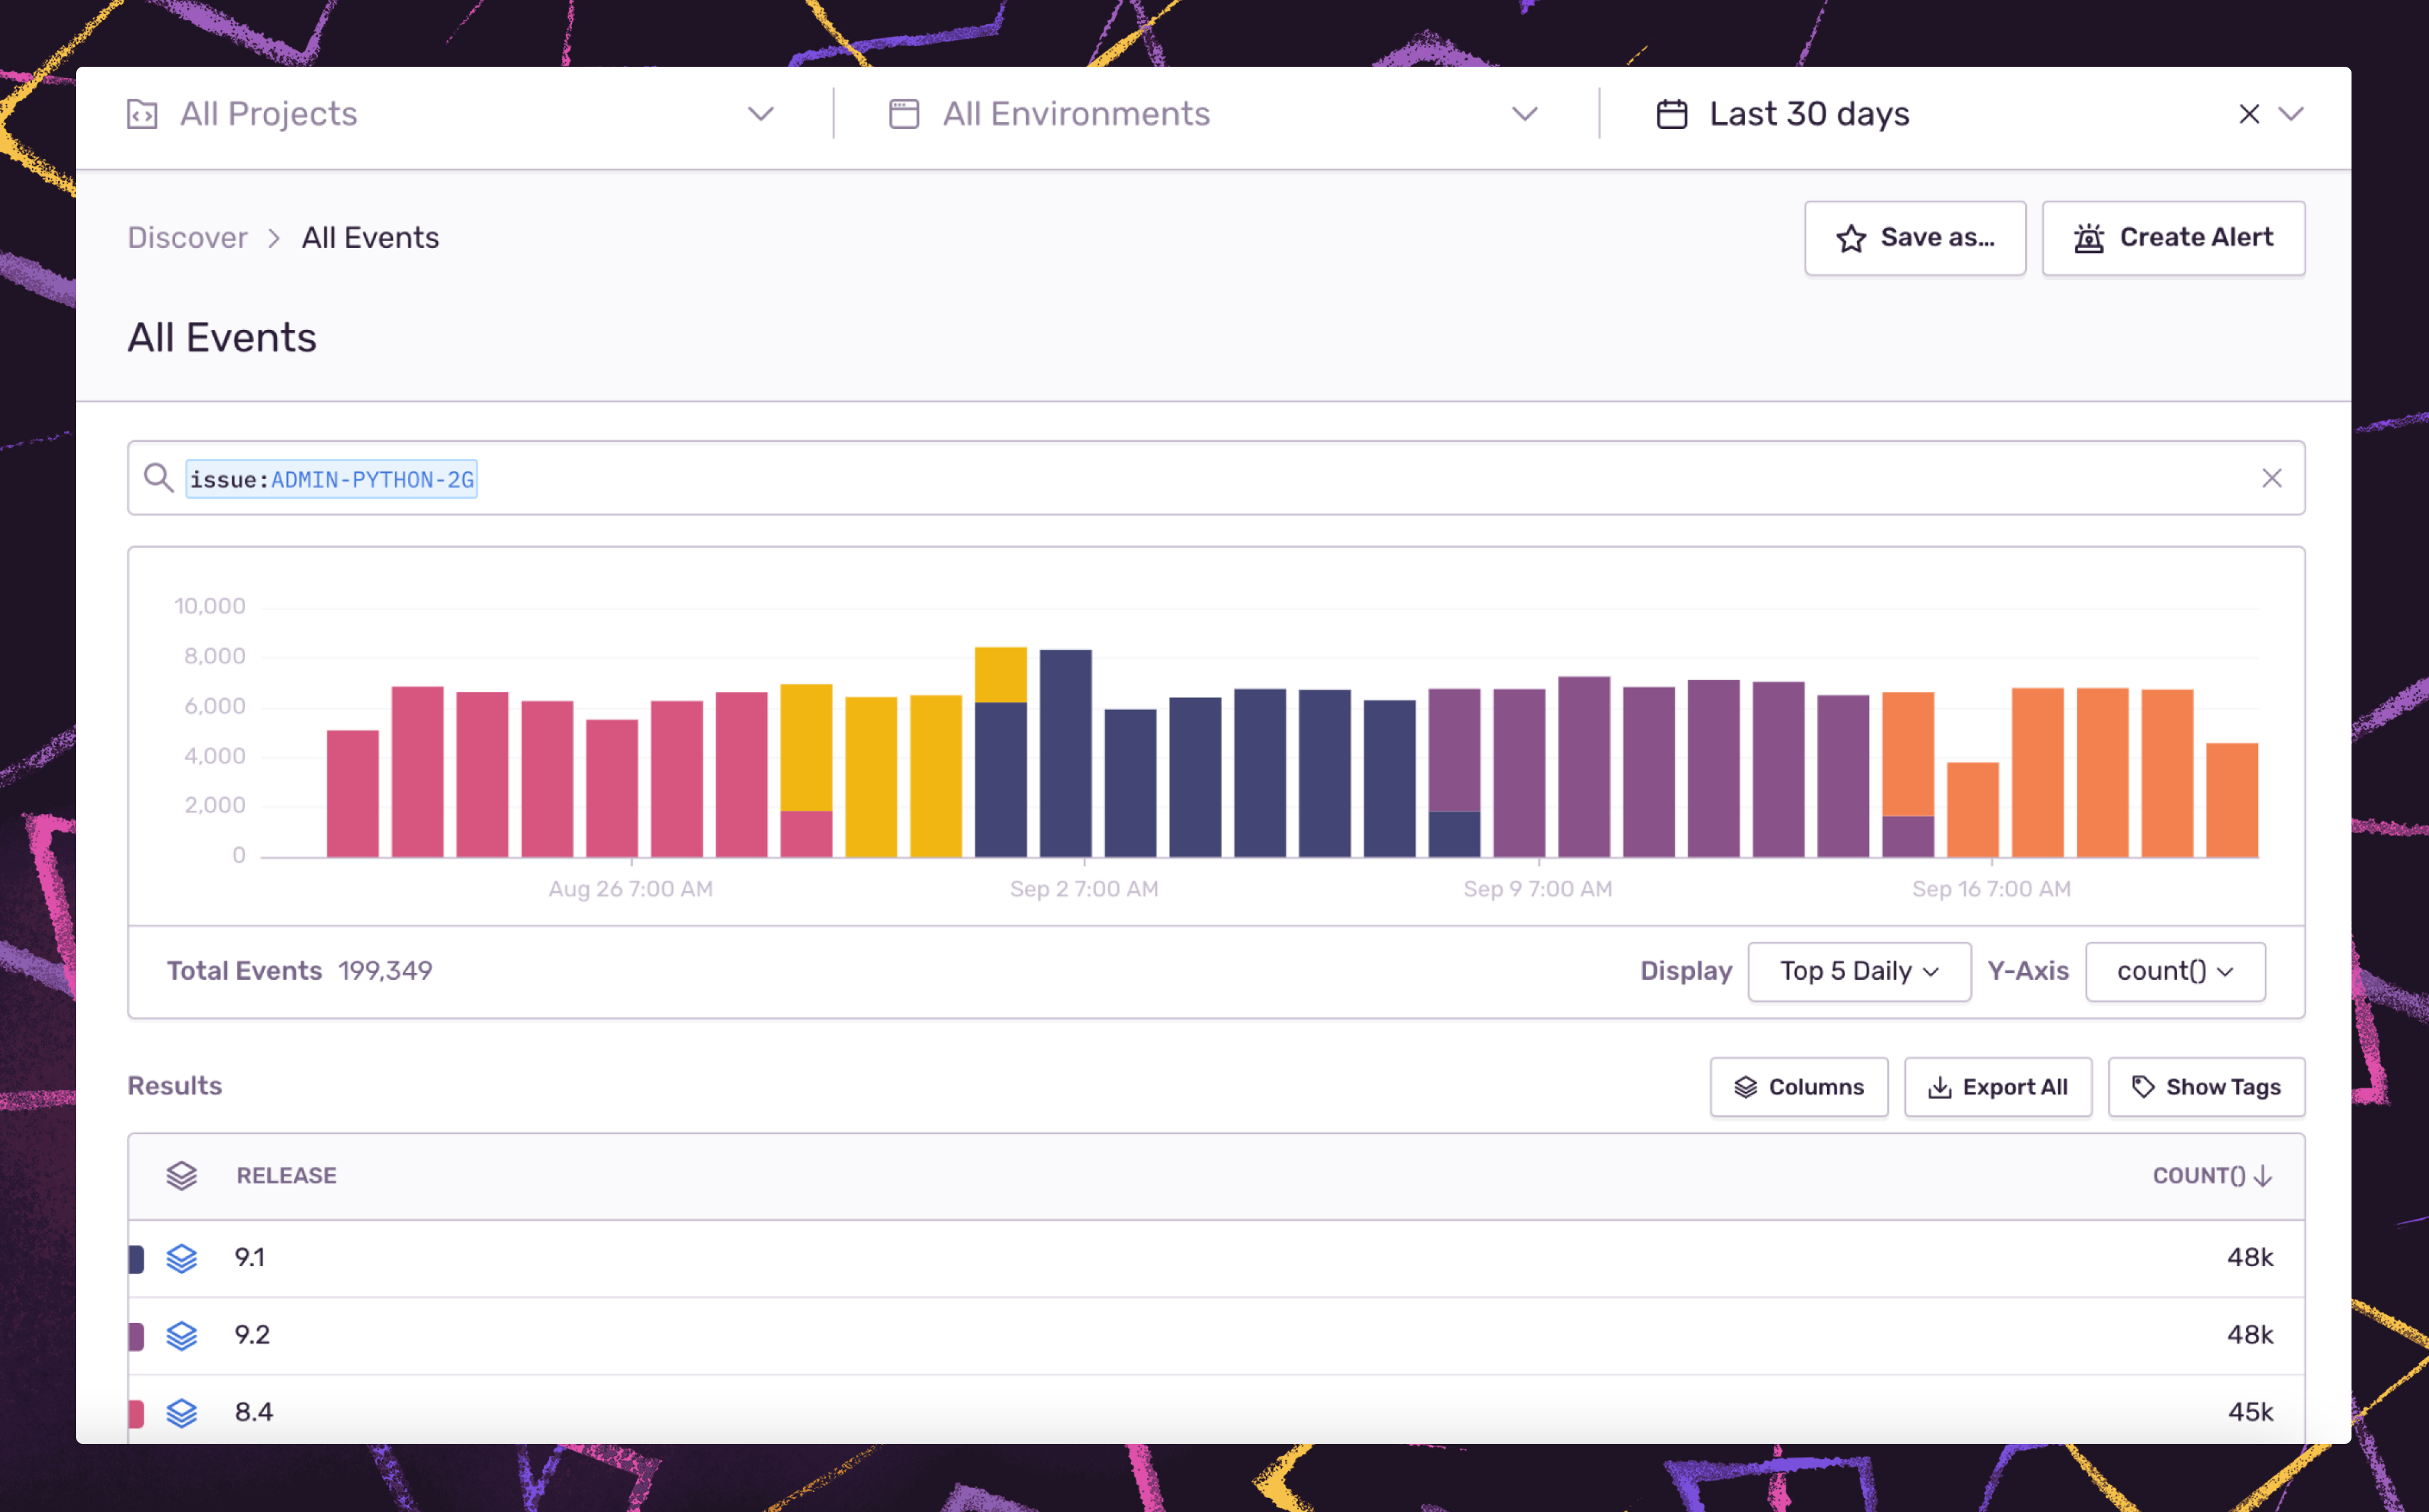
Sentry offers a few ways to drill into your raw error, performance, and release data to answer questions like ‘Which issues are persisting across releases?’ or ‘What are my noisiest projects and why?’
You can either write queries in Discover, using the same syntax used for Sentry search, or use pre-built queries to give you a starting point from where you can drill down to answer questions like 'What custom filters should I implement?' or 'How can I improve my triage strategy?' Of course, the pre-built queries only scratch the surface. To help you build custom queries, check out the available fields and equations.
Share important team or organizational-level metrics using Dashboards
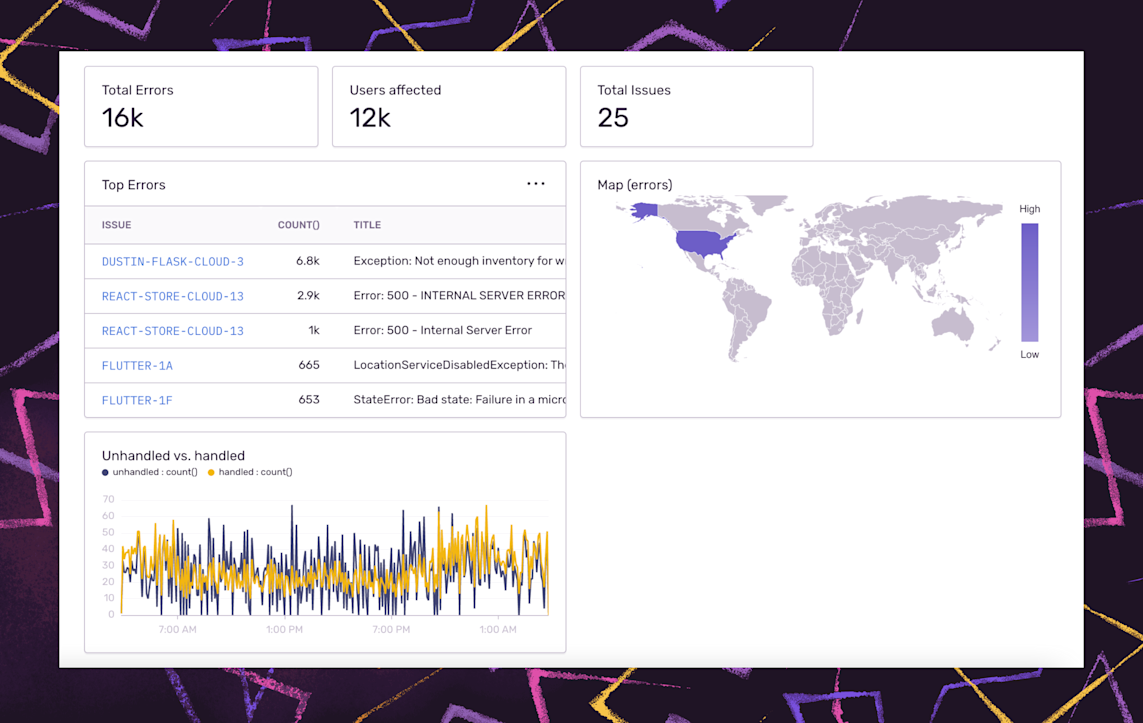
Dashboards are a visual way to capture and share what matters most across services, geographies, and stakeholders. Like Discover, there are default dashboards available out-of-the-box, or if you want something more customized to your business, you can either edit the default dashboards or build your own from scratch. A dashboard is shareable across the organization and can enhance weekly readouts, standups, or discussions around SLAs.
Get visibility into the stability of your application with Release Health
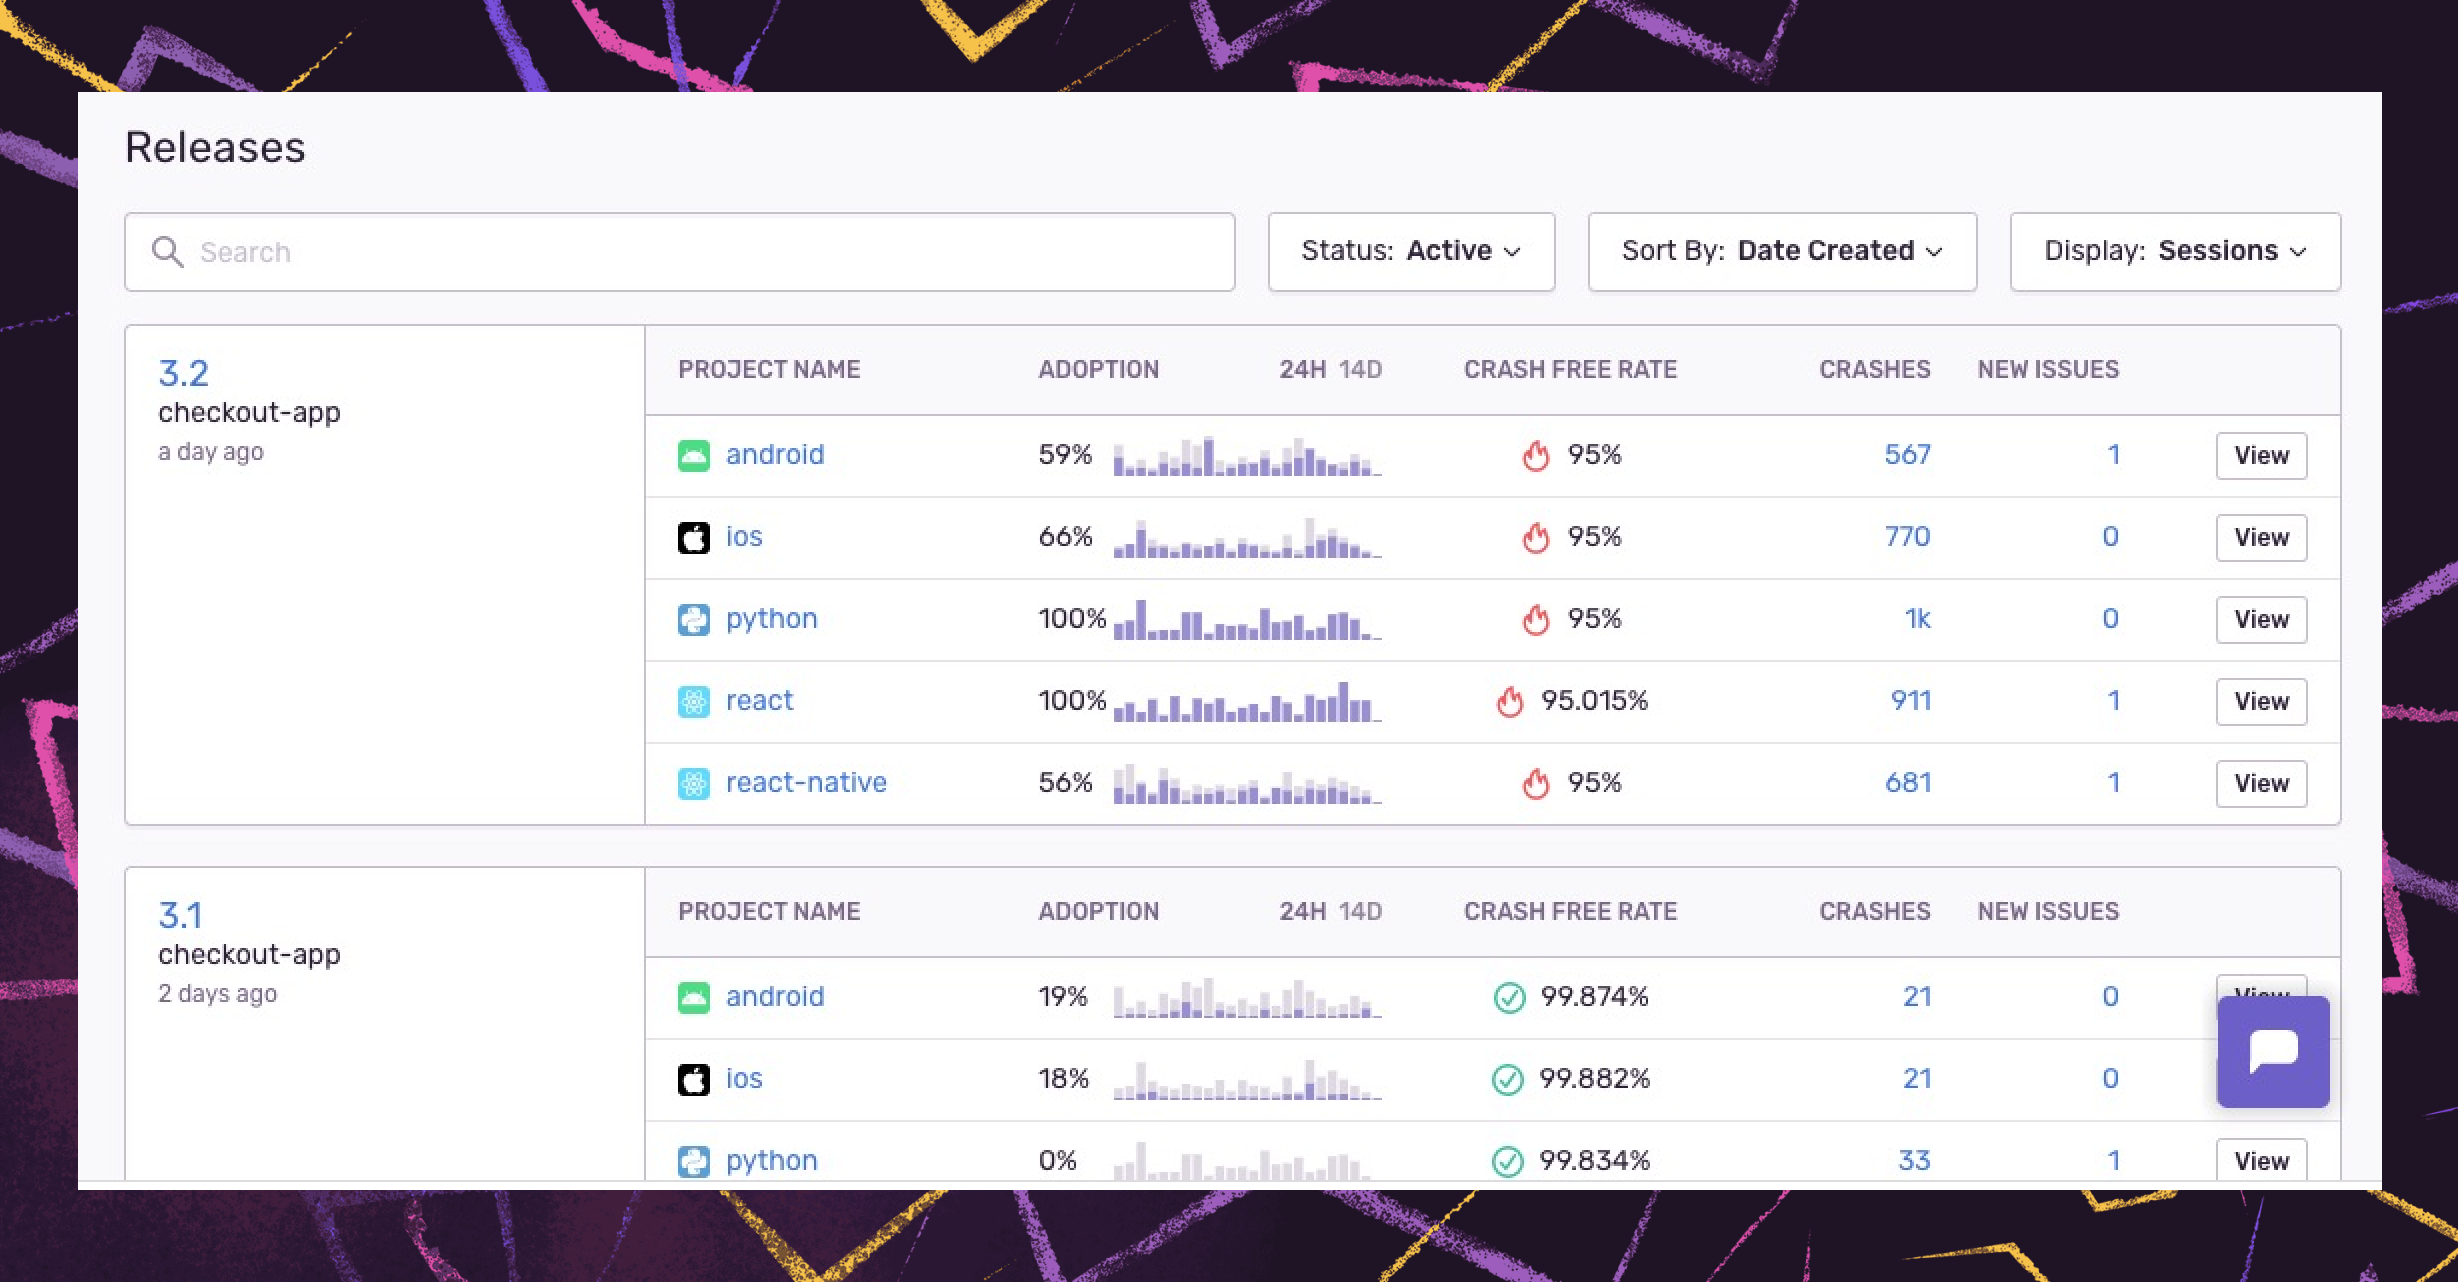
Sentry has added new options for better navigation of release data across your workflows. With Release Health, you see core metrics like crash-free sessions, version adoption, and failure rate so you can quickly detect bad releases, investigate slowdowns, and prioritize the issues to solve across versions.
Plus, with a real-time view across all releases and semantic versioning support, you can compare active or past versions to understand release trends and learn how your team maintains release quality and version adoption as your platform grows.
Getting started with code observability
Whether a Developer, Team Lead, or Product Owner, Sentry is continually working to help optimize your team's workflow so you can reduce time spent on troubleshooting issues and focus on more important things like building products that customers want.
If you’re a current Sentry user, log in to your account to start implementing these tips today.
New to Sentry and want to learn more? Request a demo or set up your free account to get started.


