Boosting Session Replay performance on iOS with View Renderer V2
Boosting Session Replay performance on iOS with View Renderer V2


After making Session Replay GA for Mobile, the adoption rose quickly and more feedback reached us. In less great news, our Apple SDK users reported that the performance overhead of Session Replay on older iOS devices made their apps unusable.
So we went on the journey to find the culprit and found a solution that yielded 4-5x better performance in our benchmarks.
To understand what's happening under the hood of Session Replay on Mobile, let's first explore how mobile screen recording works before diving into the technical details.
Frame rates in a nutshell
A screen recording is a video made up of many fast-displayed images called frames. Human eyes can process about 60 frames per second (frame rate), measured in hertz (1 Hz = 1 unit per second), creating the illusion of a moving image. The frame rates vary by use case, from 24 Hz for cinema to 144 Hz for gaming computer displays.
Higher frame rates create smoother video recordings, but come with significant trade-offs:
Increased storage and network bandwidth consumption for the same video length
More frames to process per second, requiring more powerful hardware to maintain performance
When reducing the frame rate to a minimum, the recordings look like stop motion videos, with a great example of this style visible in this YouTube video. The frames are just sequential photos, yet they still feel like a moving photo — essentially a video.
This is essentially what we are doing with Session Replay on Mobile.
Instead of having a full screen recording, which is resource-heavy, we capture a screenshot every second instead. Every 5 seconds, these frames are combined into a video segment at 1 Hz, creating a stop-motion-like recording. These video segments are then uploaded to Sentry and stitched into a full session replay. And as a developer, you get insight into the actions taken by the user and how the app reacted, with low overhead. Great trade off for a debugging tool.
Now that we know how frame rates work, let’s dive deeper into the actual problem we had to tackle.
The frame is the problem
Our investigation began with reproducing the performance issues in a controlled environment. We used an iPhone 8 running iOS 15.7 as our primary test device, since this represented the older hardware where users reported the most severe performance problems.
Using Xcode Instruments on our Sentry Apple SDK sample application, we immediately reproduced the reported performance issues and noticed a consistent pattern of main thread hangs every second.
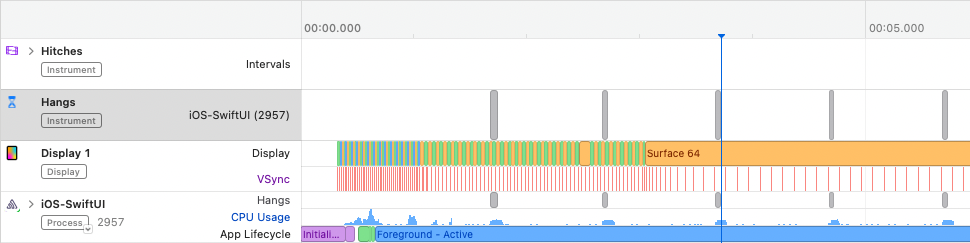
Xcode Instruments showing an app hang warning every second.
Each iOS application uses exactly one thread for handling the entire UI view hierarchy - the main thread. When view changes occur, the hierarchy is processed by the system's render service, which converts the logical view structure into pixel data for display on the screen.
Eventually Apple introduced ProMotion displays which adjust their refresh rates up to 120Hz during interaction and down to 10Hz when idle — the frame rate is not constant anymore.
To better understand the exact implications for time-to-render per frame in milliseconds (ms), consider that to hit a refresh rate of 120 Hz the time per frame is narrow with 1000 ms / 120 = ~8.3 ms available to update and render the view hierarchy. In contrast for 60 Hz, we can double the available time to 1000 ms / 60 = ~16.7 ms.
You can find a full table of refresh rates and timings in the Apple Documentation.
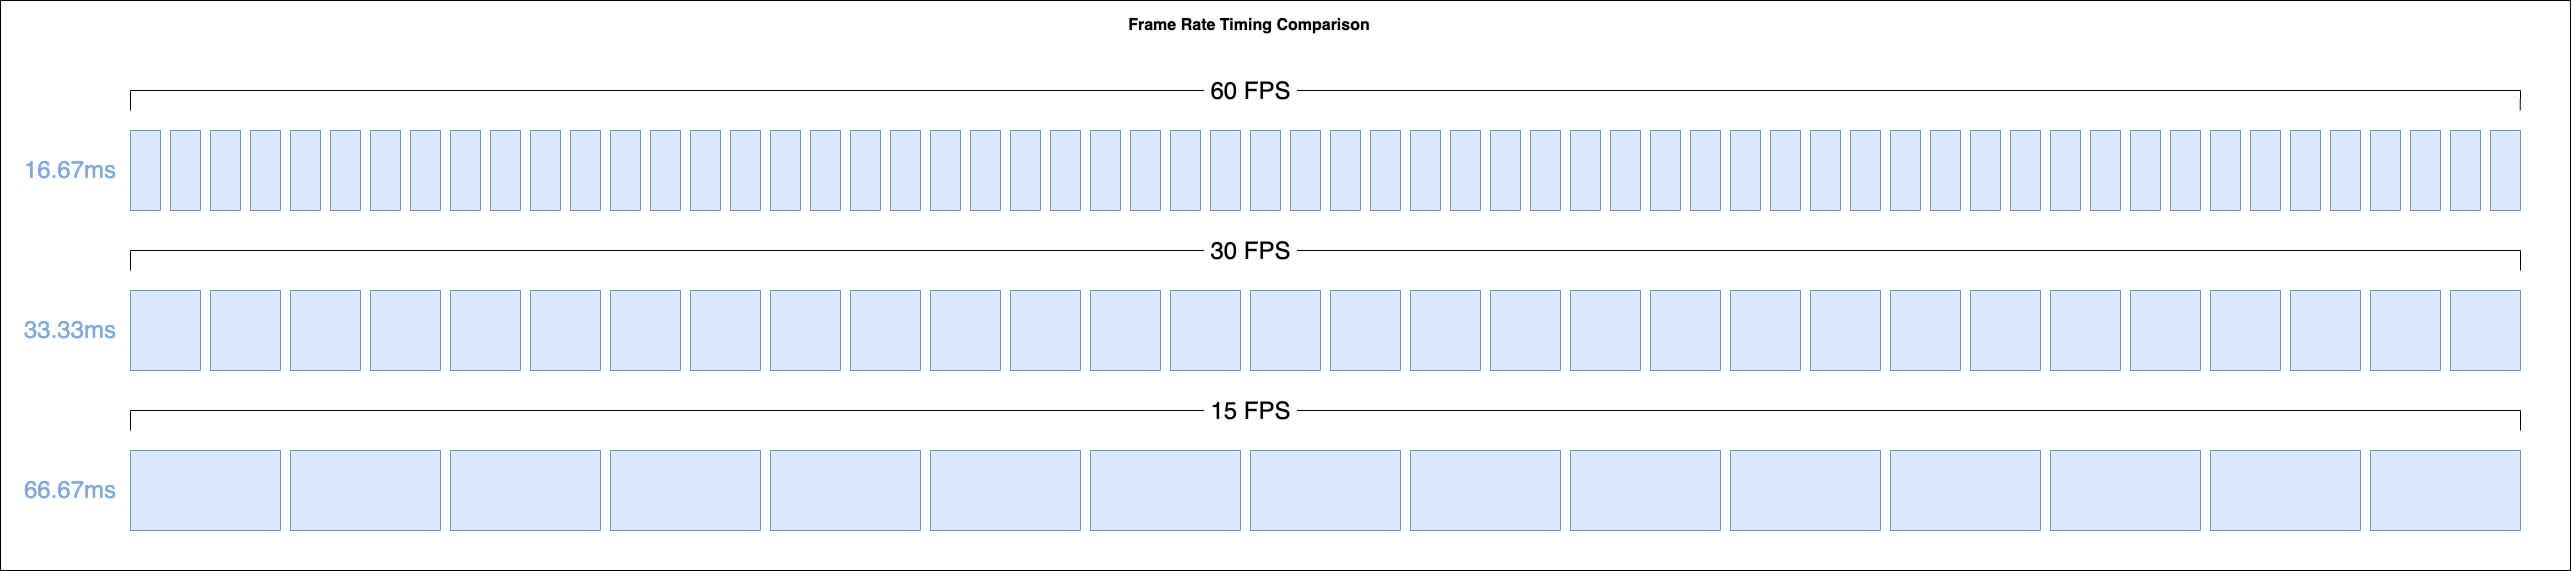
The blue boxes represent the amount of available time to calculate and render the view.
This defines our upper limit for execution time per frame, i.e. how much time we have on the main thread to perform any logic, calculations and rendering (the workload) before sending the graphics data to the screen.
If the workload is below that, e.g. 4 ms, all is good and we wait for the next update. But if the workload takes longer than that, e.g. 25ms, we have a problem — the main thread is blocked and the app hangs.
As animations are not coupled to frames but to time, the app cannot simply continue with rendering the next one afterwards. For example, if you expect a loading indicator to rotate exactly once per second, longer frame render times would slow down the animation.
To correct the timing the system skips the frames that should already have been rendered at this point in time (the dropped frames). This correction behavior is commonly known as frame drops and has the undesired side effect of intermittent frame rate changes that can be noticed as visual stutters (i.e. not scrolling smoothly).
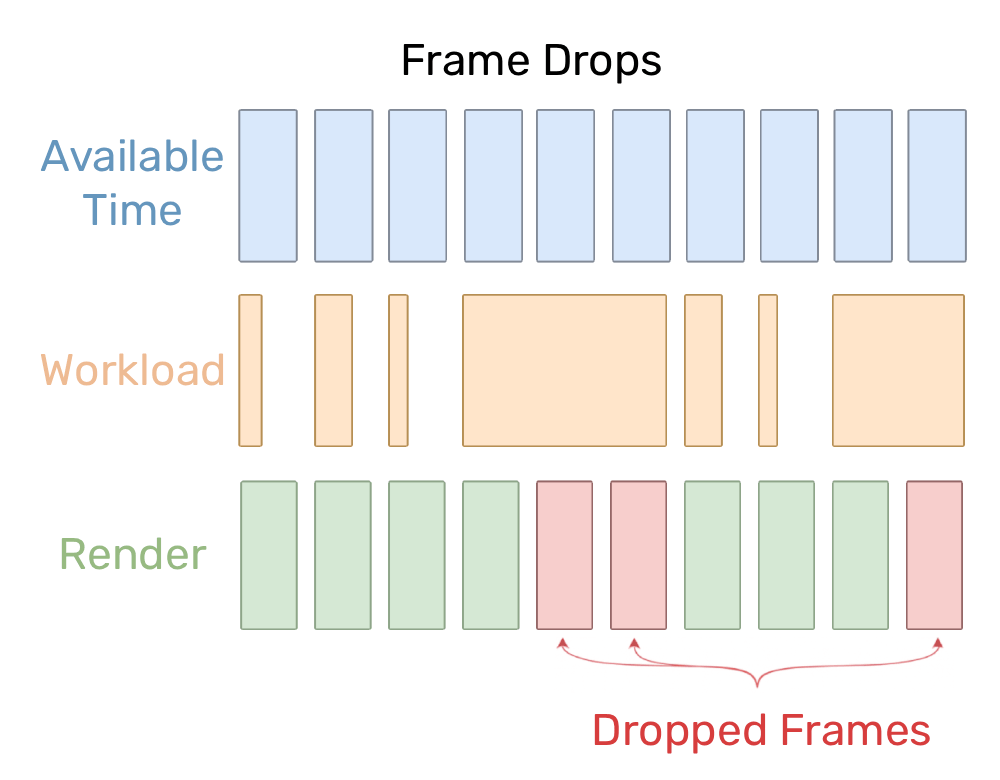
When workload takes longer than the available time, we need to drop frames
Frame drops were also the unintended side effect of the previous implementation for Session Replay, as the once-per-second screenshot simply took too long.
Taking screenshots with PII in mind
Now that we know what the issue is, we need to take a closer look at the work done by Session Replay. The capture process consists of three steps that must be executed for each screenshot:
Redact: Traverse the view hierarchy to identify UI elements that contain sensitive information and require masking.
Render: Convert the current view hierarchy into a rasterized bitmap representation ("take a screenshot") using a view renderer.
Mask: Apply privacy masking by combining the rendered image with the redaction geometry.
As mentioned before, accessing the view hierarchy must be done on the main thread, which means that both steps Redact and Render must also execute on the main thread. Only the final step Mask can be performed on a background queue, since it operates solely on the image data produced by the previous steps.
This allows us to focus on the performance of the Redact and Render steps.
Measuring baseline performance
After adding some code to calculate the execution time and adding a basic sampling mechanism to reduce variation over time, we quickly gathered our first insights using a (rather old) iPhone 8:
The step Render takes ~155ms per frame, causing ~9-10 of 60 frames being dropped every second of using Session Replay.
120 samples | Redact | Render | Total |
|---|---|---|---|
Min | 3.0583 ms | 145.3815 ms | 148.4398 ms |
Avg | 5.8453 ms | 149.8243 ms | 155.6696 ms |
p50 | 6.0484 ms | 149.2103 ms | 155.2587 ms |
p75 | 6.1136 ms | 151.9487 ms | 158.0623 ms |
p95 | 6.2567 ms | 155.3496 ms | 161.6063 ms |
Max | 6.5138 ms | 155.8338 ms | 162.3476 ms |
As the duration of Redact with ~6.3ms is comparatively small, we will optimize it in the future and focus on improving Render.
Optimizing the view renderer
Our investigation revealed that the rendering phase consumed approximately 155 milliseconds per screenshot, representing the primary performance bottleneck. The original implementation relied on Apple's high-level UIGraphicsImageRenderer API, which provides convenient abstractions but introduces significant overhead for our use case.
Here's the baseline implementation that was causing the performance issues:
func render(view: UIView) -> UIImage {
    // Setup: Create graphics context and configure rendering environment
    let screenshot = UIGraphicsImageRenderer(size: view.bounds.size).image { context in
        // Draw: Render view hierarchy into the graphics context
        view.drawHierarchy(in: view.bounds, afterScreenUpdates: false)
    }
    return screenshot
}
This implementation consists of two primary function blocks that each present optimization opportunities.
Setup: Creates a graphical bitmap context that serves as the "canvas" for rendering operations, then converts the resulting bitmap data into a
UIImageafter drawing completes.Draw: Draws the view hierarchy into the context created during setup.
An additional complexity we have to consider is the coordinate system mismatch between logical points and physical pixels. iOS uses a points-based coordinate system for layout, while the actual display operates in pixels. For example, an iPhone 8 screen measures 375 × 667 points logically, but the physical display resolution is 750 × 1334 pixels due to the 2x scale factor.
The key takeaway is that we should avoid scaling any graphics data unnecessarily, as scaling is a computationally intensive operation, and instead use the appropriate scale. Interestingly, during the baseline analysis, scaling the image did not have a significant impact, although it did in other performance tests.
Idea 1: Reusing the UIGraphicsImageRenderer
UIGraphicsImageRendererThe original implementation uses a helper class provided by Apple’s framework UIKit, the UIGraphicsImageRenderer, which takes care of setting up the low-level bitmap context and the conversion into an image.
Our default view renderer creates a new instance every single time the render method is called. The Apple documentation mentions that it uses a built-in cache and therefore recommends to reuse instances:
After initializing an image renderer, you can use it to draw multiple images with the same configuration. An image renderer keeps a cache of Core Graphics contexts, so reusing the same renderer can be more efficient than creating new renderers.
Looking at the output of the benchmark test, there is no significant change between the UIGraphicsImageRenderer Cache (UIGIR Cache) compared to the baseline (Base). This recommendation does not help and so we discarded it.
120 samples | Base | UIGIR Cache | ± Time | ± % |
|---|---|---|---|---|
Min | 145.3815 ms | 146.9310 ms | 1.5495 ms | +1.07 % |
Avg | 149.8243 ms | 149.5189 ms | -0.3054 ms | -0.20 % |
p50 | 149.2103 ms | 148.0545 ms | -1.1558 ms | -0.77 % |
p75 | 151.9487 ms | 151.6945 ms | -0.2542 ms | -0.17 % |
p95 | 155.3496 ms | 155.3220 ms | -0.0276 ms | -0.02 % |
Max | 155.8338 ms | 156.0019 ms | 0.1681 ms | + 0.11 % |
Idea 2: Custom view renderer
As mentioned before, the UIGraphicsImageRenderer is a class of UIKit which is built on top of CoreAnimation and CoreGraphics, also known as the QuartzCore. Most of these are closed source but to better understand its internal implementation, we can take a look at the history of rendering to a graphical context on iOS.
Before the class was introduced with iOS 10, many developers used the predecessors UIGraphicsBeginImageContextWithOptions to create the bitmap context and UIGraphicsGetImageFromCurrentImageContext to convert it into an image.
These methods are also backed by CoreGraphics, so we can go deeper and directly work with the CoreGraphics' CGContext, allowing us to skip most of the high-level "helper" methods and internal caching logic.
This is now exactly what we are doing with the new SentryGraphicsImageRenderer (SGIR).
Our solution bypasses the high-level UIKit abstractions and works directly with CoreGraphics contexts. This approach offers fine-grained control over memory allocation patterns and eliminates the overhead introduced by UIKit's internal caching and context management logic.
let scale = (view as? UIWindow ?? view.window)?.screen.scale ?? 1
let image = SentryGraphicsImageRenderer(size: view.bounds.size, scale: scale).image { context in
    view.drawHierarchy(in: view.bounds, afterScreenUpdates: false)
}
To give you an rough explanation on how it works, checkout this code snippet:
let colorSpace = CGColorSpaceCreateDeviceRGB()  // Create an RGB color space for the image
let bytesPerPixel = 4                           // 4 bytes for RGBA
let bitsPerComponent = 8                        // 8 bits for each of RGB component

let pixelsPerRow = Int(size.width * scale)
let pixelsPerColumn = Int(size.height * scale)
let bytesPerRow = bytesPerPixel * pixelsPerRow

// Allocate memory for raw image data
let rawData = calloc(pixelsPerColumn * bytesPerRow, MemoryLayout<UInt8>.size)

// Create a CoreGraphics context with the allocated memory
let context = CGContext(data: rawData, width: pixelsPerRow, height: pixelsPerColumn, bitsPerComponent: bitsPerComponent, bytesPerRow: bytesPerRow, space: colorSpace, bitmapInfo: CGImageAlphaInfo.premultipliedLast.rawValue)

// Fix mismatch between UIKit and CoreGraphics coordinate systems
context.translateBy(x: 0, y: size.height * scale)
context.scaleBy(x: scale, y: -1 * scale)

// Pushing context will make the context the current main context
UIGraphicsPushContext(context)

// Draw the view into the current main context
view.drawHierarchy(in: view.bounds, afterScreenUpdates: false)

// Pop the context to make the original context the current main context
UIGraphicsPopContext()

// Convert the bitmap context into a CGImage
let image = context.makeImage()
You can find the full implementation of SentryGraphicsImageRenderer on GitHub.
120 samples | Base | SGIR @ 2x scale | ± Time to Base | ± % to Base |
|---|---|---|---|---|
Min | 145.38 ms | 14.76 ms | -130.62 ms | -89.95 % |
Avg | 149.82 ms | 25.42 ms | -124.41 ms | -83.04 % |
p50 | 149.21 ms | 24.56 ms | -124.65 ms | -83.54 % |
p75 | 151.95 ms | 27.34 ms | -124.61 ms | -82.01 % |
p95 | 155.35 ms | 30.32 ms | -125.03 ms | -80.48 % |
Max | 155.83 ms | 32.58 ms | -123.26 ms | -79.09 % |
We have our first win and reduced the average time by ~125ms or ~80%.
As you might have noticed in the code snippet above, we had to explicitly declare the scale of the window. This was essential as we were able to notice a performance loss when using window scale of 1.0 instead of the screen-native scale of 2.0:
120 samples | SGIR @ 2x scale | SGIR @ 1x scale | ± Time to 2x scale | ± % to 2x scale |
|---|---|---|---|---|
Min | 14.76 ms | 27.05 ms | + 12.29 ms | + 83.28 % |
Avg | 25.42 ms | 38.80 ms | + 13.39 ms | + 52.67 % |
p50 | 24.56 ms | 38.47 ms | + 13.92 ms | + 56.67 % |
p75 | 27.34 ms | 40.37 ms | + 13.02 ms | + 47.63 % |
p95 | 30.32 ms | 44.42 ms | + 14.10 ms | + 46.50 % |
Max | 32.58 ms | 48.66 ms | + 16.08 ms | + 49.37 % |
Idea 3: Replacing view.drawHierarchy(in:afterScreenUpdates:)
view.drawHierarchy(in:afterScreenUpdates:)Now that we have optimized the block Setup, let’s improve Draw.
The instance method view.drawHierarchy(in:afterScreenUpdates:) allows us to easily render a snapshot of the complete view hierarchy into the current context.
The view hierarchy is a tree of UIView instances, each backed by a tree of CALayer instances, which then offers the method layer.render(in:) to directly render itself and its sublayers into the specified context.
let scale = (view as? UIWindow ?? view.window)?.screen.scale ?? 1
let image = SentryGraphicsImageRenderer(size: view.bounds.size, scale: scale).image { context in
    view.layer.render(in: context.cgContext)
}
Running our performance tests we can also notice faster render times compared to the baseline:
120 samples | Base | SGIR + | ± Time to Base | ± % to Base |
|---|---|---|---|---|
Min | 145.38 ms | 18.53 ms | -126.85 ms | -87.25 % |
Avg | 149.82 ms | 20.74 ms | -129.08 ms | -86.16 % |
p50 | 149.21 ms | 19.84 ms | -129.37 ms | -86.70 % |
p75 | 151.95 ms | 22.42 ms | -129.53 ms | -85.25 % |
p95 | 155.35 ms | 24.66 ms | -130.69 ms | -84.13 % |
Max | 155.83 ms | 24.92 ms | -130.92 ms | -84.01 % |
But even more interesting is comparing it to view.drawHierarchy:
120 samples | SGIR @ 2x + | SGIR @ 2x + | ± Time to | ± % to |
|---|---|---|---|---|
Min | 14.76 ms | 18.53 ms | +3.77 ms | +25.57 % |
Avg | 25.42 ms | 20.74 ms | -4.68 ms | -18.40 % |
p50 | 24.56 ms | 19.84 ms | -4.72 ms | -19.20 % |
p75 | 27.34 ms | 22.42 ms | -4.92 ms | -18.01 % |
p95 | 30.32 ms | 24.66 ms | -5.66 ms | -18.67 % |
Max | 32.58 ms | 24.92 ms | -7.66 ms | -23.52 % |
Looks like we can shave off another ~18-19% of the time on the main thread, sounds too good to be true, right?
That's because it actually is too good to be true.
During testing we noticed that the rendering using layer.render(in:) is incomplete, in particular the icons used in the tab bar did not show up in the rendered screenshot at all.
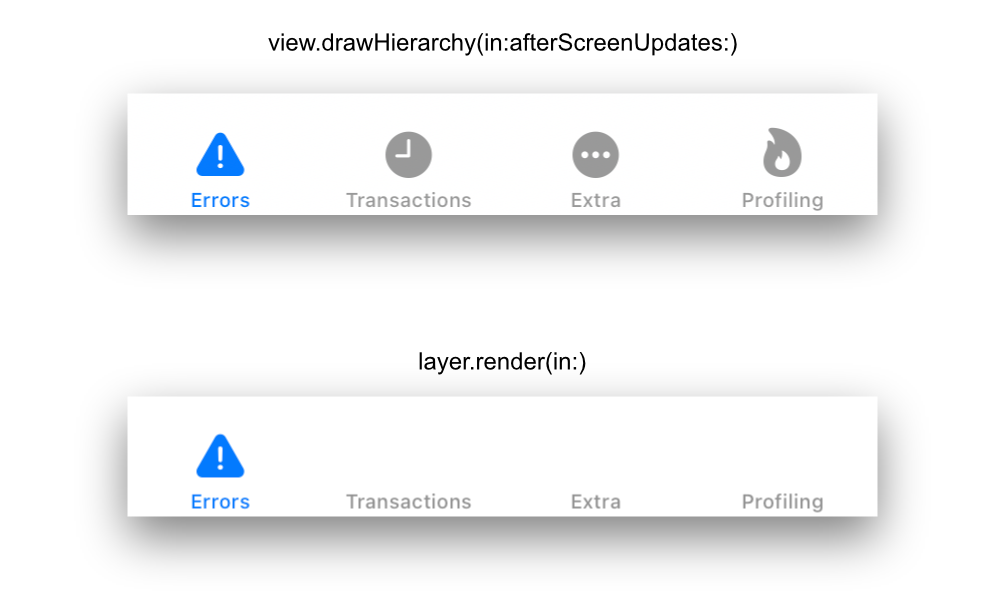
Tab bar icons missing when using layer.render(in:) approach
The impact of the missing UI is not entirely clear and we could not pinpoint the exact cause for this (with unverified assumptions it is a side effect of SF Symbols and the way fonts are rendered). We decided against adopting this behavior as the new default render method in the foreseeable future and stick with drawHierarchy instead.
As some of you might still prefer the even faster render times over completely rendered frames, you can still opt-in by configuring the option options.sessionReplay.enableFastViewRendering = true.
The numbers speak for themselves
The optimization achieved substantial performance improvements, with the most dramatic gains on older hardware. Frame drops decreased from 9-10 frames per second to approximately 2 frames per second on iPhone 8 devices, representing a massive win.
Main thread blocking time improved from ~155 milliseconds to ~25 milliseconds per frame, a ~80% reduction that brings Session Replay overhead well within acceptable performance budgets even on resource-constrained devices.
For teams interested in more detailed information, the complete analysis results are publicly available in pull request #4940 on GitHub.
The optimized view renderer was introduced through a careful rollout process designed to minimize risk while maximizing the performance benefits for users experiencing issues.
Starting with Sentry Apple SDK v8.48.0, the new implementation was available as an experimental feature controlled by the options.sessionReplay.enableExperimentalViewRenderer flag.
This experimental approach allowed early adopters to test the new renderer in their production environments. Based on positive feedback and telemetry data, the optimized renderer became the default implementation in v8.50.2.
What's next for Session Replay
While the new renderer improves performance in a vast majority of scenarios, we've already received new reports indicating specific limitations of this new implementation, especially when working with graphics heavy animations or specific use cases such as supporting a different color space when capturing HDR content.
All of these are great feedback and we are working on addressing them in the upcoming releases. Keep an eye on our GitHub releases and blog for updates, or just try the latest SDK and see the difference for yourself.