Building a Performant iOS Profiler
Building a Performant iOS Profiler
Profilers measure the performance of a program at runtime by adding instrumentation to collect information about the frequency and duration of function calls. They are crucial tools for understanding the real-world performance characteristics of code and are often the first step in optimizing a program.
Apple and Google have first party profiling tools, but they are only usable for local debugging during development. Gaining a holistic view of your app’s performance across different devices, network conditions, and other variables requires the collection and aggregation of data from production, and building a profiler that can run under all of these conditions without introducing excessive overhead is a challenging task.
In this post, we’ll walk through how we built Sentry’s iOS profiler, which is capable of collecting high quality profiling data from real user devices in production with minimal overhead.
Types of profilers
Profilers typically fall into two categories, deterministic and sampling:
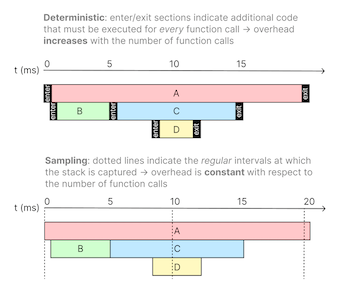
Deterministic profilers prioritize accuracy over performance by capturing information about all function calls.
Sampling profilers collect samples at a fixed interval to limit performance overhead at the cost of only collecting approximate data about function execution that does not have the resolution to determine the duration of all function calls.
Our goal was to build an iOS profiler that had low enough overhead that it could run in production apps with minimal impact to user experience, which meant that we had to build a sampling profiler. Due to iOS’s sandboxing limitations, the profiler also had to be able to run in-process in the profiled application rather than as an external process.
How sampling profilers work in-depth
A sampling profiler is a common type of statistical profiler that collects profiling data by periodically collecting samples of the call stacks on each thread and interpolating function durations between samples.
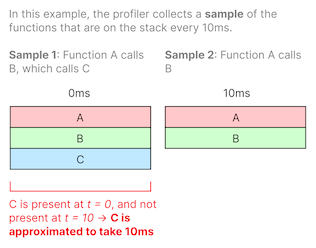
For example, if a call stack capture shows function A calling function B calling function C (A → B → C) and the next capture 10ms later shows A → B without C, we can interpolate the function duration of C to be about 10ms since it existed on the stack at the first sample and no longer exists as of the second sample.
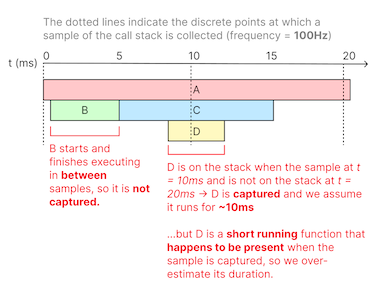
The frequency of the profiler determines the granularity of the data — for example, a profiler sampling at 100Hz will capture samples every 10ms. Functions that run shorter than 10ms will either not be captured at all if they start and finish execution in between samples, or will be captured but have an inaccurate duration of 10ms if they executed overlapping two samples.
More frequent sampling allows us to capture shorter running functions, at the cost of more overhead. We chose to sample at a 100Hz frequency because the 10ms resolution is sufficient to find most serious issues without exceeding our overhead target.
There is more than one way to implement a sampling profiler, and the optimal approach largely depends on the environment the profiler is running in. Our first attempt was using an approach that is popular for profiling on *nix-based operating systems: interrupting threads using a signal handler.
The first approach: signal handlers
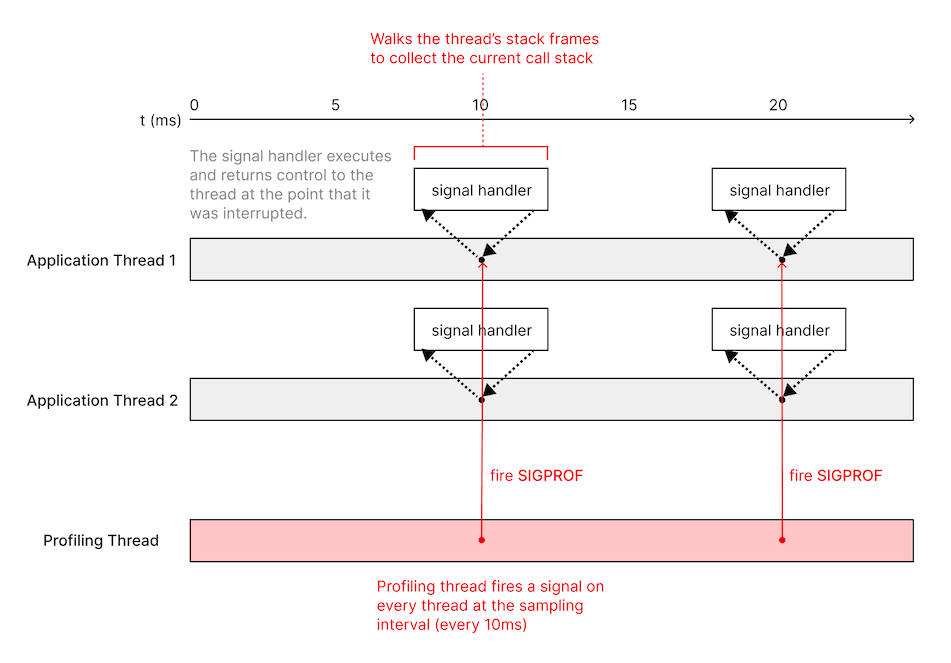
Our first approach was to build a sampling profiler that uses a signal handler to collect the call stack from each thread. This works by having a dedicated sampling thread that fires a signal (SIGPROF in this case, a signal specifically intended for profiling) on each thread at the sampling interval, and then collecting the backtrace from inside the signal handler.
This approach had numerous drawbacks:
pthread_kill, the function we use to fire a signal on a specific thread, intentionally returns an error when firing on worker threads managed by GCD (Grand Central Dispatch). Since most background operations on iOS run on GCD-managed threads, not having this data is a significant drawback. We can work around this limitation by using syscall directly, but this API has been deprecated as of iOS 10.0.
Since the call stack had to be captured inside a signal handler, we were limited to using only a small subset of APIs that were considered “async-signal-safe”. In addition to making it more difficult to collect the call stack, it also complicated synchronizing access to the data structures that we used to store the collected call stack data from multiple threads.
Signal delivery was unreliable. For some threads, we had difficulty collecting any samples, or the gaps between samples were too large. We found an issue filed in the
monorepository (the open source C# and .NET implementation) that described the same problems we were encountering.
Second approach: Mach thread suspend
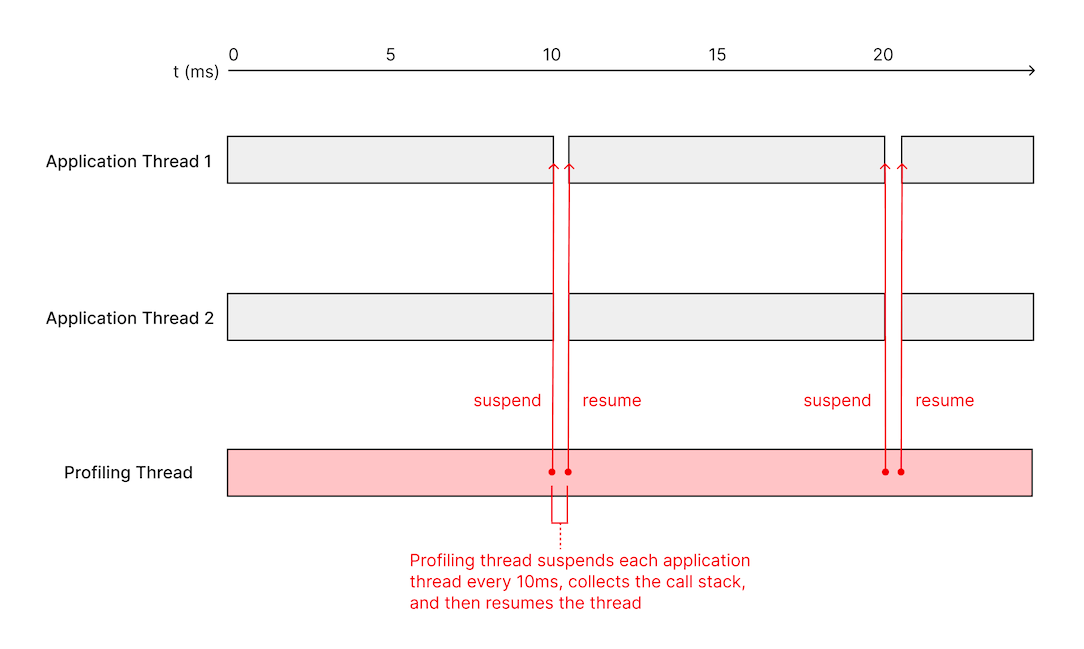
Apple’s Darwin kernel has its own set of APIs for managing threads that is separate from the POSIX thread APIs that are shared across various operating systems. Notably, it has the thread_suspend and thread_resume APIs, which allow us to suspend a thread to collect its call stack and then resume it afterwards. The design of a profiler built around these APIs looks similar to the signal handler based profiler — we have a sampling thread that periodically grabs a list of threads using task_threads, suspends each thread, reads its state using thread_get_state (more on this later), and resumes the thread.
This approach avoids most of the caveats of the signal handler-based approach. For instance, we can now collect the stacks of GCD-managed threads, and thread suspension works more reliably.
However, we still have to consider some of the same async-signal-safety concerns. For example, if we suspend a thread that currently holds a lock, and attempt to run code that tries to acquire the same lock, the entire process deadlocks. It is often non-trivial to figure out whether a particular piece of code is safe to execute in this scenario — even common operations like allocating memory take a lock.
Independent of our choice of thread suspension method, we reduced the code executing while a thread is suspended to the essentials needed to capture the call stack, using as little indirection as possible and calling only functions that we can reliably assume to never take a lock. All other unsafe work (e.g. thread metadata collection) is done before suspending or after resuming a thread.
Capturing the call stack
To find out what functions are currently executing on a thread at a given point in time, we capture the list of function pointers by walking the stack. There are two common approaches for walking the stack: by starting with the frame pointer and reading parent frames on the stack by following the linked list of frames, or by reading DWARF (debugging with attributed record formats) debug information encoded in the application binary.
The frame pointer approach is the simplest to implement, but it only works if the the binary is compiled with frame pointer support. The conventions vary by architecture and operating system, but Apple’s ARM64 ABI guarantees the existence of the frame pointer:
The frame pointer register (
x29) must always address a valid frame record. Some functions — such as leaf functions or tail calls — may opt not to create an entry in this list. As a result, stack traces are always meaningful, even without debug information.
A similar specification exists for 32-bit ARM on Apple platforms (ARMv6 and ARMv7):
The AAPCS document defines R7 as a general-purpose, nonvolatile register, but iOS uses it as a frame pointer. Failure to use R7 as a frame pointer prevents debugging and performance tools from generating valid backtraces.
Therefore, we can assume that if we are running on iOS, a frame pointer will likely be present (aside from uncommon cases where the frame pointer has explicitly been disabled) and we can use it instead of implementing a more complicated DWARF-based stack walking implementation.
While the thread is suspended, we use thread_get_state to dump the register state of each thread, which allows us to read the frame pointer from its corresponding register (x29 on arm64 or r7 on 32-bit ARM). Each stack frame contains a pointer to the stack frame of the caller, so the stack walking implementation is a loop that starts with the frame pointer and follows the linked list of frames to collect a list of function addresses. This list of addresses that represents the call stack of a given thread is considered a single “sample”.
Putting together the profile
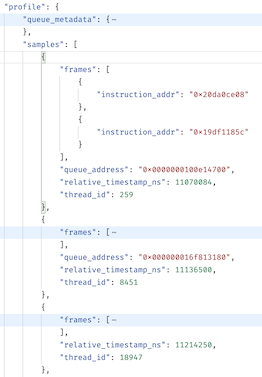
An iOS profile payload is simply a timestamped series of samples (call stacks), grouped by thread ID:
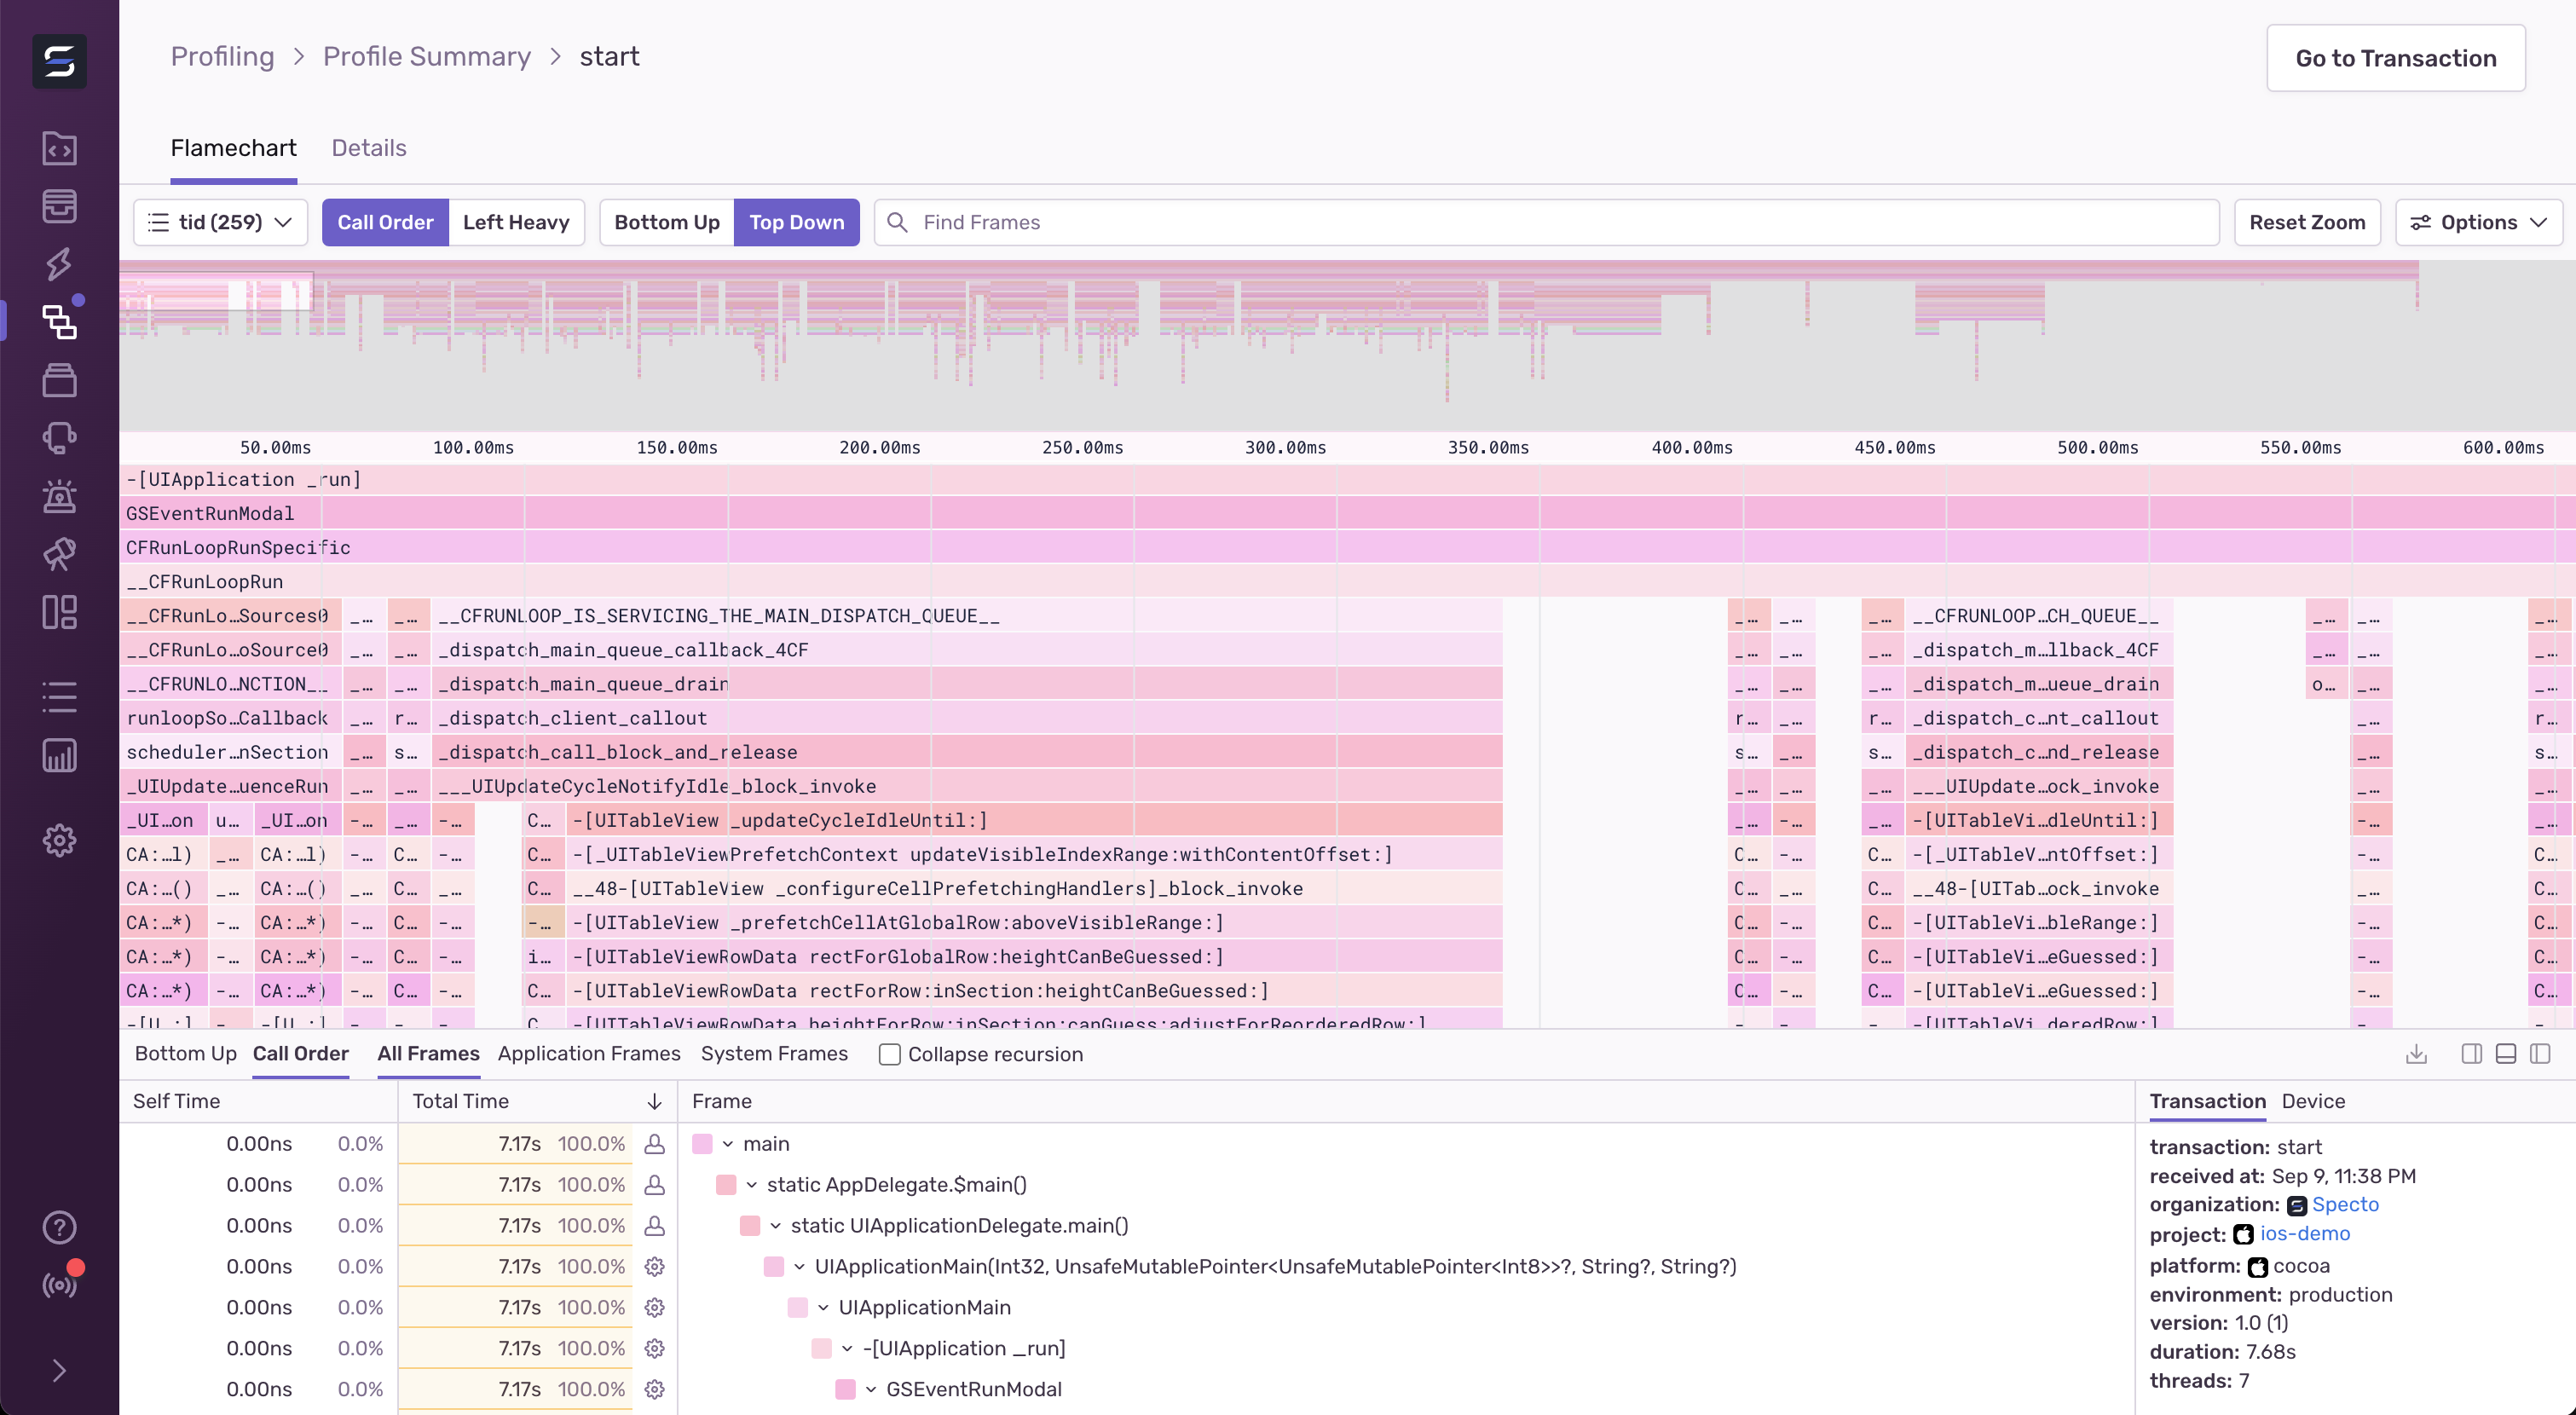
The payload is sent by the Sentry SDK to Sentry’s backend where we perform post-processing to symbolicate the function addresses and compute the differences between samples to determine function call durations. We can then use this data to render a visualization called a flamechart that allows a developer to navigate the function call data over the time axis, separated by thread.
Conclusion
We’ve been testing our iOS profiler with early access customers for the last 5 months and have ingested millions of profiles from real user devices in production. In our benchmarks, the profiler performs with under ~5% average CPU time overhead on a mid-tier iOS device, which satisfies our requirement for a low overhead profiler. The learnings from this project have also helped us start expanding profiling support to additional platforms.
Profiling is available in open beta for all Sentry customers and currently supports native iOS and Android applications. See the documentation to get started!

