Capture and report JavaScript errors with window.onerror

Ben Vinegar - Last Updated:

The window.onerror event handler is a special browser event handler that fires whenever an uncaught JavaScript error has been thrown. It’s one of the easiest ways to log client-side errors and report them to your servers. It’s also one of the major mechanisms by which the Sentry JavaScript SDK works under the hood.
You listen to the onerror event by assigning a function to window.onerror:
window.onerror = function (msg, url, lineNo, columnNo, error) {
  console.log('Error message: ', msg);
  console.log('URL: ', url);
  console.log('Line: ', lineNo);
  console.log('Column: ', columnNo);
  console.log('Error object: ', error);

  return true; // Prevents the default browser error handling
};
When an error is thrown, the following arguments are passed to the function:
msgadds the message associated with the error. For example,Uncaught ReferenceError: foo is not definedin Chrome orCan’t find variable: fooin Safari.urladds the URL of the script or document associated with the error. For example,/dist/app.js.lineNoadds the line number (if available).columnNoadds the column number (if available).erroradds theErrorobject associated with this error (if available).
The first four arguments tell you in which script, line, and column the error occurred. The final argument, the Error object, is perhaps the most valuable. Let’s learn why.
The Error object and stack traces
Error object and stack tracesAt first glance, the Error object isn’t very special. It contains three properties - message, fileName, and lineNumber — redundant values that are already provided to you via window.onerror.
The valuable part is a non-standard property: Error.prototype.stack. This stack property tells you the source location of each frame in the call stack when the error occurred.
function foo() {
  bar();
}

function bar() {
  throw new Error('Something went wrong!');
}

try {
  foo();
} catch (e) {
  console.log(e.stack);
}
In Chrome, the stack trace might look like this:
Error: Something went wrong!
  at bar (file:///path/to/script.js:42:15)
  at foo (file:///path/to/script.js:38:5)
  at file:///path/to/script.js:44:5
Once it’s been formatted, it’s easy to see how the stack property can be critical for debugging an error.
There’s just one snag: The stack property is non-standard, and its implementation differs across browsers. For example, here’s the same stack trace from Safari:
Error: Something went wrong!
  bar@file:///path/to/script.js:42:15
  foo@file:///path/to/script.js:38:5
  global code@file:///path/to/script.js:44:5
Not only is the format of each frame different (Safari uses @ while Chrome uses at), but the frames also have different levels of detail. For example, Chrome identifies that the new keyword has been used and has greater insight into eval invocations. Different browsers have varying formats and detail levels.
Handling promise rejections
Today’s JavaScript applications rely heavily on Promise objects and async/await syntax. Unhandled Promise rejections don’t trigger window.onerror but instead fire a different event:
window.addEventListener('unhandledrejection', function(event) {
  console.log('Unhandled promise rejection:', event.reason);
  console.log('Promise:', event.promise);

  // Optional: prevent the default console.error behavior
  event.preventDefault();
});

// This will trigger the unhandledrejection handler
Promise.reject(new Error('Async operation failed'));
Both window.onerror and unhandledrejection are essential for comprehensive error coverage.
Browser compatibility
Modern browsers universally support all five arguments, including the crucial Error object that contains the stack trace. Legacy browsers (such as Internet Explorer 8-10 and older Safari versions) had limited support, but these browsers now represent less than 1% of global usage and can generally be ignored for new applications.
While Safari supports all five arguments, it may return generic Script error. messages with limited details in window.onerror for certain types of errors, especially those from cross-origin scripts. The Error object’s stack trace is still available when the full Error object is accessible.
Why manual error handling is mostly obsolete
While understanding window.onerror is educational, manually implementing error reporting today is largely unnecessary. Modern error monitoring SDKs like Sentry automatically:
Set up
window.onerrorandunhandledrejectionhandlersNormalize stack traces across browsers
Handle cross-origin script errors
Instrument async code (such as
fetch,setTimeout, and event listeners)Provide rich context (including user actions, breadcrumbs, and performance data)
Here’s how you can use Sentry to capture errors.
Using npm and other module bundlers:
import * as Sentry from "@sentry/browser";

Sentry.init({
  dsn: "YOUR_DSN_HERE",
  integrations: [
    Sentry.browserTracingIntegration(),
  ],
  tracesSampleRate: 1.0,
  environment: "production",
});

// Here's a basic example of how to capture errors in try/catch blocks:
try {
  riskyOperation();
} catch (error) {
  Sentry.captureException(error);
}
Using a CDN:
<script
  src="https://js-de.sentry-cdn.com/YOUR_PROJECT_PUBLIC_KEY.min.js"
  crossorigin="anonymous"
></script>
<script>
  Sentry.init({
    dsn: "YOUR_DSN_HERE",
    tracesSampleRate: 1.0,
    environment: "production",
  });
</script>
Now, you can use the Sentry JavaScript SDK to capture errors.
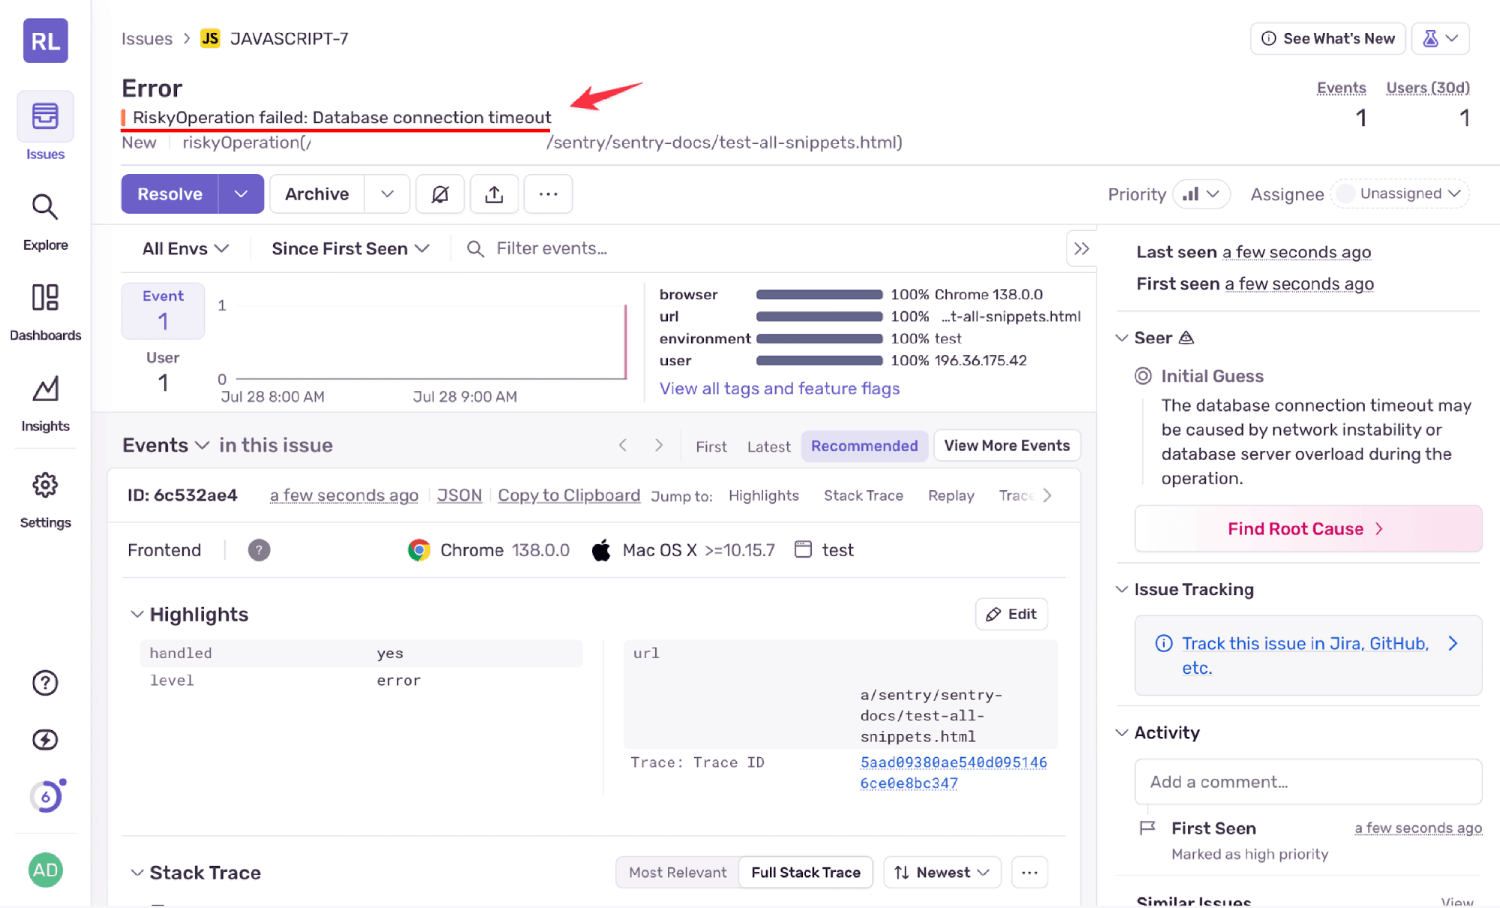
Risky operation failed in Sentry
Note: The basic CDN bundle includes error tracking but not performance monitoring. For tracing features like Sentry.startSpan(), use the tracing bundle or npm package.
Transmitting errors to your server (if you still need to)
If you’re building custom error handling, you’ll need to transmit error data to your server. Let’s use the Fetch API to do that:
async function reportError(errorData) {
  try {
    await fetch('/api/errors', {
      method: 'POST',
      headers: {
        'Content-Type': 'application/json',
      },
      body: JSON.stringify({
        message: errorData.message,
        stack: errorData.stack,
        url: window.location.href,
        userAgent: navigator.userAgent,
        timestamp: new Date().toISOString(),
      }),
    });
  } catch (e) {
    // Silently fail - don't throw errors in error handling
    console.warn('Failed to report error:', e);
  }
}

window.onerror = function (msg, url, lineNo, columnNo, error) {
  reportError({
    message: msg,
    stack: error?.stack,
    url: url,
    line: lineNo,
    column: columnNo,
  });

  return true;
};
The Sentry JavaScript SDK automatically:
Captures unhandled errors and Promise rejections
Normalizes stack traces across browsers
Provides source map support for debugging minified code
Offers performance monitoring and release tracking
Includes user context and custom tags
Handles error deduplication and rate limiting
Summary
While you can build basic error reporting yourself, modern applications benefit from using established tools, like the Sentry JavaScript SDK, which handle the complexities of cross-browser compatibility, error deduplication, performance monitoring, and rich debugging context.
Ready to get started with professional JavaScript error monitoring? Try Sentry’s JavaScript SDK for comprehensive error tracking and performance monitoring.

