Code coverage insights - now in your stack trace
Code coverage insights - now in your stack trace
I’m Jerrod, the Head of Codecov @ Sentry. I’d like to share updates from the first major release of our Codecov and Sentry integration and new Codecov pricing for Sentry customers.
Why this matters
What the integration does
How to set it up
The Why
For those of you who are new to the idea of code coverage, it’s a testing technique that informs what code is or is not tested. It is often represented as a percentage of the number of lines of code that are tested versus the entire codebase. As developers, we would spend time writing tests but had no visibility if the tests were covering the files modified in a given change. This frustration made my co-founder Eli and I want to fix the most obvious problem with test-driven development.
Unsurprisingly, we are big fans of building obvious products that don’t exist (yet), and most developers we talked to wanted to see the testing status of error-producing code. When Sentry acquired Codecov, an integration of this type was your most common response:
But, it made a lot of sense to us too. Even as Codecov became a core part of code review, it wasn’t helping users do their work after deployment.
For too long, developers working on user/customer-facing products have faced the “Ok, but what’s the next problem?”
That problem can roughly be described as:
Receive error/issue in the software
Open data around the error (application performance monitoring and exception handling) “Ok, but what next?”
Open my IDE on the other screen
Swivel head back and forth between my two screens to build a mental model of the code, if there are tests on that code, then figure out how to fix the root cause
If necessary, change the underlying source and write/edit tests to prevent that error in the future.
To take it a step further.
If error-producing code IS NOT tested, the next step might be to write a test around this case.
OR
If error-producing code IS tested, the next step is to investigate the test in question relative to the code logic and see if, for example, a test case was missed.
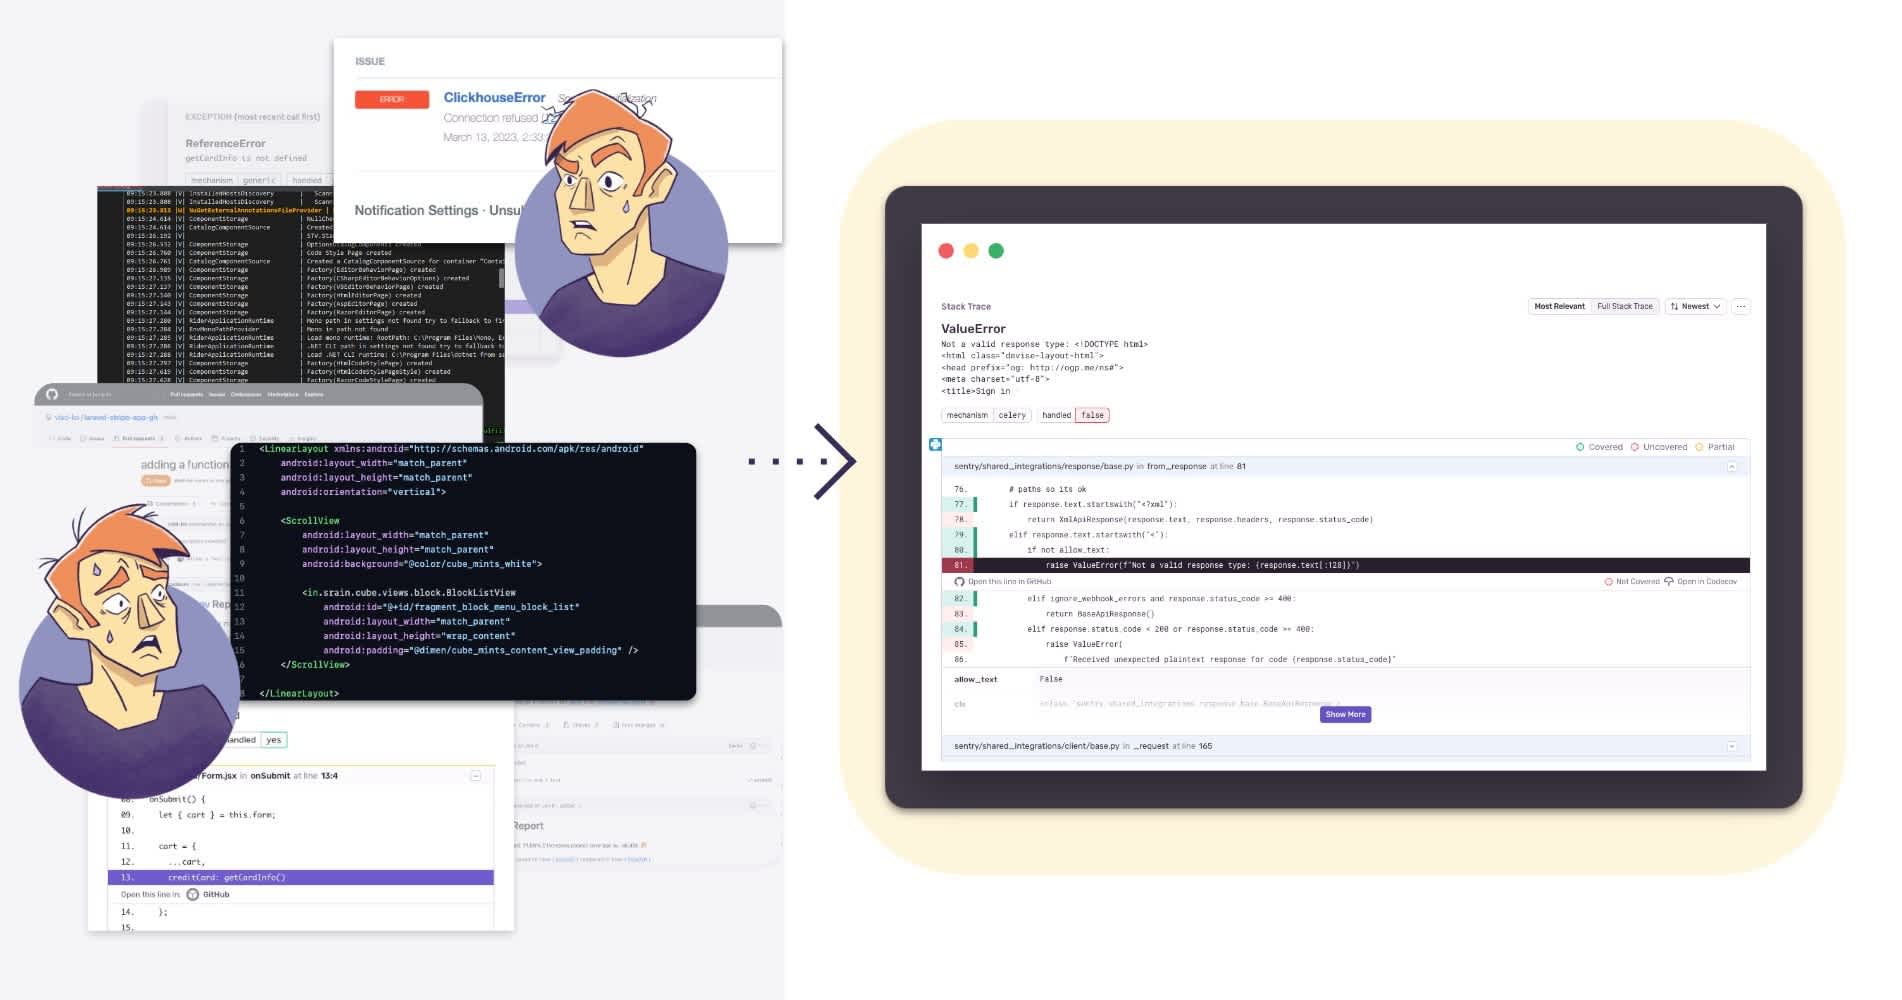
With Codecov in the Sentry stack trace, this is our first foray into unifying those data siloes pre-production and post-deploy, making it faster and easier to debug and patch problems as they come up.
The What
In one sentence: Using Codecov’s integration with Sentry allows you to see the untested code causing errors directly in the Sentry Issue stack trace.
No more dedicated coverage reviews, thinking through the different user paths, or analyzing your codebase. With Codecov in Sentry, you can pinpoint exactly where you need to prioritize adding coverage so you can maintain reliable code without sacrificing developer velocity or productivity.
Improving our test coverage has meant dedicating a “coverage week" every few months to improve tests in places I think are important. With the Sentry and Codecov integration, I no longer have to analyze our codebase and spend cycles thinking about where we need test coverage, instead, Sentry just tells me exactly where I need to focus - saving me several weeks out of my year and reducing my time spent on building test coverage by nearly 50%.
Alex Nathanail, Director of Technology @ vectare.co.uk
To help get you started with code coverage in Sentry, we created a new offer exclusively for Sentry customers where they get 5 seats of Codecov Pro for $29/month. After some napkin math, that works out to ~50% off our current offering.
Note: “Single-player mode” for 1 developer is free for Sentry and Codecov, alike.
The How
Pre-requisites:
For Sentry
You just need to have the GitHub integration for Sentry installed and have your test coverage data in Codecov to start using this integration. You also need Code Mappings to be set up for your GitHub integration. We need this to identify the source code file for showing you test coverage.
Don’t use GitHub? Sit tight, GitLab and Bitbucket support is on the way.
For Codecov
Simply signup for Codecov. Once you have an account, you’re one click away from seeing untested code causing production errors. New to code coverage? No problem. Learn more here.
Sentry and Codecov - Immediately start seeing code coverage in your stack trace
Easiest Method - Do absolutely nothing. We’ll take care of it. We’ll run a daily job that automatically enables the integration when you’re set up on both services.
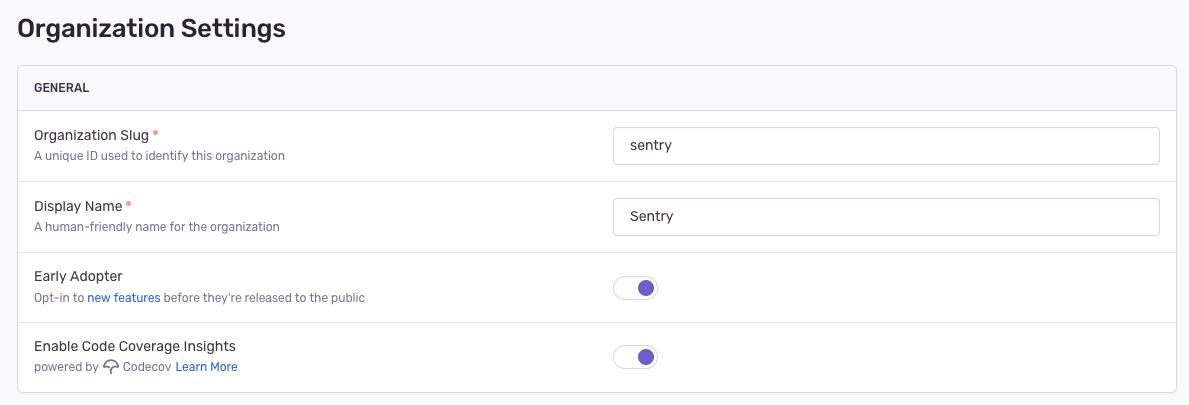
Easy Method - If you’re eager to get started immediately, navigate to your settings page and flip the “Enable Code Coverage Insights” toggle.
Accessing Sentry pricing for Codecov
Once you have accounts set up on both services, visit your subscription management page in Sentry and you’ll be given the option to add code coverage. Follow the link to Codecov and you’ll be able to redeem the offer or update your existing plan. All Sentry customers will also get a 14-day free trial when they upgrade to Codecov Pro for Sentry.
The Closing
As I mentioned above, there are obvious problems in software development that slow us down or leave us scratching our heads. That said, we know there’s a direct correlation between poor test coverage and business-impacting incidents. There hasn't been a single solution that helps developers fill gaps in coverage and fix the most critical issues caused by untested code – until now.
Stay tuned for more updates from Sentry and Codecov as we look to build tighter integrations, more capabilities, and tools to unify pre-production and post-deploy data, to make it faster and easier to find and fix software.
In the meantime can also drop us a line on GitHub, Twitter, or Discord.


