Code-level Application Monitoring for Every Developer
Code-level Application Monitoring for Every Developer
This content is out of date
Since this blog post has been published we’ve evolved the feature to reduce complexity of configuration and automatically store the most valuable transaction data for you. Please see our docs on Performance at Scale to see all the latest info.
The monitoring, tooling, and observability space is crowded. It's hard to keep track of what most tools in this category originally set out to do— but if we had to guess… they were probably built to support monolithic architectures with complex systems, to give Ops and IT a way to minimize the impact of an outage.
However, IT, DevOps, and even developers previously hyper-focused on availability and uptime now face a new challenge: latency— the new outage.
Legacy APM tools focus on surfacing symptoms of latency issues or general performance problems — but that’s not enough for the developer. Developers need an Application Performance Monitoring platform that covers their entire workflow, not a hodgepodge of tools that narrowly focus on infrastructure or system-level changes.
Sentry’s application monitoring platform cuts the guesswork out of figuring out the causes of poor performance, who it’s affecting, and what needs to be updated to solve it. Over the past few months, we’ve built (and are continuing to build) new capabilities that give developers additional context needed to resolve performance issues faster, coupled with more control and transparency over how and what they monitor.
Dynamic Sampling: More data != more value
Collecting data for data’s sake seems inefficient. On the flip side, not having enough data leaves developers in the dark on critical latency issues. So as the days go by, you’re stuck with either a deluge of worthless data or not enough of it to accurately know how your code is performing. That situation puts developers right smack in the middle of subjective debate— customers are roasting you for your app being slow, but your monitoring tool is telling you everything is just fine because either you have a basket of useless information or not enough data to confirm the complaints.
To give developers ownership over their code’s performance (and spend), they now have increased transparency and control over what they monitor and how they monitor it with Dynamic Sampling.
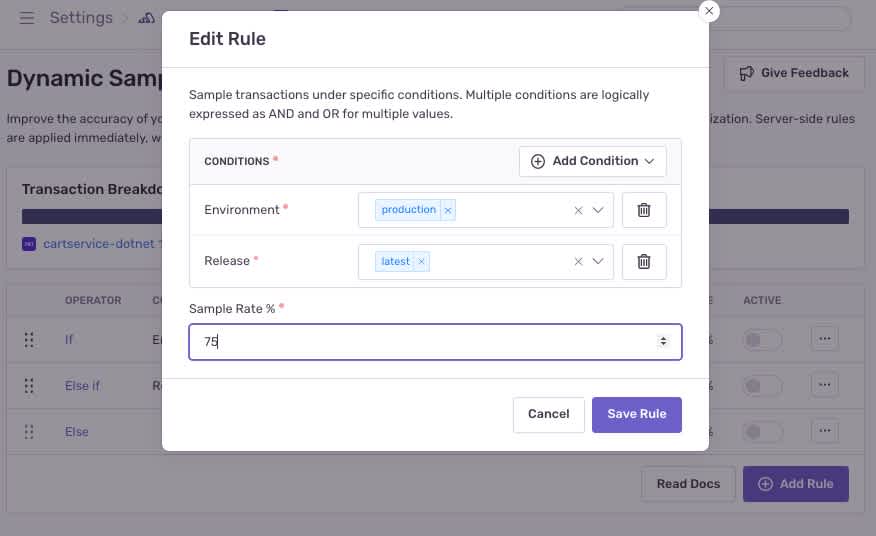
Available to all early adopters, Dynamic Sampling is our newest performance monitoring feature that gives you an additional way to define custom sampling logic in real-time in the UI without having to redeploy anything. You can now define your sample rate for processed and indexed transactions independently while easily configuring sample rules to see more of the transactions you want to explore further in Sentry— and less of the ones you don’t.
“Every time we needed to update sample rates, we would have to push a new release for our native iOS and Android apps which we couldn't do quickly. With Dynamic Sampling we can now make updates in real-time and have more control over the transactions we send, so we always have visibility into our app," said Kaiden Nunes, Senior Software Engineer at Tradeblock.
Compared with setting your sample rate at the SDK level, Dynamic Sampling makes it dead simple to define custom sample rules for critical parts of your app like checkout flows or acquisition paths— you can filter by releases, environments, and soon transaction names.
These controls ensure you can move quickly to always have visibility into your most important services while being able to dial up or down visibility into your application’s overall performance— without impacting your transaction quota.
“Our dev environment and legacy code base both tend to generate noise and are high volume, but it would be helpful to see what’s happening in aggregate via performance metrics. Filtering our indexed transactions by environment and project with Dynamic Sampling is a powerful knob for us to control our costs while still getting visibility into key parts of our app,” explains Mike Diaz, Senior Staff Engineer at SmugMug.
Performance Issues: Slow you can act on quick(ly)
Normally, developers rely on a few metrics to know if their software is performant and reliable. Fluctuations in throughput, latency, and Apdex are usually strong signals that you should poke around to see if there are any performance problems. Wouldn’t it be nice if there was a tool that just yelled at you about critical latency problems and exactly what’s going on? Yes? Great. Sentry will do just that.
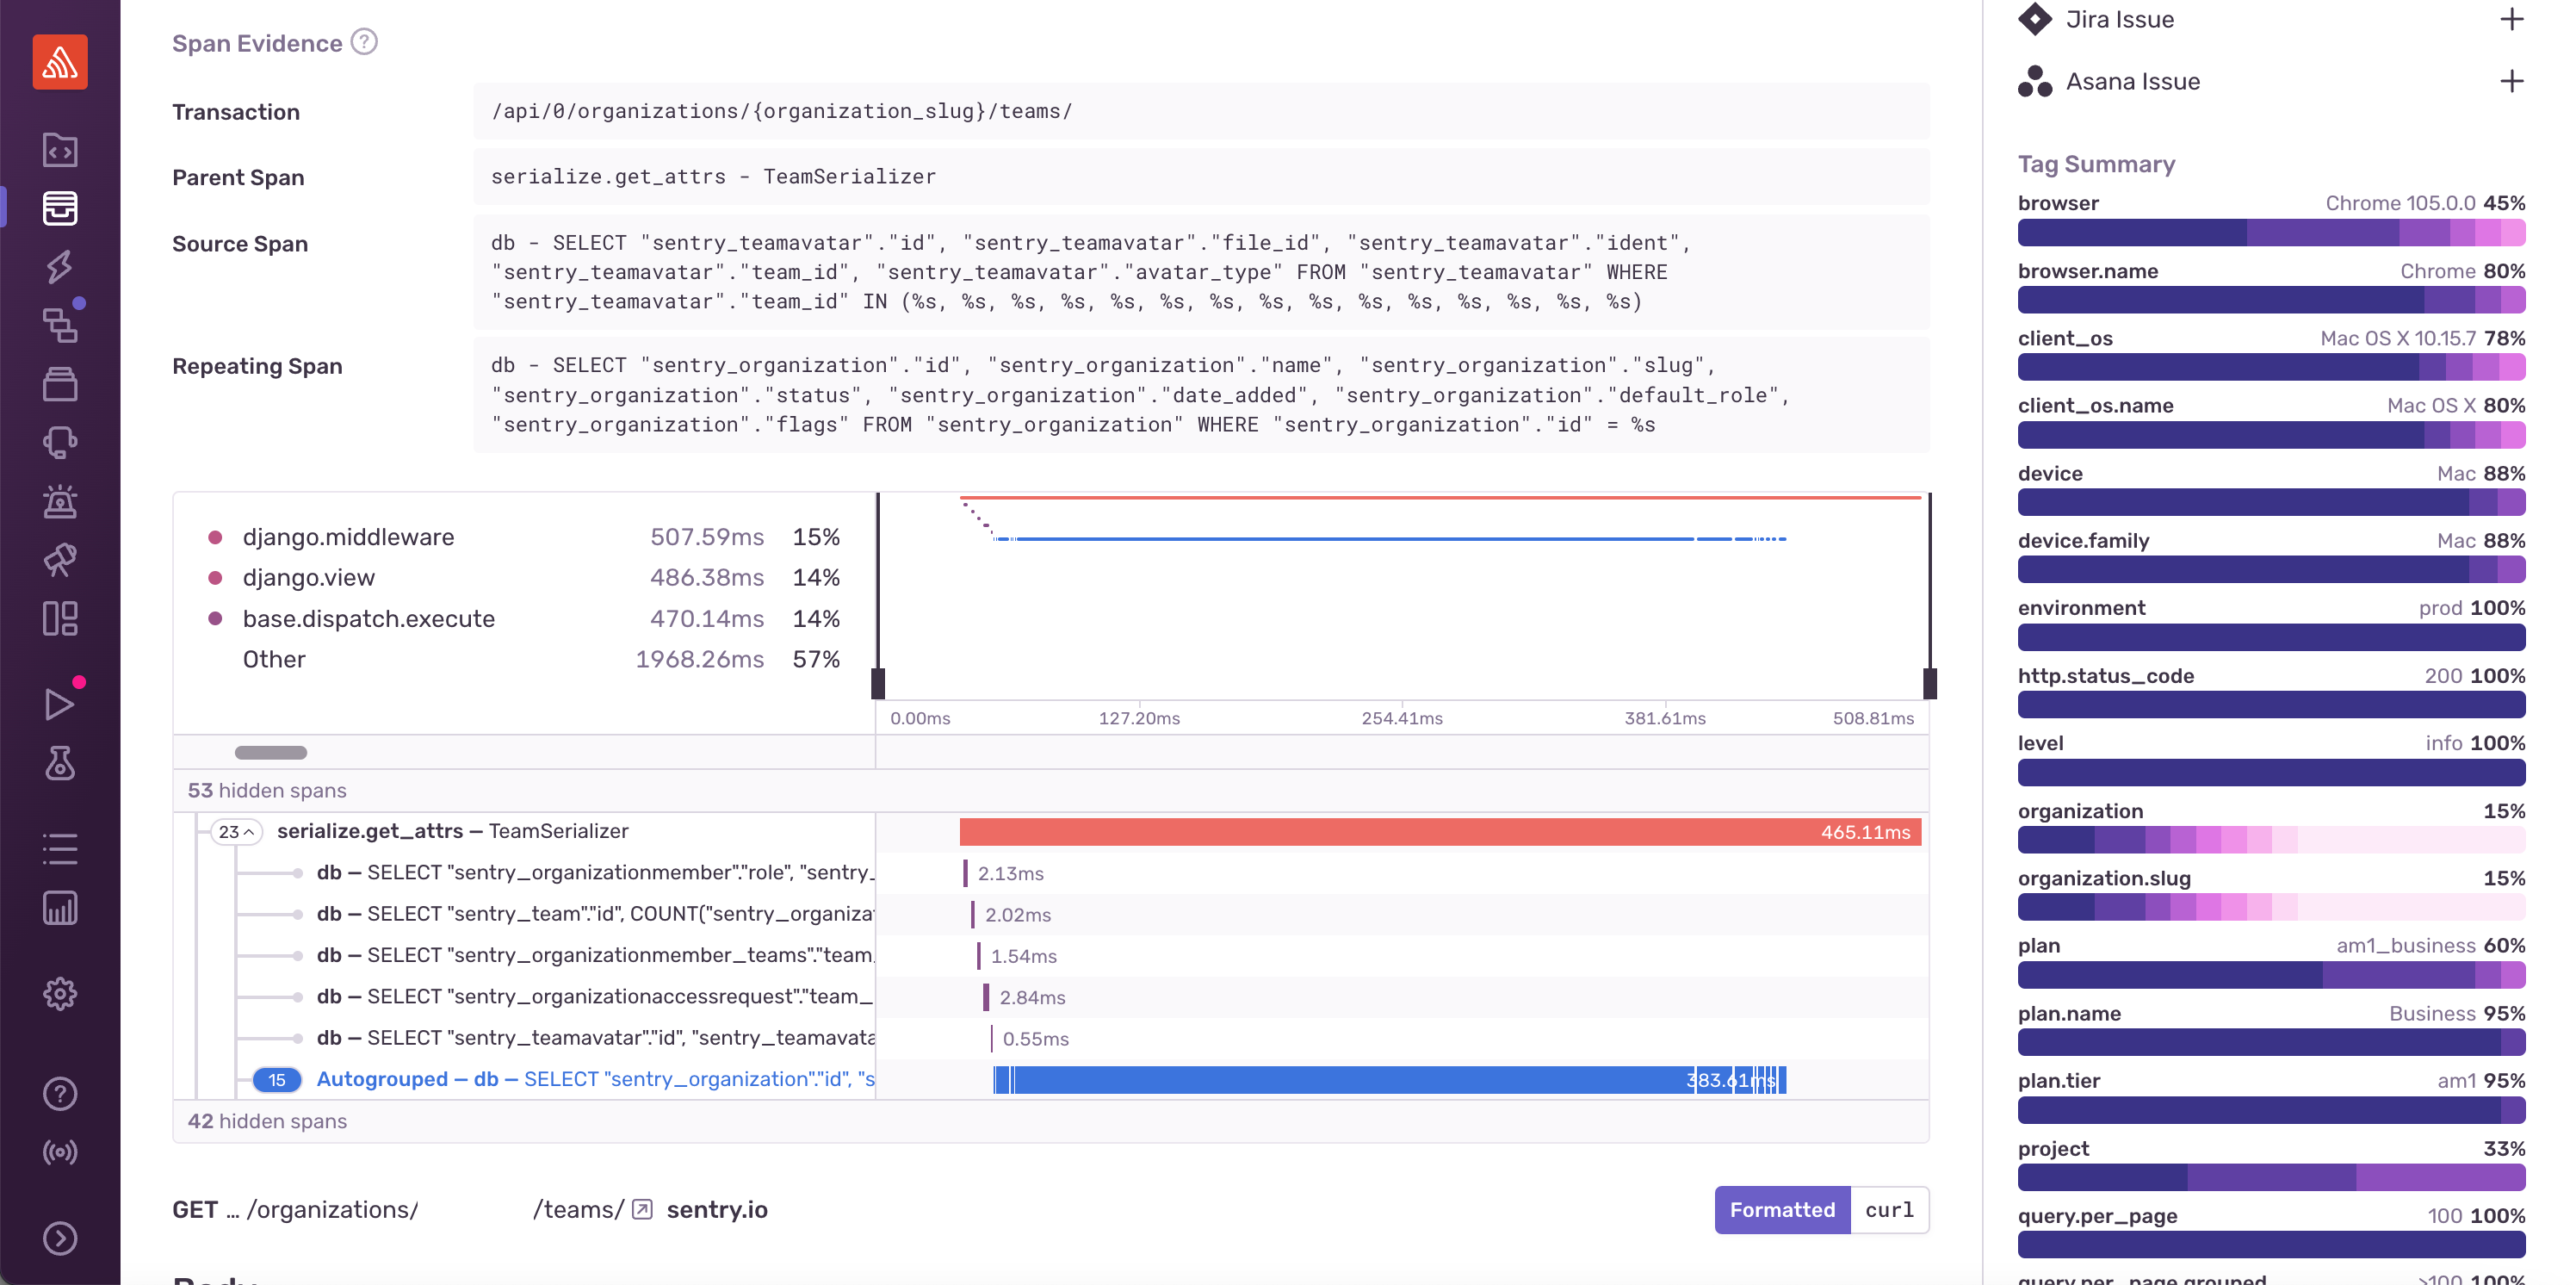
Now in your issues feed, you’ll see a new issue type— Performance Issues— and, in the coming weeks, you can get notified of them just like you do for errors through Issue Alerts. Performance Issues shows you the most focused and relevant spans (using a condensed span tree) in the Issues Detail view. This makes it easier to identify the root cause of a performance issue and saves a ton of time and effort needed to find the issue and then solve it.
While there are many different possibilities for performance issue types, in this initial phase, we’ll only detect N+1 database query problems. This common type of database problem occurs when your code executes too many additional queries as it fetches data from the database (when the same data could have been retrieved with a singular query), and can make requests slow. For example, in Django, the object-relational mapper (ORM) can cause N+1 problems— when looping through parent objects (given an initial query with a parent-child relationship), excessive queries can significantly increase page load time.
Previously in Sentry, you’d need to go into the Performance tab to see that latency was high— then actually select a transaction and a slow transaction event associated with it. You’d then comb through spans and functions to find your pesky N+1 issues causing trouble. Today, Sentry serves you the N+1 directly in your issues feed for you to triage, assign, and resolve— thus delivering faster time to value. In the future, Sentry Performance Issues will account for even more problem types.
Available to all early adopters, performance issues are now displayed in the issues feed just like regular issues. You can also filter your issues feed on “issues.category:performance” to see all of your performance issues together.
Real User Application Profiling for iOS and Android
For mobile applications, even small glitches or app freezes can prompt a customer to jump ship. For example, 48% of users will delete an app after experiencing a single performance issue and for every one-second delay in page load times, conversions drop by 7%.
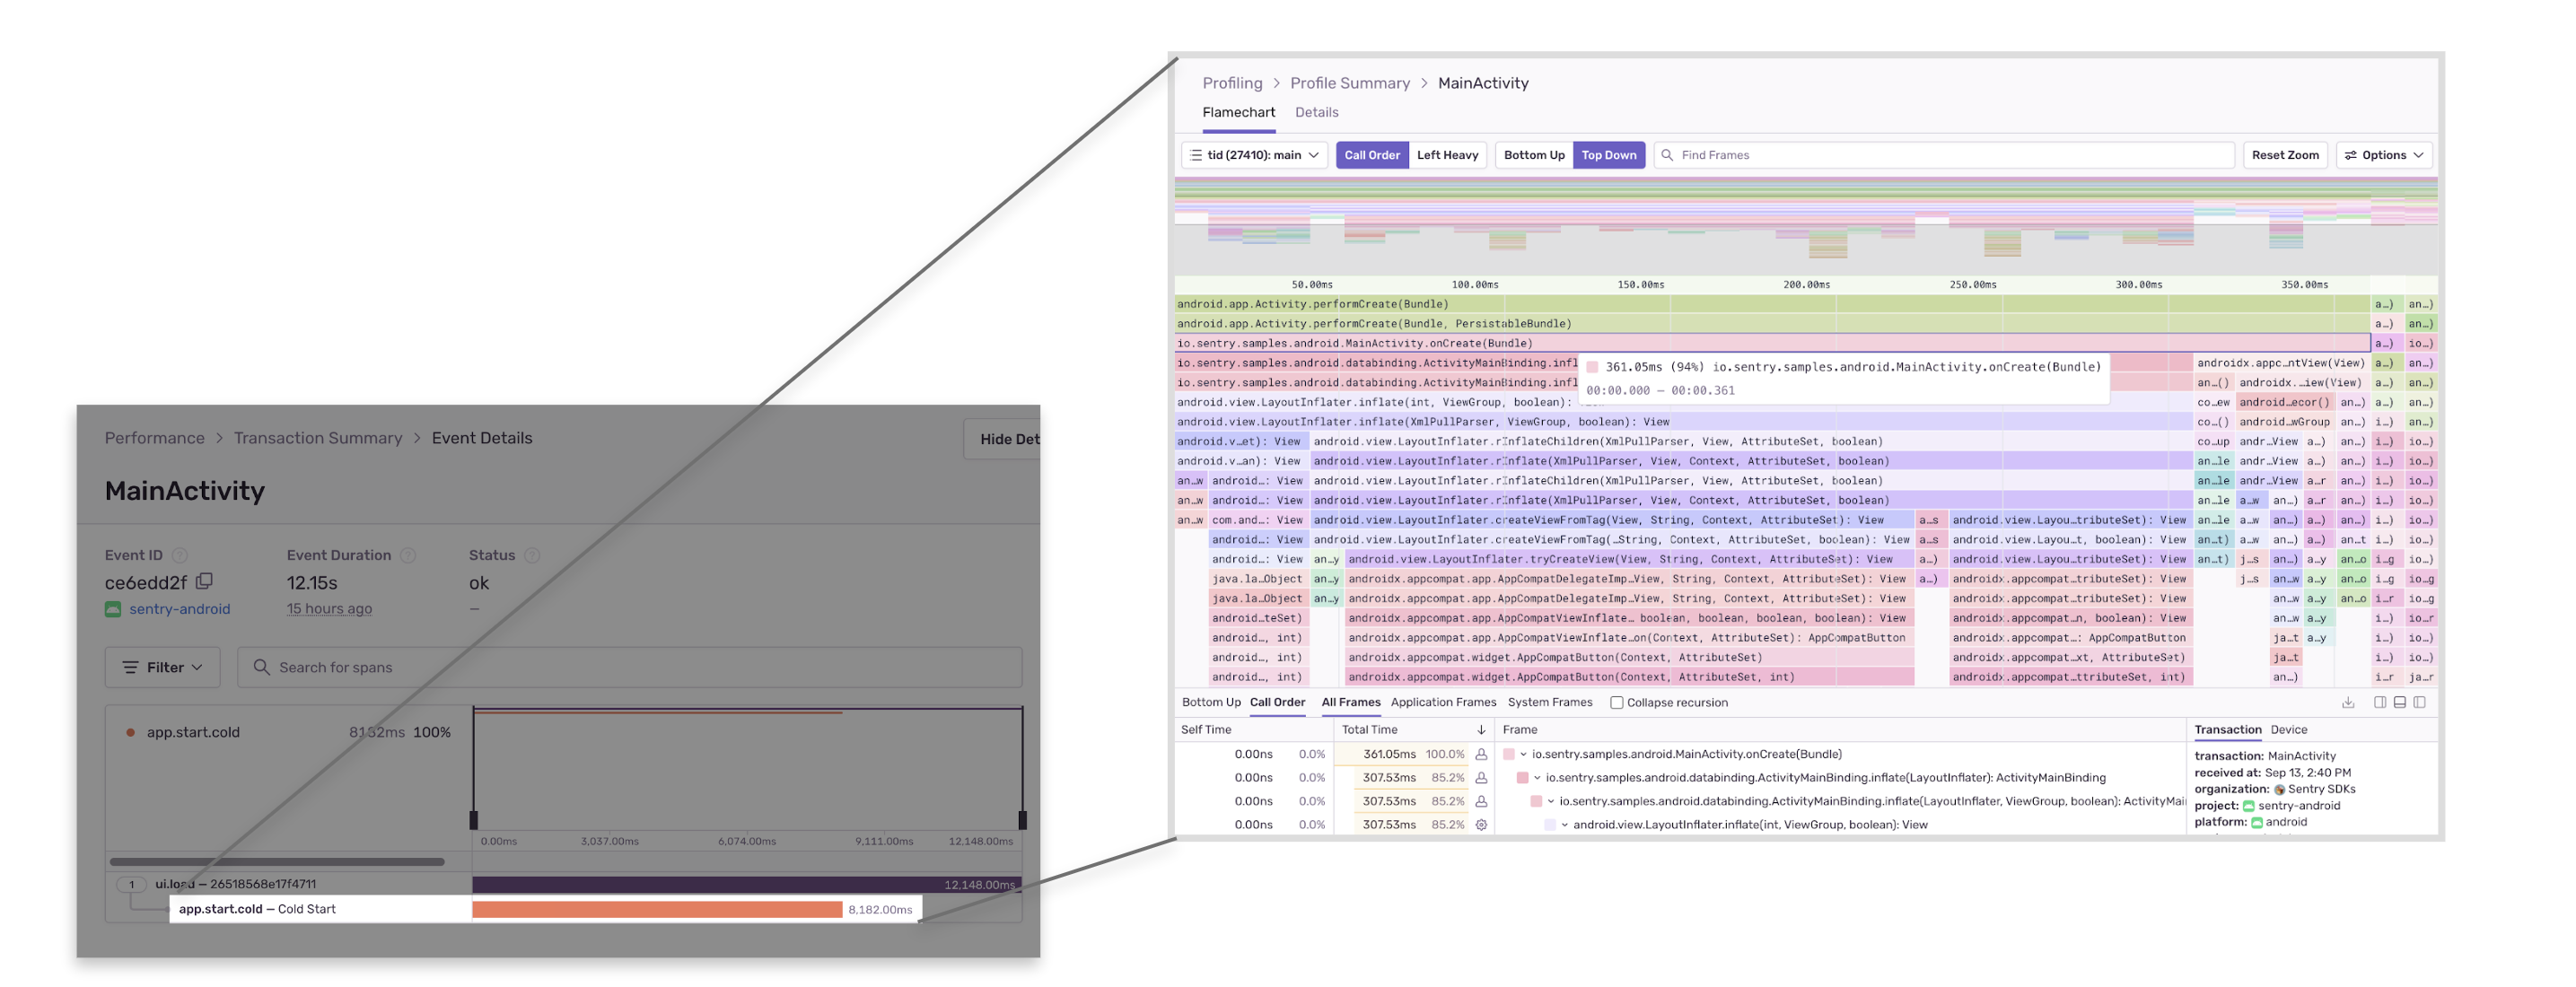
With Sentry Profiling for iOS and Android, mobile developers can quickly go from slow spans to root cause by surfacing the exact functions and lines of code that cause slow app starts, jank, or anything else that results in someone uninstalling a mobile app. Sentry Profiling is designed to give developers detailed code-level insight in how their app is performing in production, all on real user devices. With Profiling:
The environments are diverse and reflect real world conditions. Sentry Profiling automatically collects performance data from every environment your app is running on in the real world. This lets you pinpoint whether a particular device hardware, OS version, app version, or network condition is causing the issue— making troubleshooting easier.
Cover a broad possible set of user flows. Since the data is collected from actual users using your app as they normally would, we can capture all kinds of usage patterns that you may not have thought about when building your own performance tests.
Getting started is simple. Just integrate the Sentry SDK, enable profiling, and ship your app— and let us worry about analyzing performance and detecting regressions between versions. We encourage testing in production, which improves developer velocity and reduces the overhead of having to maintain your own tests and tooling.
The overhead is minimal. Depending on the platform, the overhead can be lower than 1% of your app’s CPU time.
There really is no excuse to not profile in production anymore. For a limited time, try Profiling for free in beta.
Session Replay: Bridging the gap between code and user experience
An oftentimes frustrating but necessary part of debugging code is being able to reproduce the bug itself. Stack traces and breadcrumbs provide code-level context into the user journey, but it can be challenging to understand exactly how your users got to the issue, and what happened afterward. Getting on a call with the user is not always possible, and teleporting to the user unfortunately isn’t an option either. However, we’re building something that bridges the gap between code and user experience — Session Replay.
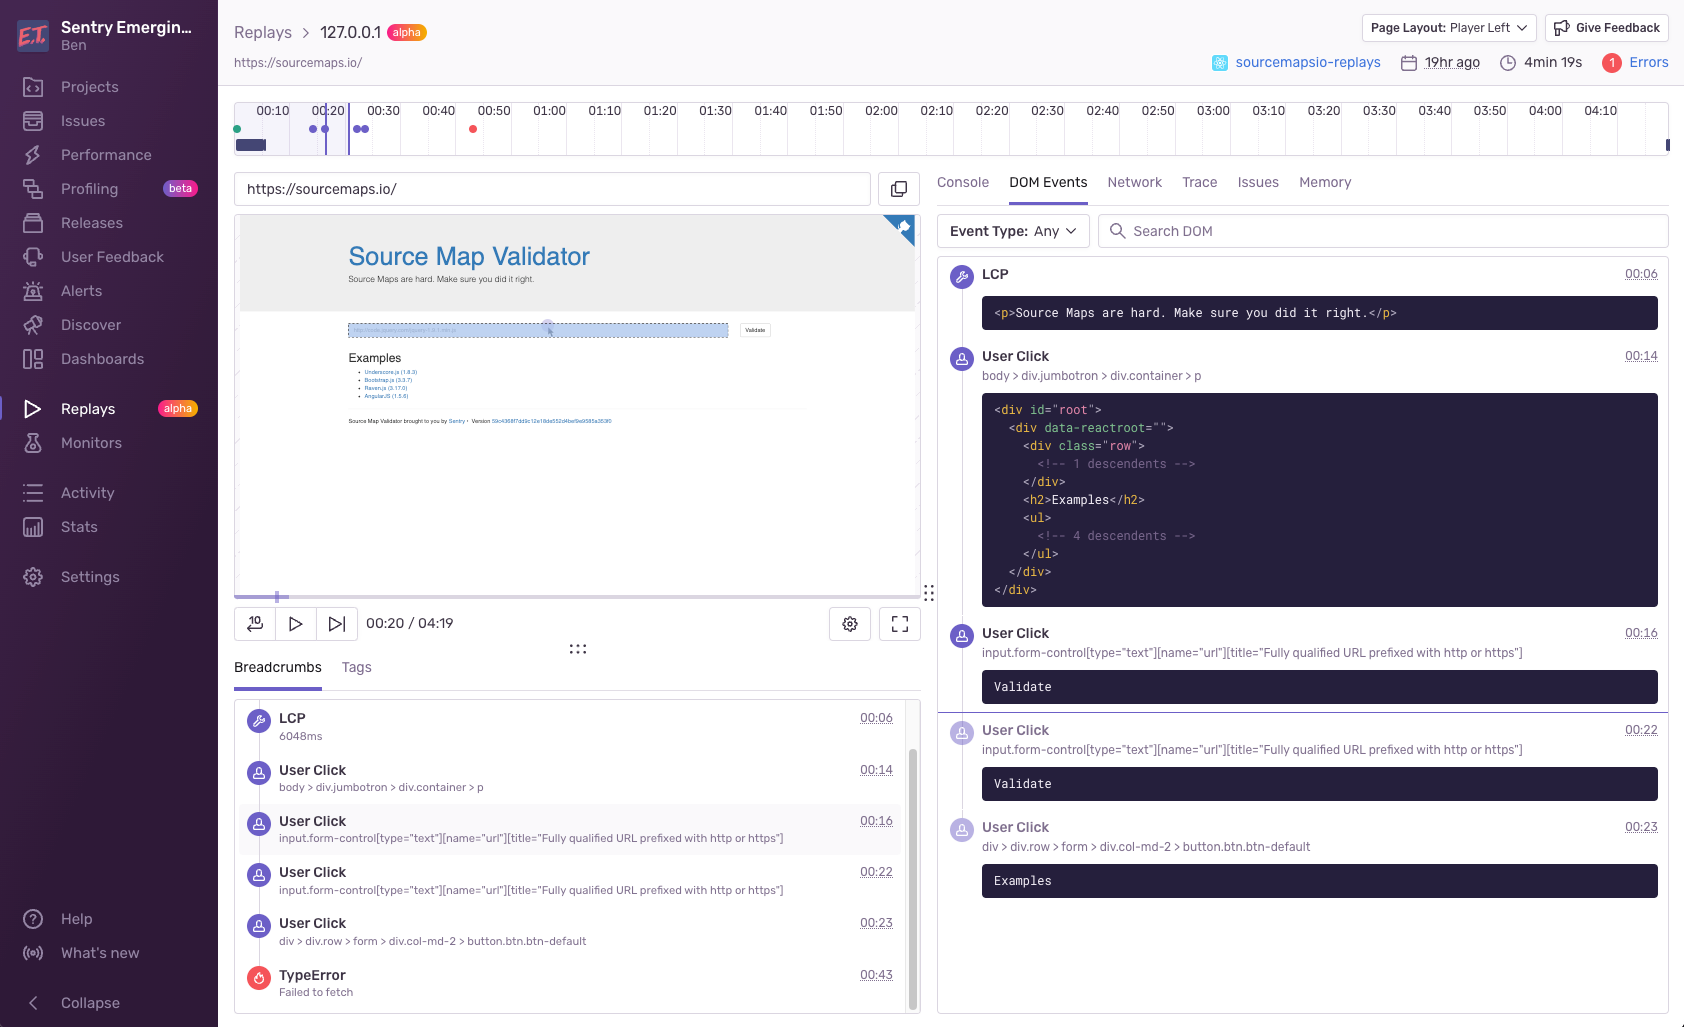
Session Replay lets developers rewind and replay every step of the user journey associated with an error or performance issue. It accounts for user interactions — including, but not limited to page visits, mouse movements, clicks, and scrolls — to augment the debugging process and give developers the deep context they need to get to the root cause quicker.
For example, a web developer can deduce from the stack trace that an error on her website’s checkout page was due to a TimeoutException, but the scenario in which the error occurred is still unknown. Instead of clicking through the UI blindly to try to recreate the error, she can quickly review the playback of the session to see that the error was tied to the “purchase” button on the checkout page and that it had caused the user to bounce. With this knowledge, the developer knows exactly what and where to debug, and what impacts it has on the user experience.
In addition to the playback capabilities, Session Replay allows you to navigate your application’s console output, view network calls, and even inspect your application’s DOM tree — it’s like having your browser’s dev tools right inside Sentry. And since we’re launching this as part of Sentry, Session Replay will be embedded into your existing workflow so you can get all the details related to an issue in one place.
Session Replay is available to use for a limited set of customers right now, but if you’d like to get early access, hop on the waitlist and we’ll notify you as soon as it’s ready.
Building performance with opinions
We’re not trying to introduce the next generation of anything, but the legacy APM tools out there don’t monitor your code and are not built for developers who build and run their own products and services. And as more developers are forced to use these tools, the gaps are becoming apparent. While these product additions are a move in the right direction, we're committed to continuing to invest in building application monitoring for every developer, focused on making it as painless as possible to see critical latency issues and solve what’s urgent faster.
To get started with the features available for early adopters or open beta — just head to settings and toggle the early adopter switch. For Session Replay, sign up for the waitlist here.
Regardless of which features or products you try, we want to hear from you. Reach out in Discord, Github, or even email us directly at performance@sentry.io to share your experience and feedback.
And if you’re new to Sentry, you can try it for free today or request a demo to get started.


