Common Downtime Causes and How Website Monitoring Can Help


Lewis D. -

Downtime only shows up at the most inconvenient moments — like right after a 'quick deploy' or during the five minutes you dared to step away. Maybe it’s a traffic spike hammering one endpoint and taking the rest down with it. Maybe it’s that 'small change' you confidently shipped straight to prod.
Either way, users can’t reach your site, and now you’re debugging live in production.
In this post, we’ll walk through how basic website monitoring can help you spot things earlier—before the status page update, the Slack pings, or tweets. We’ll use a simple Node.js Express app to show how monitoring can surface patterns, reveal bottlenecks, and maybe even buy you enough time to finish your coffee.
Quick aside before we dive in: to keep things simple and not totally theoretical, I spun up a basic Node.js Express app and hooked it up to just enough monitoring to be useful—without going full enterprise observability stack.
Here’s what I set up:
Sentry tracing, so I get alerts when something breaks.
Source maps uploaded via the Sentry Wizard, because minified stack traces are the worst.
Threw the app onto a lightweight hosting service
Created an uptime monitoring alert in Sentry, which pings our public endpoints and alerts if anything stops responding. It runs separately from tracing, so it catches stuff even when the app isn't throwing errors—just failing to respond at all.
Which Sentry features are in play?
Here's a quick map of every Sentry feature you'll spot in this article and the role it plays.
Feature | What it watches | Where you see it used below |
|---|---|---|
Whether a public URL or endpoint is reachable | Fires the first alert when an endpoint makes the whole site crash and later for another isolated endpoint route. | |
Unhandled exceptions and logged errors | Catches a missing-package stack trace after a bad deploy and an example of an SQL-injection wipe-out. | |
Latency for each transaction | Powers a p75 Transaction Duration alert (300 ms) we set on an endpoint so that we can spot performance regressions. | |
End-to-end spans across functions and services | Lets us jump from a slow endpoint transaction into a flame graph to confirm that a recursive call is hogging CPU. |
Think of them as layers: Uptime tells you something is wrong, Error or Performance tells you what went wrong, and Tracing shows where in the call stack it lives.
Detecting overloading with website monitoring
Overloading occurs when the task you want your web app to perform is too resource-intensive for your server’s hardware. It is one of the most frequent causes of downtime because many teams struggle to scale their hardware to match the complexity of their software.
Consider this scenario:
Our Node.js Express app has an endpoint at /overload. This endpoint requests some CPU-intensive calculations in the form of the following Fibonacci function:
function fibonacci(n) {
    if (n <= 1) return n;
    return fibonacci(n - 1) + fibonacci(n - 2);
}

app.get("/overload", function overloadHandler(req, res) {
    const n = parseInt(req.query.n, 10);
    if (isNaN(n) || n < 0) {
        return res.status(400).end('Invalid input');
    }

    try {
        const result = fibonacci(n);
        res.end(`Fibonacci result: ${result}`);
    } catch (error) {
        res.status(500).end(`Internal Server Error: ${error.message}`);
    }
});
Note: Because this example demonstrates overloading, the code is purposefully inefficient, and it is hosted on a server with fewer resources than many smart fridges.
The app is hosted on a free lightweight server, so it does not take many concurrent connections trying to access this endpoint for the whole app to crash.
Because we have enabled an uptime monitoring alert in Sentry, we quickly get a notification that our app is down, and we can start the investigation.
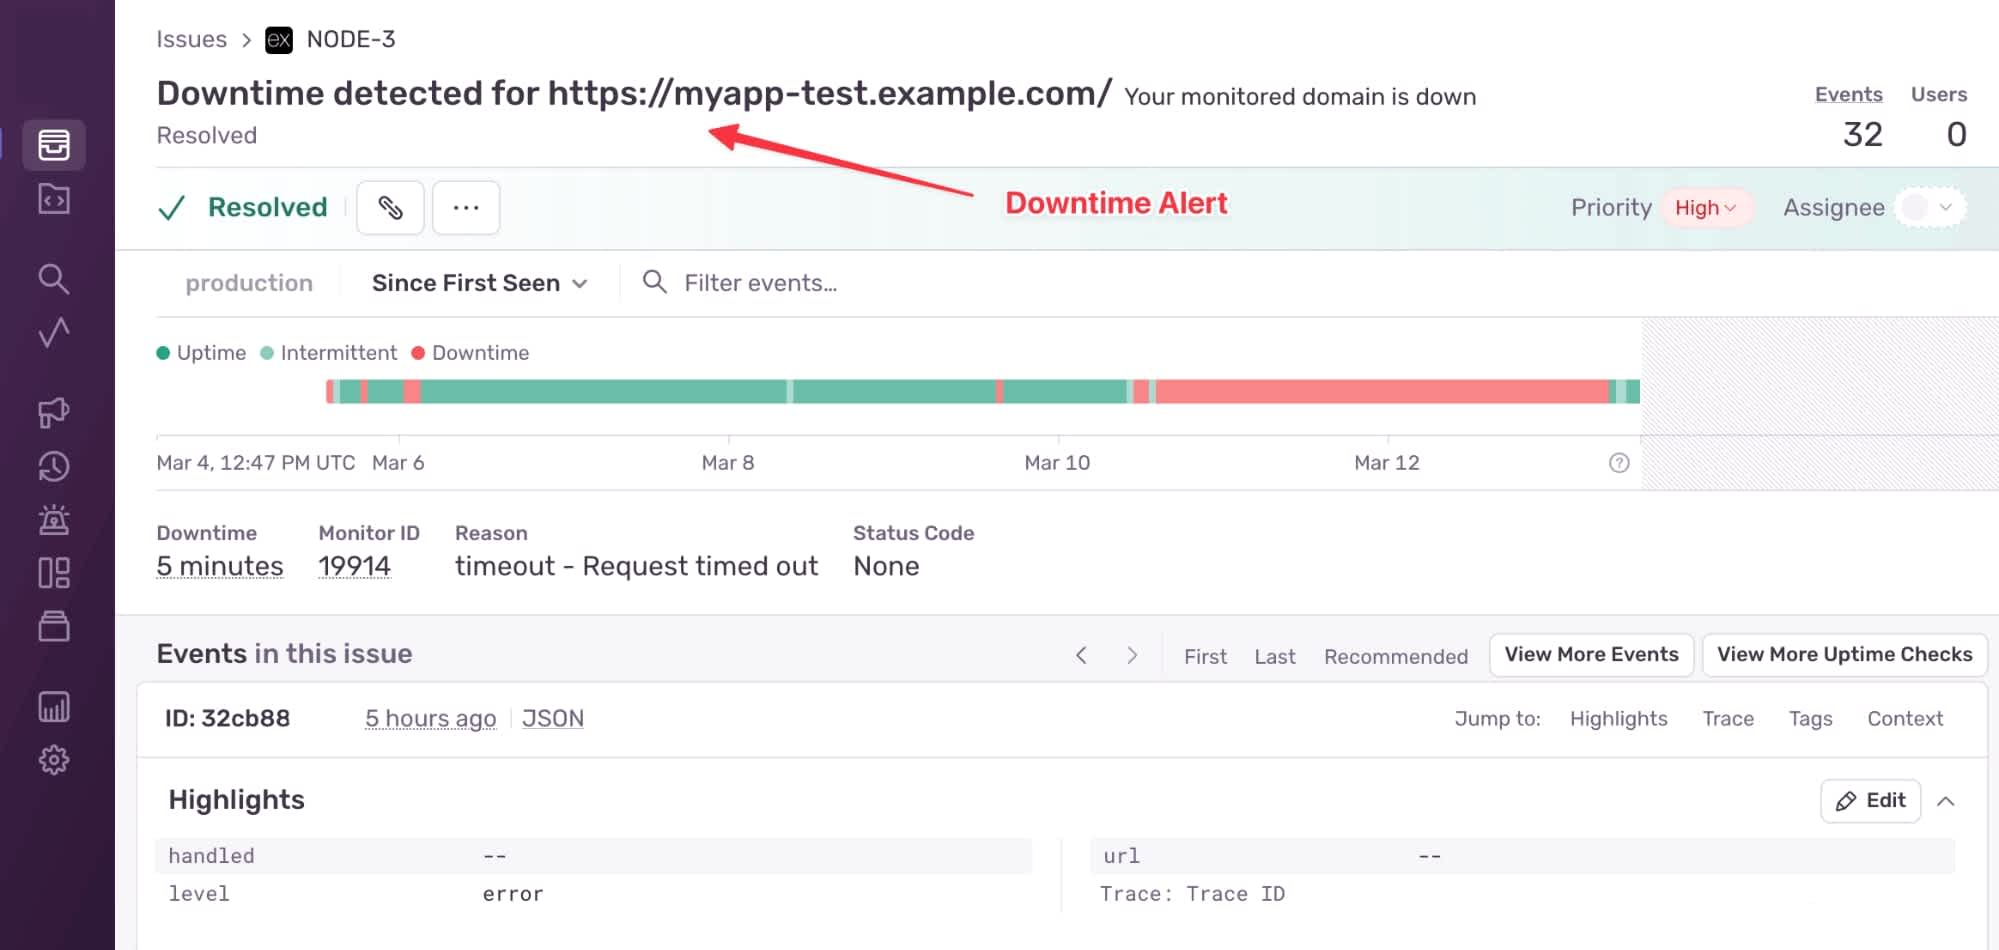
Downtime Alert
In this case, we ran into a hardware limitation. We can see that our app is timing out by looking at the Sentry monitoring dashboard, but Sentry can’t know what’s happening with the RAM on our hosting service, so we log into that to find out why the entire app has gone down.
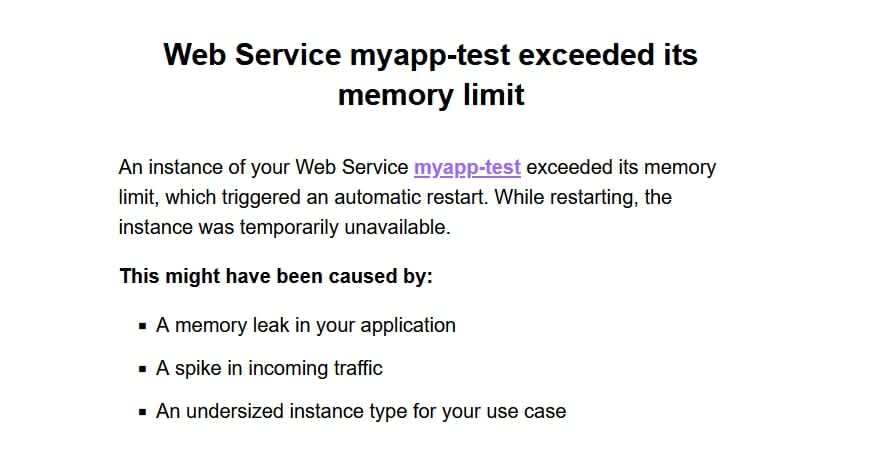
Memory exceeded
So, how do we fix this? Getting our app up and running again is a simple case of turning it off and on again. However, this does nothing to prevent the same thing from happening in the future.
We have two options for dealing with overloading:
We can increase the resources allocated to our app.
We can decrease the amount of computation required for the tasks.
Most often, the fastest and easiest solution is to increase the app’s resources. For example, we could move a couple of sliders in our dynamic server environment or pay our web host of choice to move our app to higher-tier hardware. If we managed our own server, we would have many options for upgrading its hardware. However, all of these options have one thing in common: they cost money.
As hardware gets cheaper, it becomes easier to rely on powerful resources to run inefficient code than it is to improve fundamental app performance. The Apollo Guidance Computer used in the 1960s moon landing had less than 100 KB of RAM available. Does this mean that in 2025 we should spend months optimizing our code so that it can run on a sufficiently smart toaster? That depends on whether we are developing a web app for toasters. In the end, every project has unique requirements and the most important thing is that we understand the scalability of our product before blindly allocating more resources and being met with an unexpected bill.
In the case of our example app, we can assume there are no desperate users waiting for their Fibonacci numbers, so it doesn’t make sense to throw more resources at the problem.
Let’s consider a software remedy instead.
Setting up Performance Alerts
We can begin by adding a Transaction Duration alert to our Sentry configuration to allow us to see if the endpoint performs badly again in the future.
Setting up a Performance Alert
In this example, we configure a p75 threshold at 300ms, meaning Sentry will alert us if 25% of our transactions exceed a duration of 300ms. To learn more about tracking metrics in Sentry, refer to the Performance Metrics documentation.
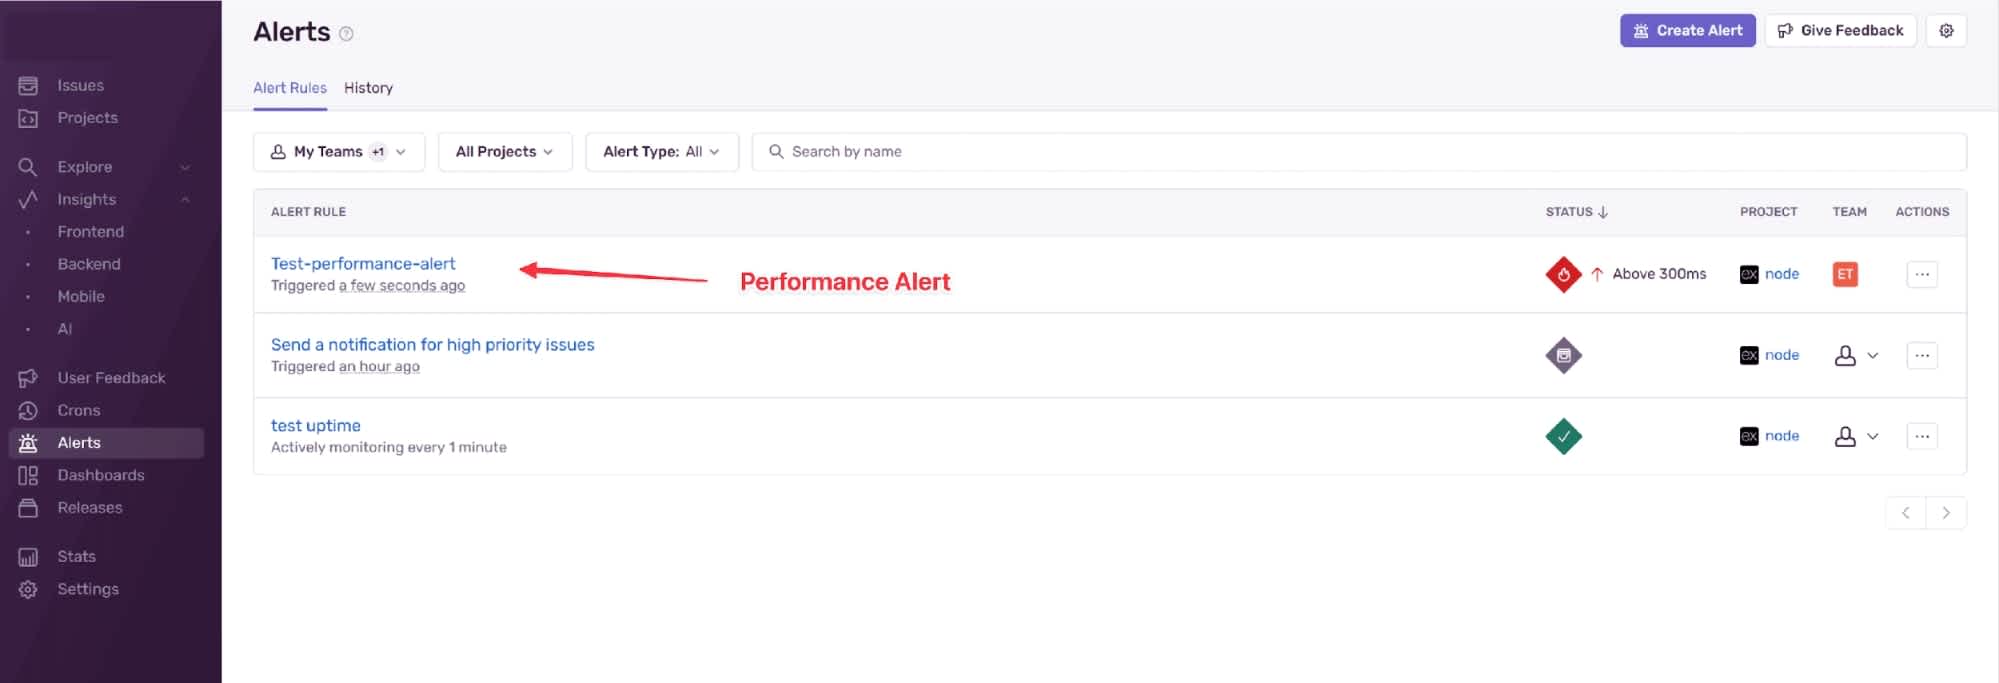
Performance Alert
When we receive this alert, we can click on it to view more details. Here, we see that the average transaction to the /overload endpoint has a duration of over one minute.
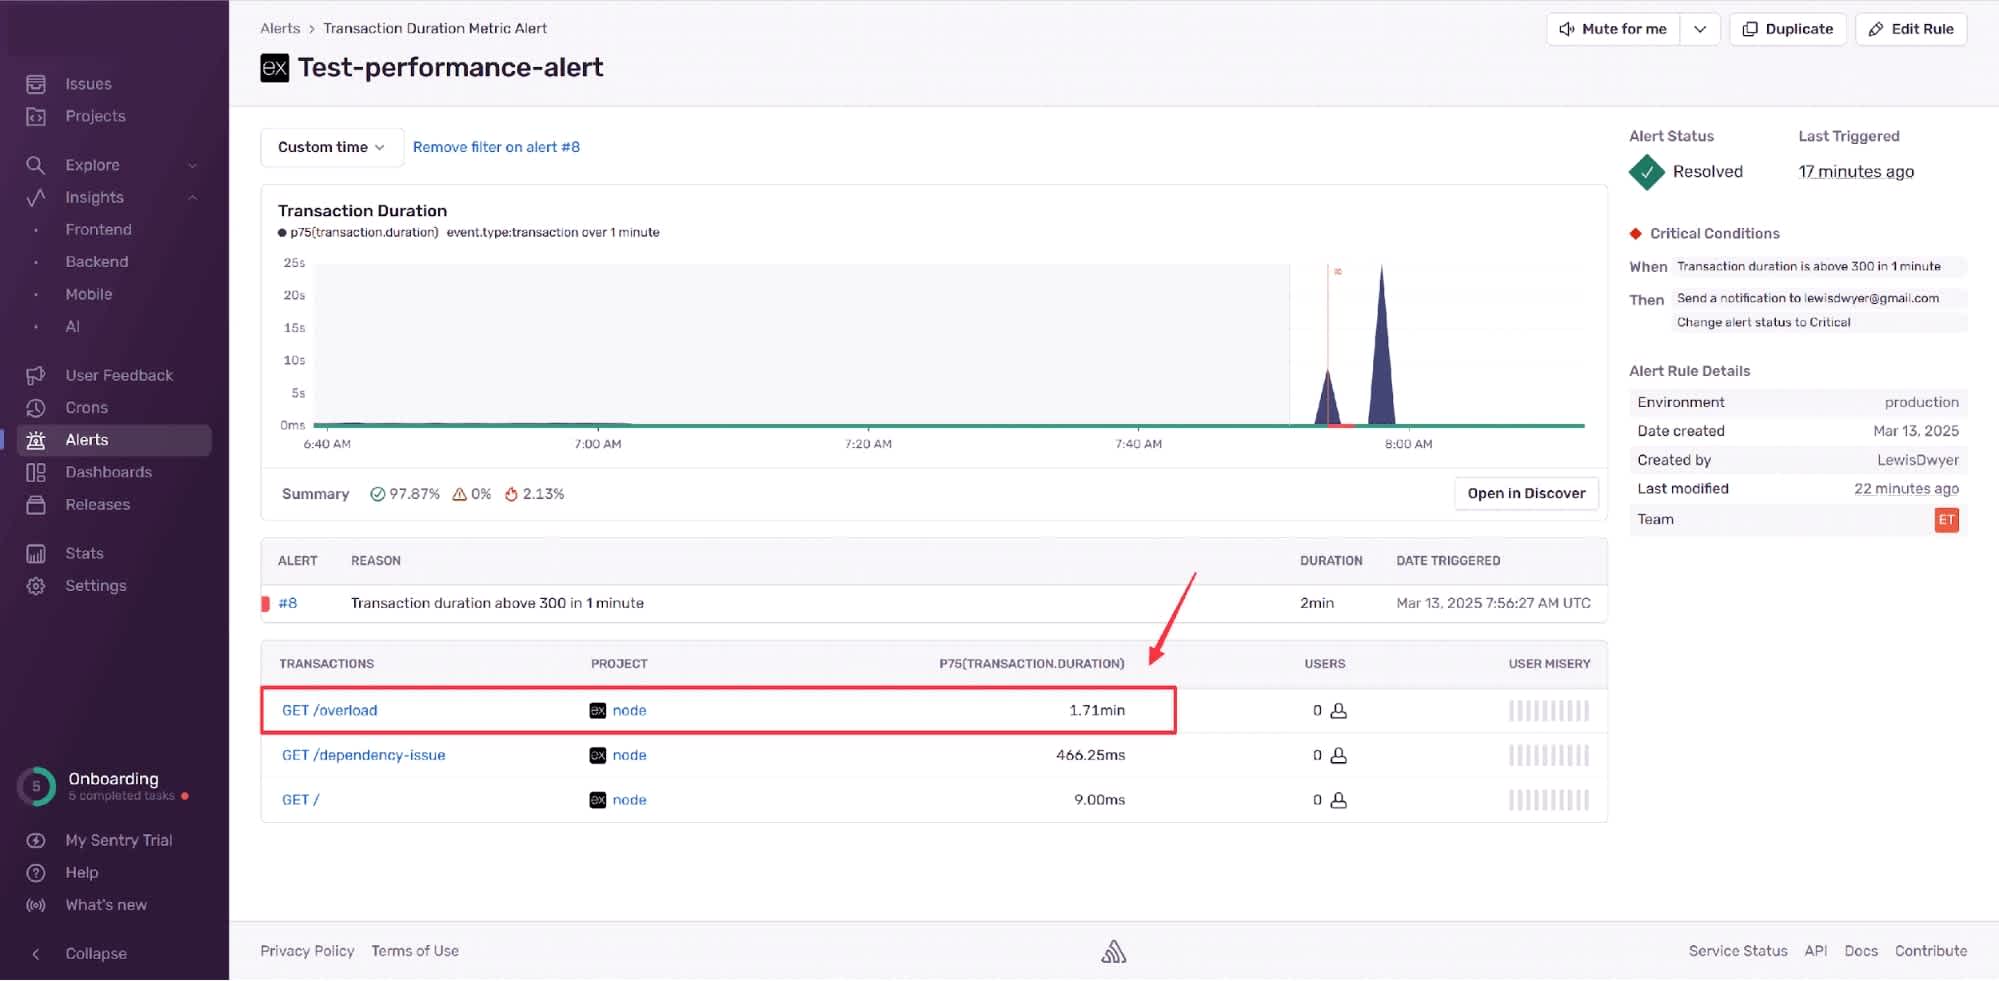
Overload performance metric
We can try to reduce the system load by adding a rate limiter to our code using the express-rate-limit package. The following rate limiter helps restrict the number of requests to the /overload endpoint to something the server can handle:
const overloadLimiter = rateLimit({
    windowMs: 1 * 60 * 1000, // 1 minute
    max: 5, // Limit each IP to 5 requests per `window`
    message: "Too many requests to the /overload endpoint, please try again later."
});

app.use("/overload", overloadLimiter);
As our app memory is the first bottleneck we face, we can also change our Fibonacci calculator to use the following iterative approach rather than our original recursive approach:
function fibonacci(n) {
    if (n <= 1) return n;

    let a = 0, b = 1, temp;

    for (let i = 2; i <= n; i++) {
        temp = a + b;
        a = b;
        b = temp;
    }

    return b;
}
By introducing iteration and a rate limiter, we should be able to stabilize our app without having to expand our resource allocation.
Detecting a bad deployment with uptime monitoring
When hardware isn’t to blame, you will often find the cause of your downtime between your desk chair and your monitor. All developers encounter human errors, and the complexity of different coding mistakes varies widely.
We found one such error while creating the example app above. When adding the rate limiter to the /overload endpoint, we forgot to include the express-rate-limit package on the remote repository used to deploy the app to the web host server. We could run the code locally without issue, but this oversight caused an error when we deployed the app to the cloud.
Without Sentry monitoring, the web host displayed a generic deployment failure message and rolled back to the previously working commit. While this was a nice recovery feature, it did not provide any information about what went wrong with the application. Thankfully, Sentry provided a detailed error message that made the issue immediately apparent, and we could redeploy the app with the appropriate packages installed.
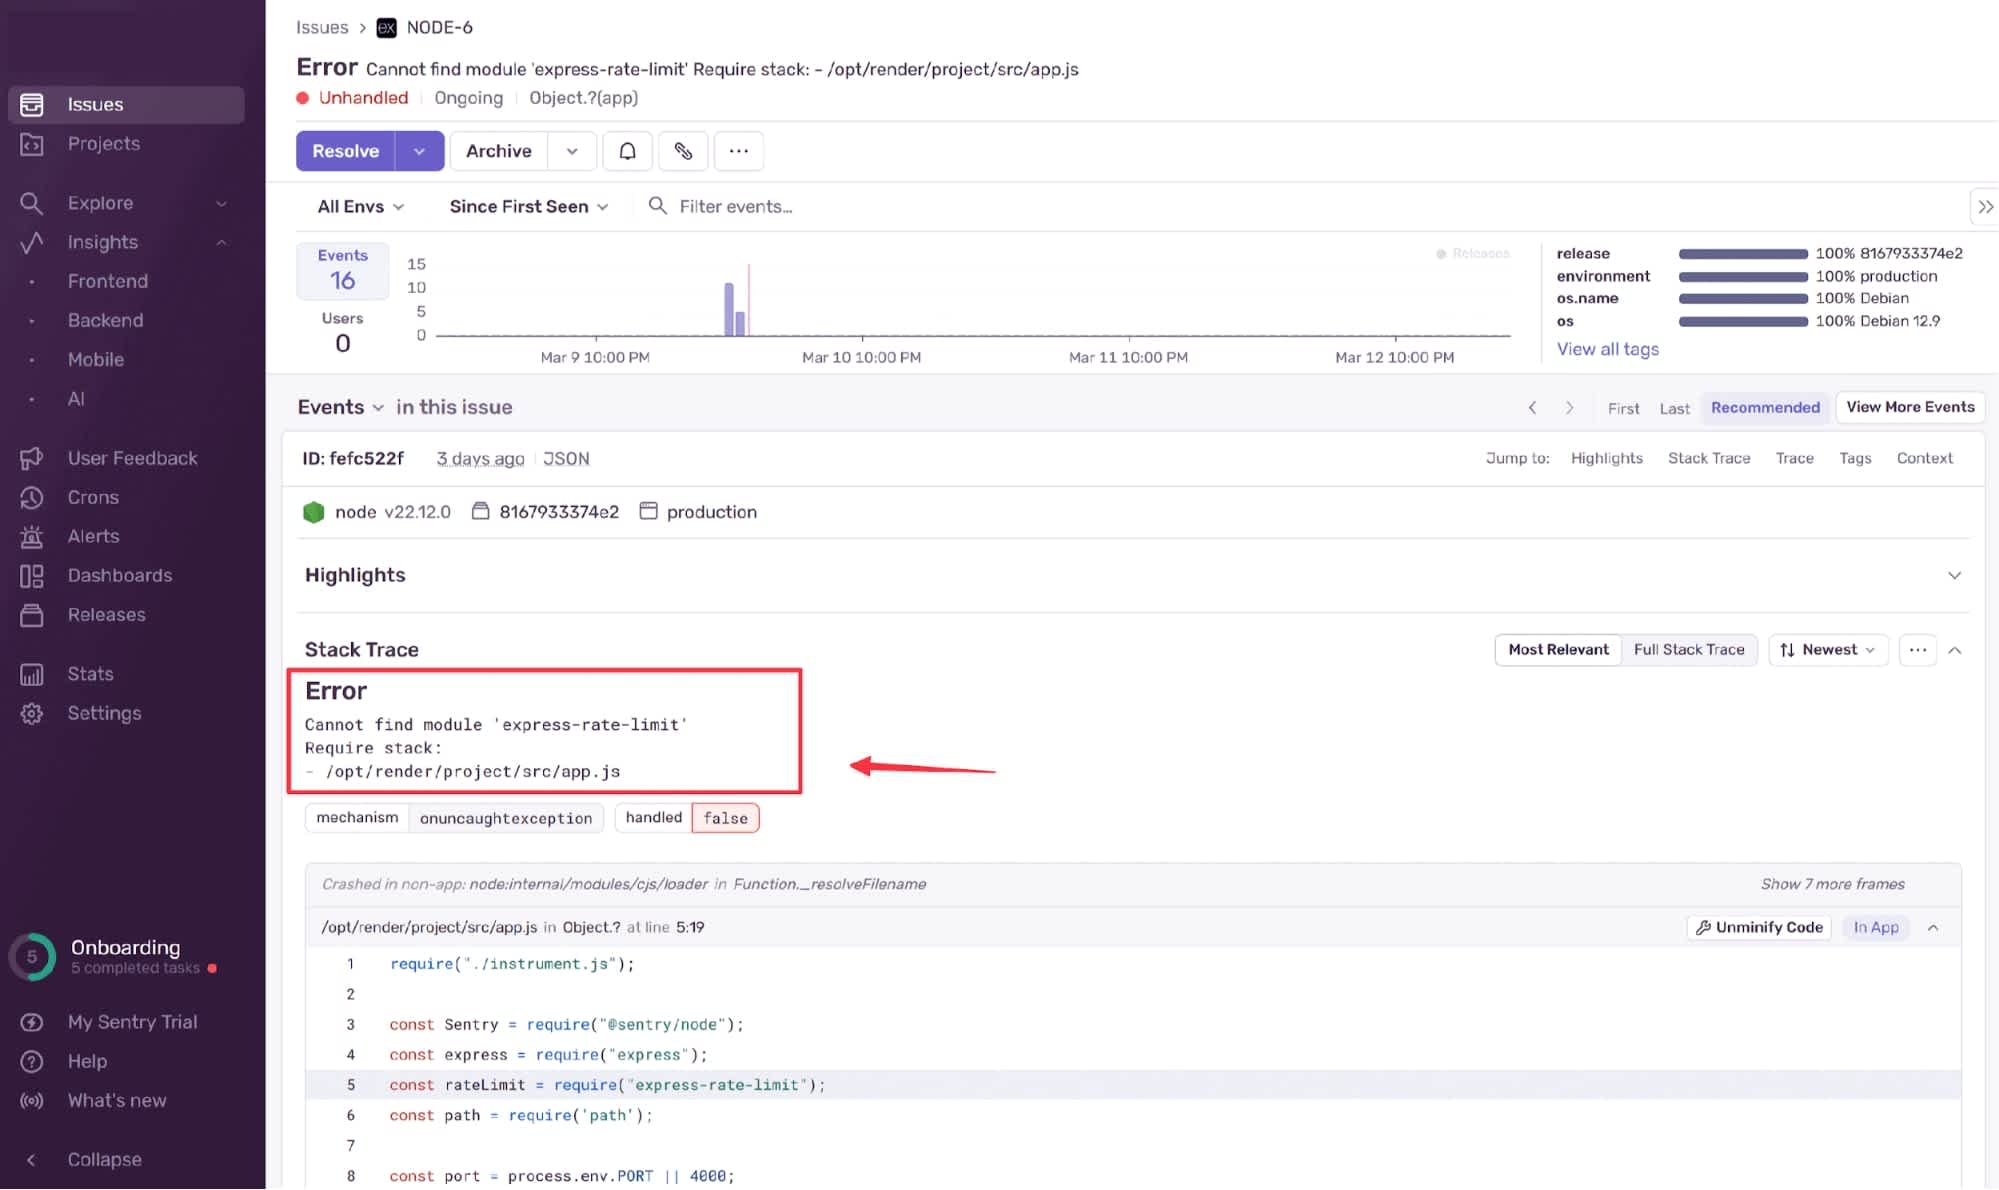
Package not found
Due to the simplicity of the example app, its coding errors are easily fixable. However, the difficulty of solutions often scales exponentially with the complexity of applications, and having monitoring tools in place becomes vital for reducing downtime.
Detecting dependency issues with uptime monitoring
Many web applications rely heavily on external services to provide their core functions. Developers often make the mistake of assuming that a service they’ve used for years will remain stable indefinitely. Unfortunately, this is not always the case, and apps can be crippled by mishandled dependencies.
To simulate this issue, we add the following /dependency-issue endpoint to our example app:
app.get('/dependency-issue', async (req, res) => {
    try {
        const response = await axios.get('https://testapp.free.beeceptor.com/my/api/path');
        res.send(response.data);
    } catch (error) {
        Sentry.captureException(error);
        res.status(500).send('Dependency issue: Third-party service is down');
    }
});
This endpoint uses the axios library to retrieve a result from a third-party service. Here, we use an API simulator as the service so that we can control the return values.
We then configure the API simulator to return a 500 error for GET requests. When we attempt to access the endpoint, we are now met with our error message:
Dependency issue: Third-party service is down
However, the rest of the app is still working fine.
Unfortunately, the uptime monitor that we configured for earlier experiments isn’t triggered for this issue because only the /dependency-issue endpoint is affected. This illustrates why we recommend you activate multiple uptime monitors for all the common endpoints of your application.
Without any monitoring, the above error is all we have to go on when debugging our application. We can add a new uptime monitor that points to the /dependency-issue endpoint, which will at least give us an early warning if the third-party API goes down again. However, to get more information about the error, we need to set up additional monitoring using Sentry’s nodeProfilingIntegration:
Sentry.init({
    dsn: "https://{DSN}",
    integrations: [
        nodeProfilingIntegration(),
    ],
    // Tracing
    tracesSampleRate: 1.0,
    profilesSampleRate: 1.0,
});
With this configured, we immediately get an issue alert when attempting to access the problematic endpoint.
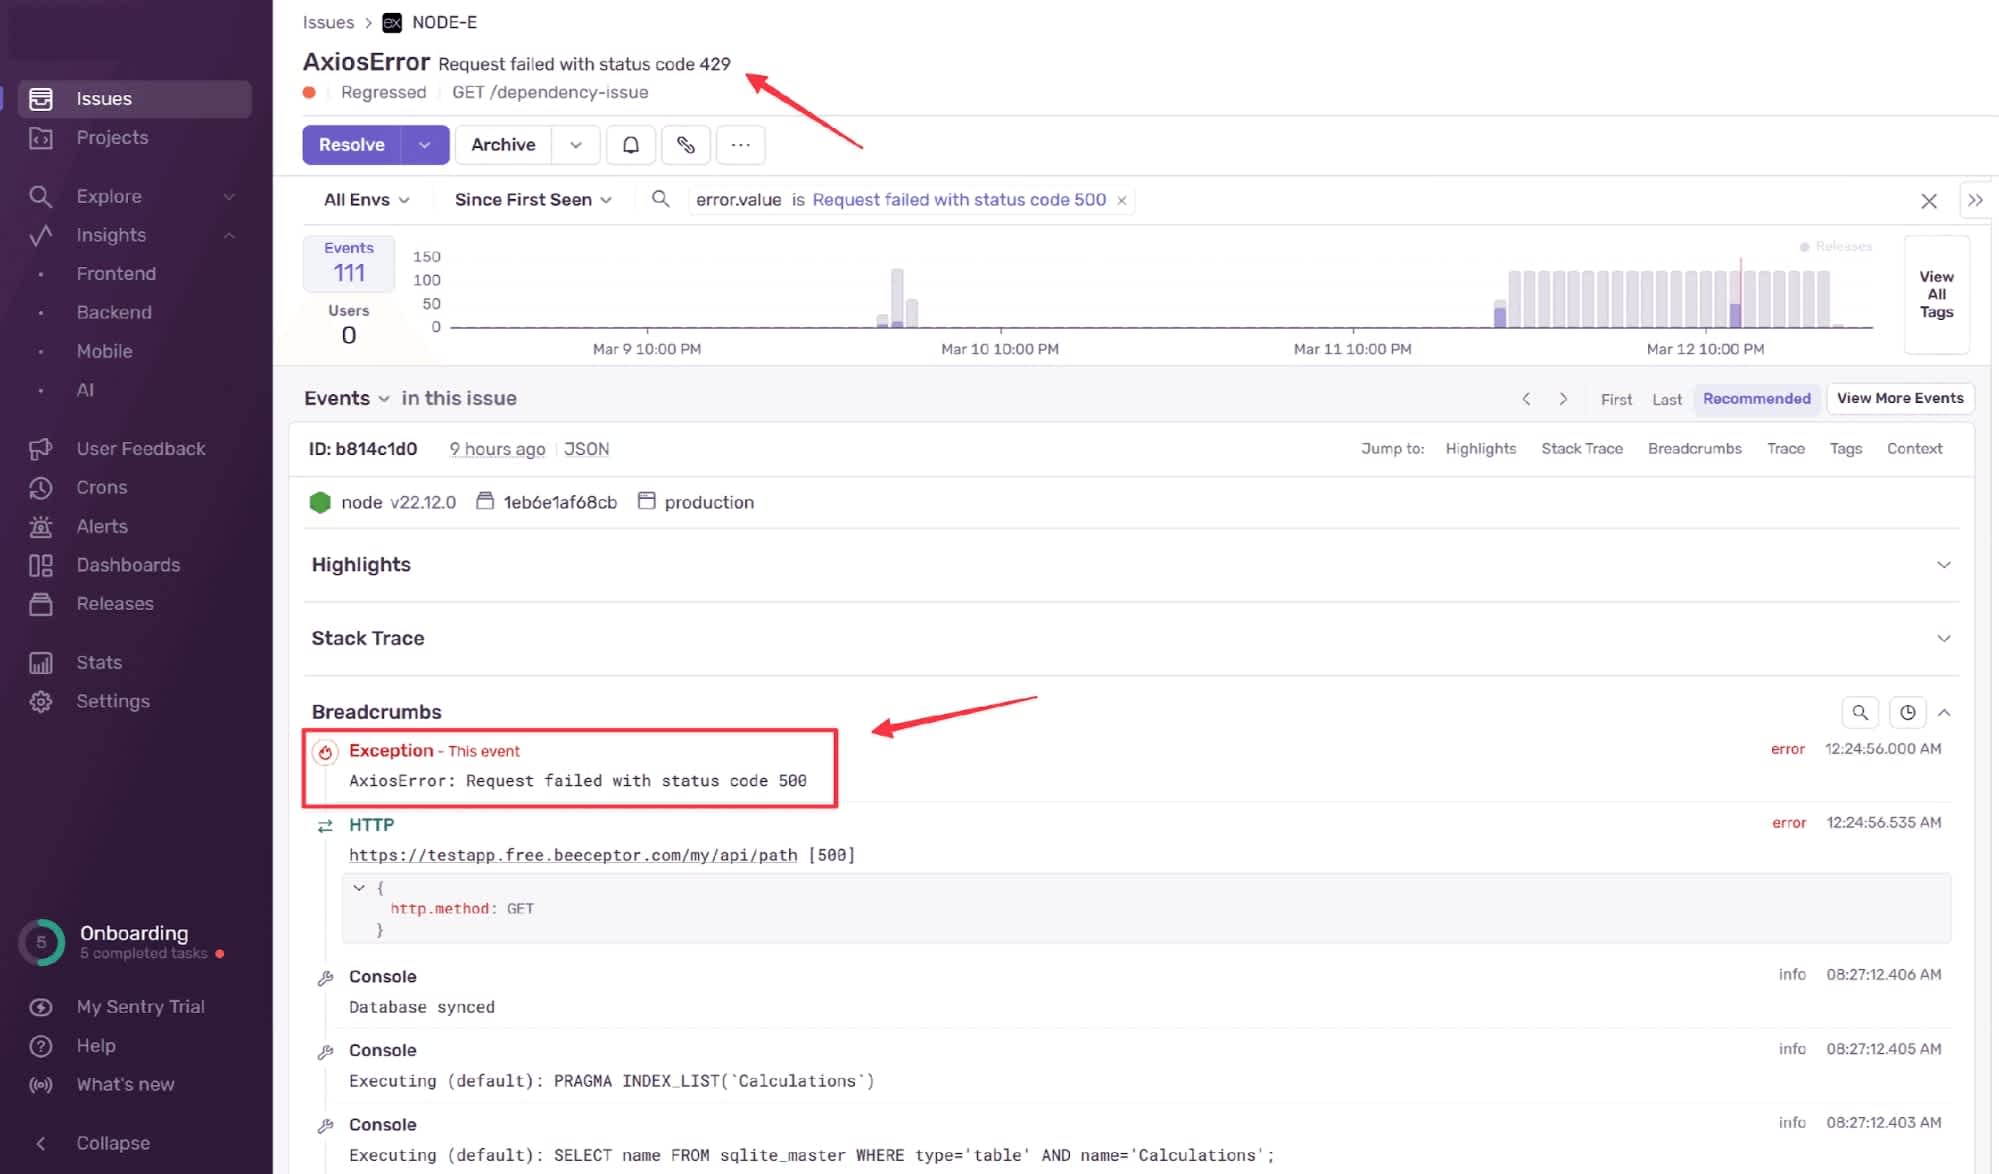
Axios Error
The eagle-eyed may notice that we also received a 429 error. This error was caused by the constant polling of our uptime monitor, which used up all the free calls to the API simulator. The uptime monitor makes very lightweight calls to the configured endpoint, so this generally isn’t an issue for real-world applications. However, it’s worth noting that uptime monitoring does leave a footprint on your application, which you need to account for.
Fixing a dependency issue is not so simple. Using third-party dependencies is inherently risky, as you are handing over control of part of your application. The reward for this is that you also hand over the responsibility of creating and maintaining that functionality. This reward often outweighs the risk, which is why many modern applications have tens, if not hundreds, of third-party dependencies. If a specific service proves unreliable for your application, you may need to consider switching to a different service provider or developing your own version of the service to regain control.
Why uptime monitoring is not enough to detect security vulnerabilities
Now for a fun one. There are cases when neither you, your hardware, nor your third-party service providers are responsible for your app’s downtime. Sometimes, for entertainment or for profit, malicious entities are determined to break something in your application.
Most often, this takes the form of a distributed denial-of-service (DDOS) attack, in which attackers flood your endpoints with bot connections and render your app useless to normal users. In practice, this looks similar to our first example of an overloaded server. While you should be able to identify whether you’re experiencing downtime due to an attack or overloading caused by normal use, the scenarios require similar solutions - namely, monitoring, load balancing, and rate limiting.
To explore a different scenario in the next example, we’ve created an app that is vulnerable to the worst type of SQL injection.
Imagine you've written the following simple calculator app:

Calculator app
However, you've decided that users should only be able to do a calculation once. To ensure that individual users don't repeat the same calculation, you store each calculator query in a MySQL database along with the IP address of the user who entered the calculation. Every time the Calculate button is pressed, the database is queried to see whether the calculation has already been performed, and if so, an error is shown to the user.
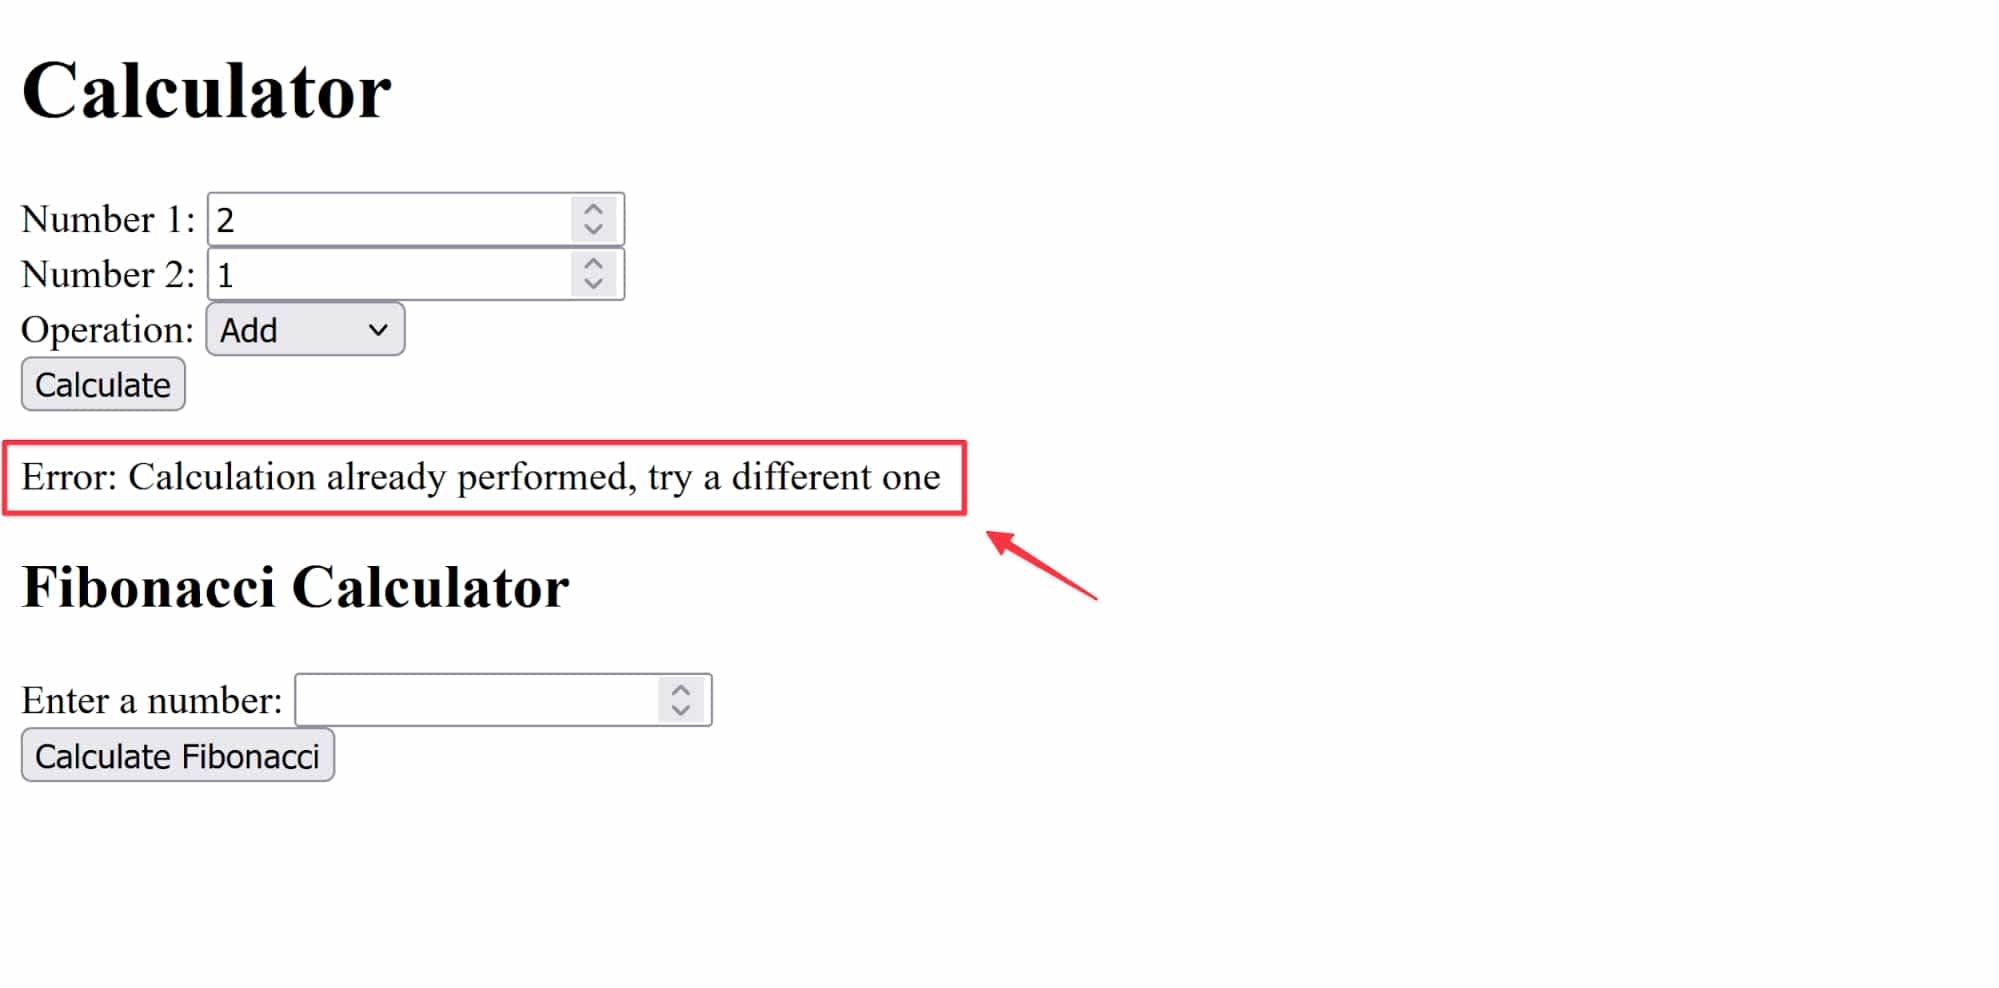
Calculator app error
When the /calculate endpoint is hit, you can use the following code to check whether the user has entered the calculation before:
app.get("/calculate", async function calculateHandler(req, res) {
    const { operation, num1, num2 } = req.query;
    const n1 = parseFloat(num1);
    const n2 = parseFloat(num2);
    let result;

    // Vulnerable query
    const query = `SELECT * FROM Calculations WHERE ipAddress = '${req.ip}' AND operation = '${operation}' AND num1 = ${n1} AND num2 = ${n2}`;

    // Check if the calculation has already been performed by the same IP
    try {
        const existingCalculation = await sequelize.query(query, {
        type: sequelize.QueryTypes.SELECT
        });

        if (existingCalculation.length > 0) {
        return res.status(400).json({ error: 'Calculation already performed, try a different one' });
        }
    } catch (error) {
        Sentry.captureException(error);
        return res.status(500).json({ error: 'Failed to check existing calculation' });
    }
// ...
Unfortunately, an attacker realizes there is a vulnerability in your code and concocts the following HTTP request:
http://MyFirstWebApp:4000/calculate?operation=add%27%3B%20DROP%20TABLE%20Calculations%3B%20--&num1=5&num2=3
On the server, this translates to the following SQL statement:
SELECT * FROM Calculations WHERE ipAddress = '42.123.321.42' AND operation = 'add'; DROP TABLE Calculations; --' AND num1 = 5 AND num2 = 3Now, when you try to do a calculation on your server, you are met with Error: Failed to check existing calculation. Luckily, you've built your calculator on our example app, which has built-in Sentry website monitoring. You get an alert informing you that disaster has struck.
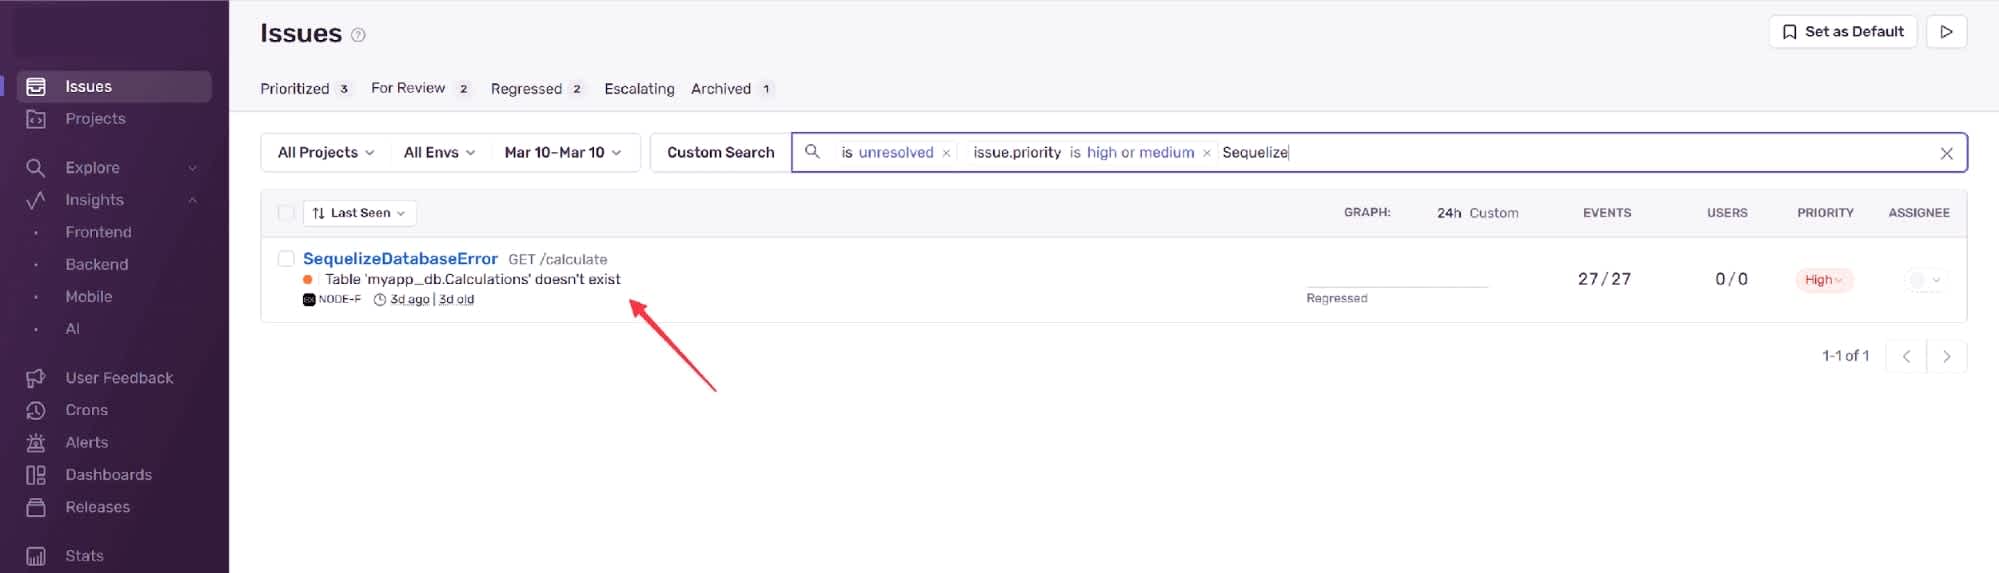
Table gone
There is no way for you to recover any of the data that was in the table, and had you been in charge of an application with actual users and valuable data, it would have been a very bad day for your developers.
One problem with this type of server downtime is that some monitoring tools, such as the uptime monitor we used previously, cannot detect when an endpoint is no longer available. As the error occurs at the database level, the endpoint still appears to be up and functioning as intended from the perspective of the web app. This is why it is important to diversify your website monitoring techniques. In this example, the additional Sentry error monitoring we put in place at least provided more information.
Depending on their severity, successful cyber-attacks can be the most difficult issue to recover from. Often, like in this case, data is non-recoverable, so it is crucial that we invest the effort to secure our applications as much as possible. For example, you could have used the following parameterized query to prevent the SQL injection technique used by the attacker:
const query = `SELECT * FROM Calculations WHERE ipAddress = ? AND operation = ? AND num1 = ? AND num2 = ?`;

try {
        const existingCalculation = await sequelize.query(query, {
        replacements: [req.ip, operation, n1, n2],
        type: sequelize.QueryTypes.SELECT
    });
// ...
Because cybersecurity is a cat-and-mouse game, and we can never know all the vulnerabilities that have yet to be exploited, it is vital that we put disaster recovery plans in place that increase in robustness relative to the importance of our applications.
Get alerted about downtime before your users do it for you
Website monitoring won’t fix your app, but it will tell you when it starts breaking—which is honestly half the battle. It buys you time. Time to dig in, time to debug, time to fix things before the support tickets start rolling in.
That said, it won’t catch everything. It's not a replacement for deeper monitoring or tracing. But paired with a broader observability practice, it’s a solid first line of defense.
If you want to see Sentry's website monitoring in practice, we’ve got more examples on the blog. Getting set up is easier than you might think, so why not try Sentry for yourself? And if you’ve kicked the tires and have feedback, drop it in GitHub or come yell at us (nicely) on Discord. We’re listening.