Continuous Performance Improvement of HTTP API
Continuous Performance Improvement of HTTP API
The following guest post addresses how to improve your services’s performance with Sentry and other application profilers for Python. Visit Specto.dev to learn more about application profiling and Sentry’s upcoming mobile application profiling offering. We’re making intentional investments in performance monitoring to make sure we give you all the context to help you solve what’s urgent faster.
For those who are new to profiling, application profilers augment performance monitoring data by capturing every single function call taking place in a given operation. As you’ll read below, profiling data can be pretty difficult to analyze on its own. When combined with Sentry’s Error and Performance Monitoring, developers get insights into not only what’s slow, but also the function calls that may be the root cause.
In my previous post, I detailed a few code tricks to improve backend performance. How did I know where to focus and what to optimize, though? Indeed, joining Cython and other low-level gizmos to the party should have solid reasoning.
I work at Athenian. Athenian offers a SaaS that helps engineering leaders build a continuous improvement software development culture. We have pretty strict performance targets dictated by the UX. It’s hard to achieve great P95 response times without proper tooling. So we’ve wrapped ourselves with high-quality apps and services:
Sentry Distributed Tracing allows us to investigate why a particular API request executed slow in production. This tool works in the Python domain.
Prodfiler gives an independent zoom into the native CPU performance, including all the shared libraries.
py-spy is an excellent low-overhead Python profiler by Ben Frederickson
Prometheus + Grafana help to monitor the immediate situation and trigger performance disaster recovery.
Google log-based metrics augment the previous toolchain by indicating an elevated frequency of important operational events.
Google Cloud SQL Insights is a must-have managed PostgreSQL performance monitor on the individual query level.
explain.tensor.ru is my favorite PostgreSQL execution plan visualizer. It offers many automated hints that are always relevant.
Today’s post illustrates the weekly routine to identify slow spots and speed up things. In particular, I will demonstrate the usefulness of Sentry traces, py-spy, and Prodfiler.
Finding the victim
We start at the performance overview page in Sentry. We check it every few days:
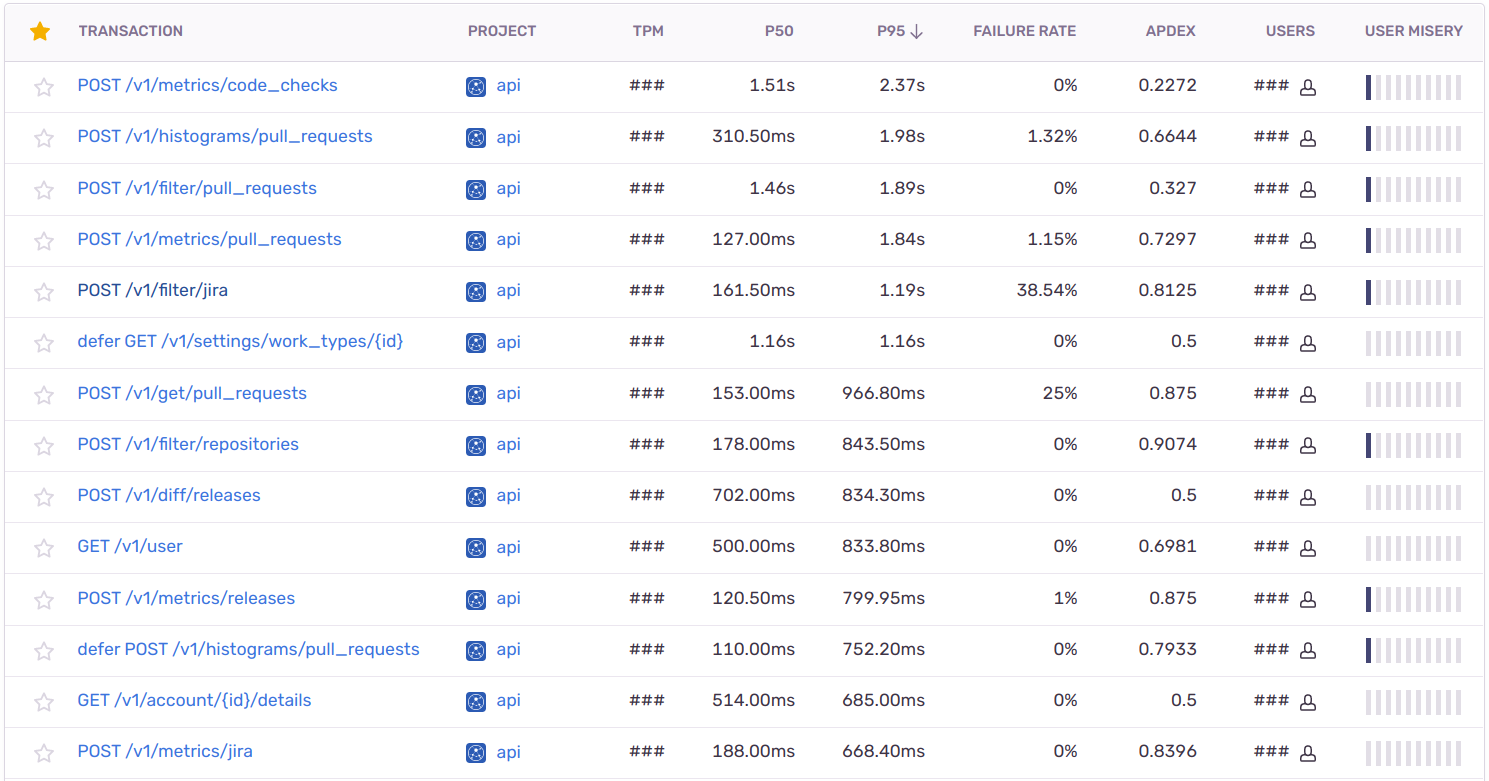
Athenian API performance overview in Sentry. Image by Author.
The table shows P50 and P95 response times for all our API endpoints and the deferred (if err != nil { , oops, that’s my muscle memory) tasks executed after serving the main request, e.g., updating the cache. Athenian API is an analytics API. It aggregates hundreds of thousands of items such as PR, release, CI run, JIRA issue metadata while typically applying tens of filters and calculating statistics and confidence intervals on the fly. Hence the average response time measures in seconds instead of milliseconds.
P50 and P95 are also visible in Prometheus / Grafana, nothing is outstanding yet. However, if we click an endpoint, for example, /metrics/code_checks, we will access more details and drill down:
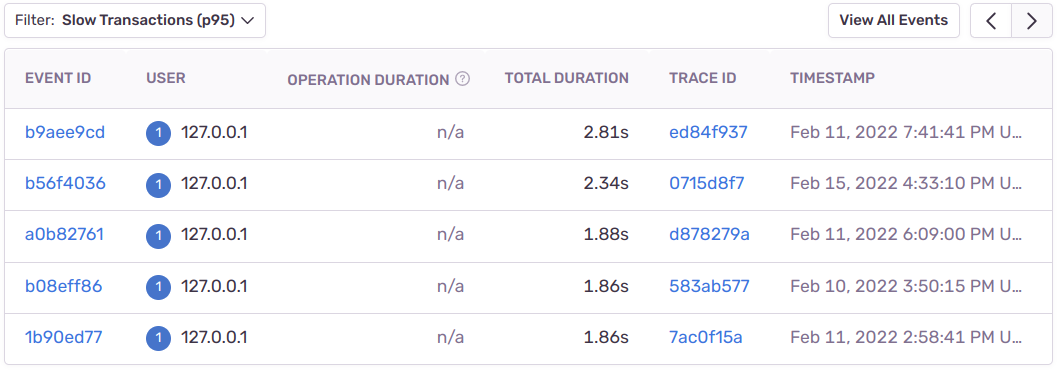
Slow runs of one of our API’s endpoints in Sentry. Image by Author.
The details table shows the analyzed traces of the chosen endpoint sorted by duration in descending order. I thank the Sentry team for changing the USER column to display user IDs instead of IP addresses by my request 👏🙇♂️.
We proceed by clicking on a suspiciously slow endpoint call and studying a profile-like structure. It becomes immediately apparent (for the code author, of course) where DB and CPU bottlenecks happened.
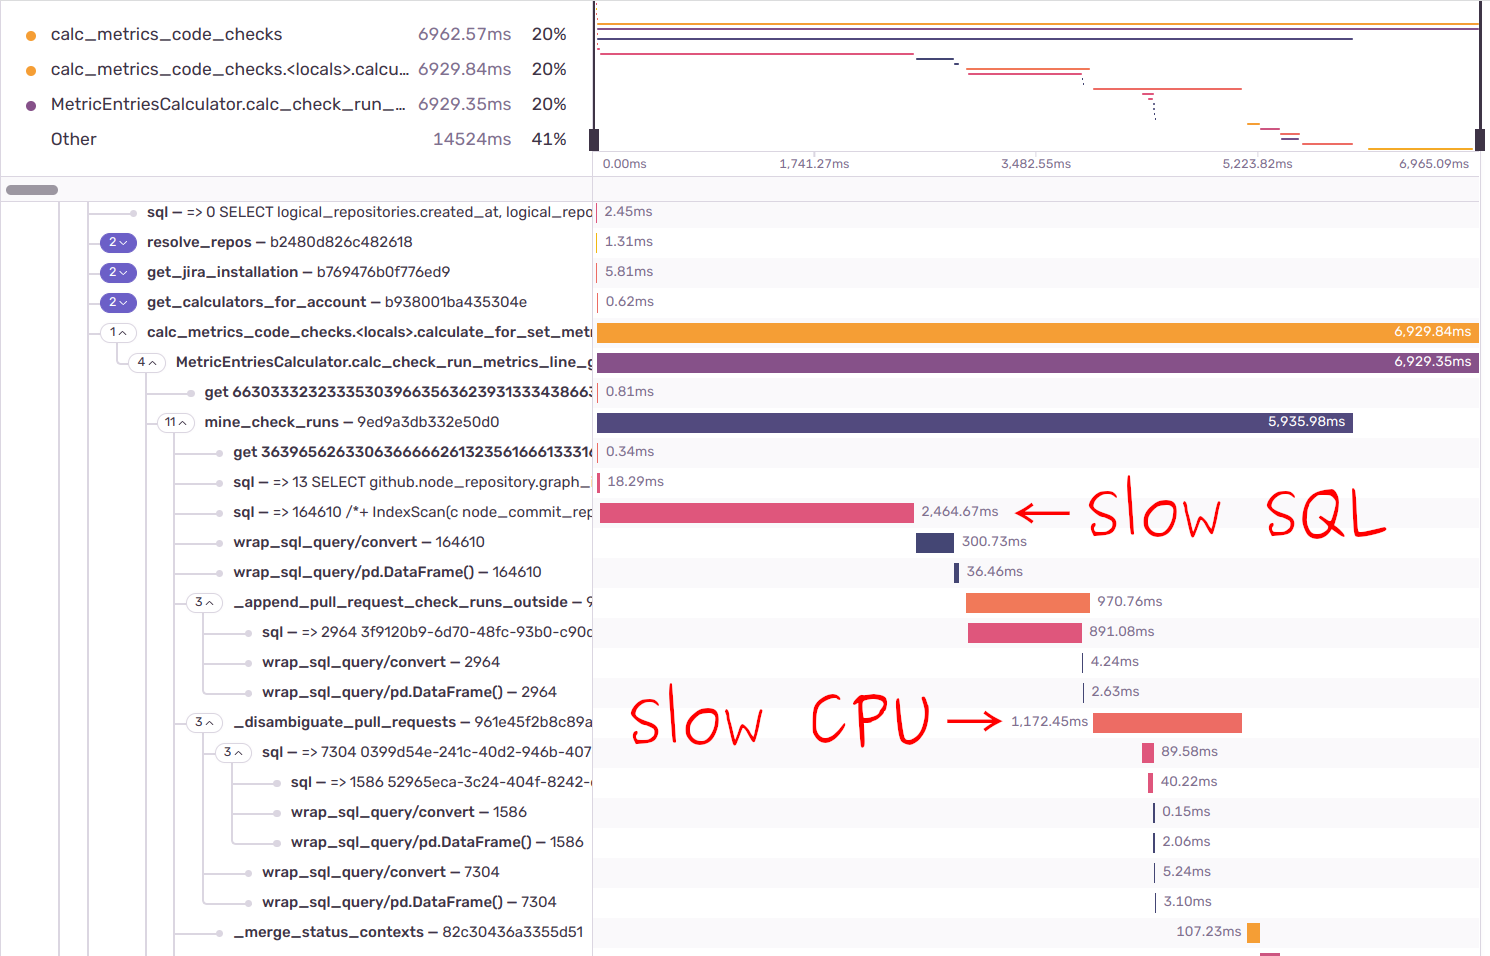
Fragment of API endpoint trace in Sentry. Image by Author.
The names in the left pane are the result of manual code instrumentation. For example, this is how we instrument the calls to mine_check_runs() function:
@sentry_span
async def mine_check_runs(...):
# endpoint logicwhere @sentry_span is a function decorator to wrap the call into Sentry span — node in the trace tree. We don’t decorate every single method we have, of course. Instead, we follow the intuition of what’s interesting to measure and what’s noise.
def sentry_span(func):
    if asyncio.iscoroutinefunction(func):
        @async_wraps(func)
        async def wrapped_async_sentry_span(*args, **kwargs):
            __tracebackhide__ = True
            with sentry_sdk.Hub(sentry_sdk.Hub.current):
                with sentry_sdk.start_span(op=func.__qualname__):
                    return await func(*args, **kwargs)

        return wrapped_async_sentry_span

    @functools.wraps(func)
    def wrapped_sync_sentry_span(*args, **kwargs):
        __tracebackhide__ = True
        with sentry_sdk.start_span(op=func.__qualname__):
            return func(*args, **kwargs)

    return wrapped_sync_sentry_span
sentry_sdk.start_span() performs the elapsed time measurement of the internals. with sentry_sdk.Hub(sentry_sdk.Hub.current) is the workaround for incomplete asyncio support in Sentry SDK. __tracebackhide__ is a magic local variable that hides the wrapper function from call stacks in pytest and Sentry.
/metrics/code_checks returns various statistics about CI runs reported to GitHub: GitHub Actions, CircleCI, Appveyor, etc. One commit may generate tens and even hundreds of CI runs, and according to the Sentry trace we loaded 164,610 of them for just two weeks of client X. Fetching CI runs from the DB requires about 10 JOIN-s; usually, it’s not a problem, and the query finishes in~500ms, but we were unfortunate. The second problem emerged in disambiguate_pull_requests() Python function. The CI runs reported to GitHub map to commits instead of pull requests. That’s how GitHub works. Consequently, if there are several PRs with the same commit, we have to determine which of the PRs triggered the CI. _disambiguate_pull_requests() applies several heuristics to solve the puzzle. We can and will precompute the function, but we haven’t yet due to a few domain-specific issues.
To cut a long story short, it’s not OK to spend one second in _disambiguate_pull_requests() and we should dig inside and optimize.
Profile, rewrite, repeat
Thanks to storing the request body in Sentry trace metadata, it’s always possible to replay locally with production DB proxied to localhost. We proceed by saving the function’s arguments on disk and preparing the macrobenchmark.
# curl --data '{...}' http://localhost:8080/v1/metrics/code_checks
async def _disambiguate_pull_requests(*args, **kwargs):
    with open("/tmp/args.pickle", "wb") as fout:
        pickle.dump((args, kwargs), fout)
    exit()
I use pytest-benchmark, a pytest plugin for benchmarking.
def test__disambiguate_pull_requests(benchmark):
    with open("/tmp/args.pickle", "rb") as fin:
        args, kwargs = pickle.load(fin)
    benchmark(_disambiguate_pull_requests, *args, **kwargs)
Execute the benchmark with pytest --benchmark-min-rounds=N where N is a tradeoff between precision and benchmark time. N should be big enough to bound round fluctuations to the target level. I usually aim at somewhere between 0.5% and 2% ratio to the average.

Sample benchmark run. Image by Author.
We have set up the macrobenchmark and now enter the profile-optimize cycle:
Gather the profile of the current code.
Analyze the profile: what are the bottlenecks? Did the last changes help?
Stop if you either see an evenly flat profile or struggle with optimizing further.
Formulate optimization hypothesis and rewrite the code accordingly.
Go to step 1.
I am a fan of gathering the profile with py-spy. It’s a sampling profiler for Python: it reads the memory dump of the process with some configurable frequency and recognizes and walks the thread stacks. The overhead grows naturally as the sampling frequency increases, and there is always a tradeoff. I usually set 500 Hz for decent results.
py-spy record -r 500 -o profile.ss -f speedscope -- pytest ...
py-spy can output files in speedscope flamegraph-like format. I like speedscope for the “Left Heavy” view, and it’s ideal for investigating repetitive benchmark iterations.
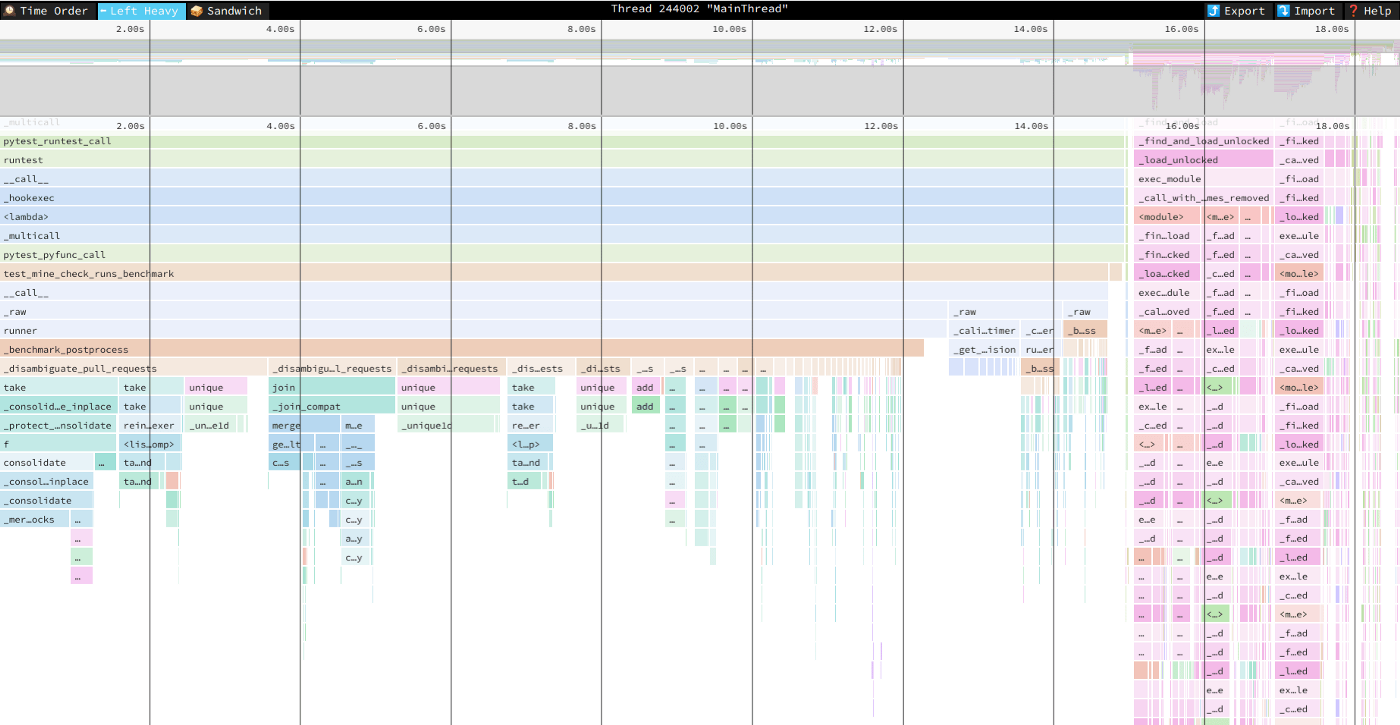
Profile gathered by py-spy and visualized in Speedscope, iteration 0. Image by Author.
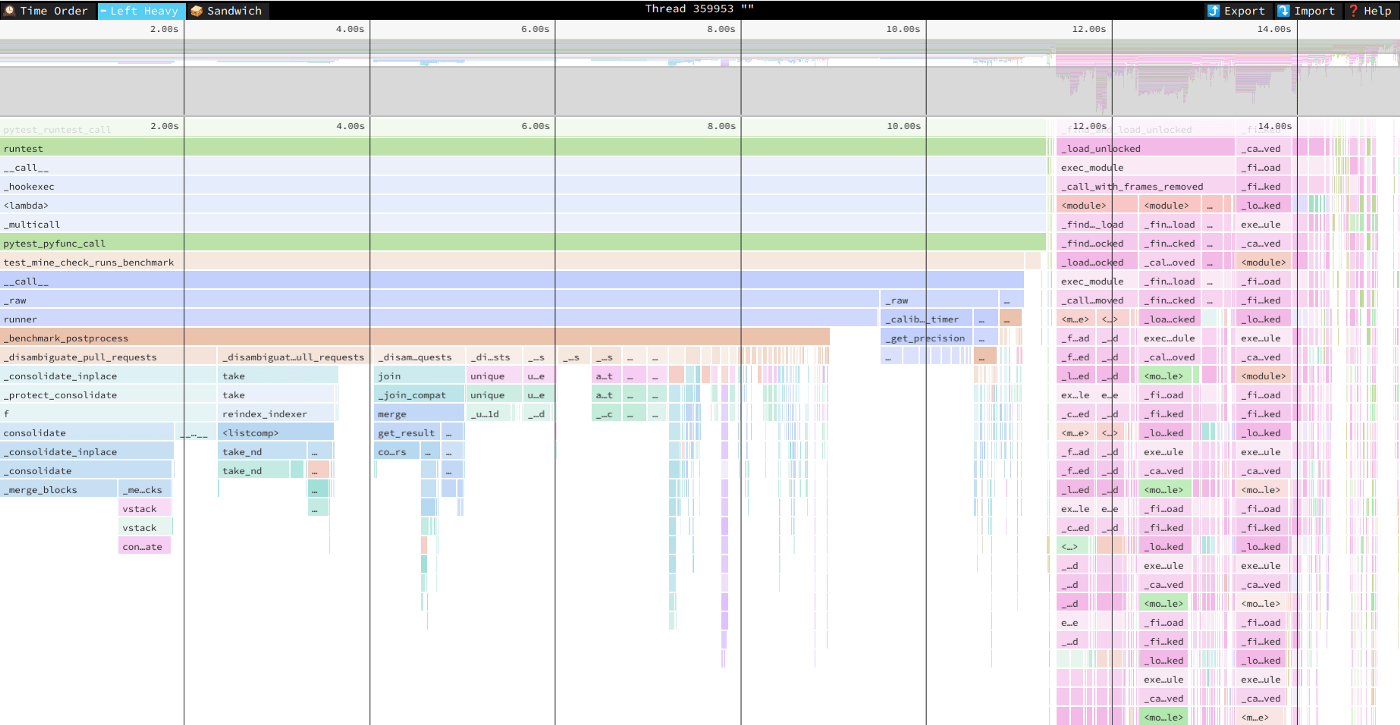
It usually takes around ten profile-optimize loop iterations to hit a wall and stop. The upper two images were speedscope profiles when I began optimizing and at the 6th iteration. We see that the unrelated pink flames on the right have become wider, while some flames on the left disappeared — that’s good.
Alas, macrobenchmarks inherit some of the microbenchmark problems, particularly the dependency on the context. And, of course, the best solution for the performance problems is changing the algorithm instead of bypassing another pandas consolidation. I recommend everyone to watch “Design for Performance” talk by Fedor Pikus. Don’t mind C++ because the presented concepts are universally applicable.
Monitoring assumptions
Regarding the dependency on the context. We have optimized _disambiguate_pull_requests() for one particular client. How can we be sure that we don’t have a performance regression for some other client? What’s the overall impact instead of reduced P95? Prodfiler comes on the scene.
Many have heard about eBPF — arguably the greatest Linux kernel technology since cgroups. We’ve got a kernel virtual machine with JIT, and it can execute lightweight programs in runtime. eBPF can sample Python call stack similarly to py-spy but with less overhead and generalized to other languages. Prodfiler is a SaaS that aggregates traces from eBPF-driven agents. An agent is a shadow Kubernetes pod with full access to the node.
The following flamegraph in Prodfiler shows how _disambiguate_pull_requests() performed in our production over one day. The longer the aggregated period is, the more samples Profiler collects, and the better the precision becomes.
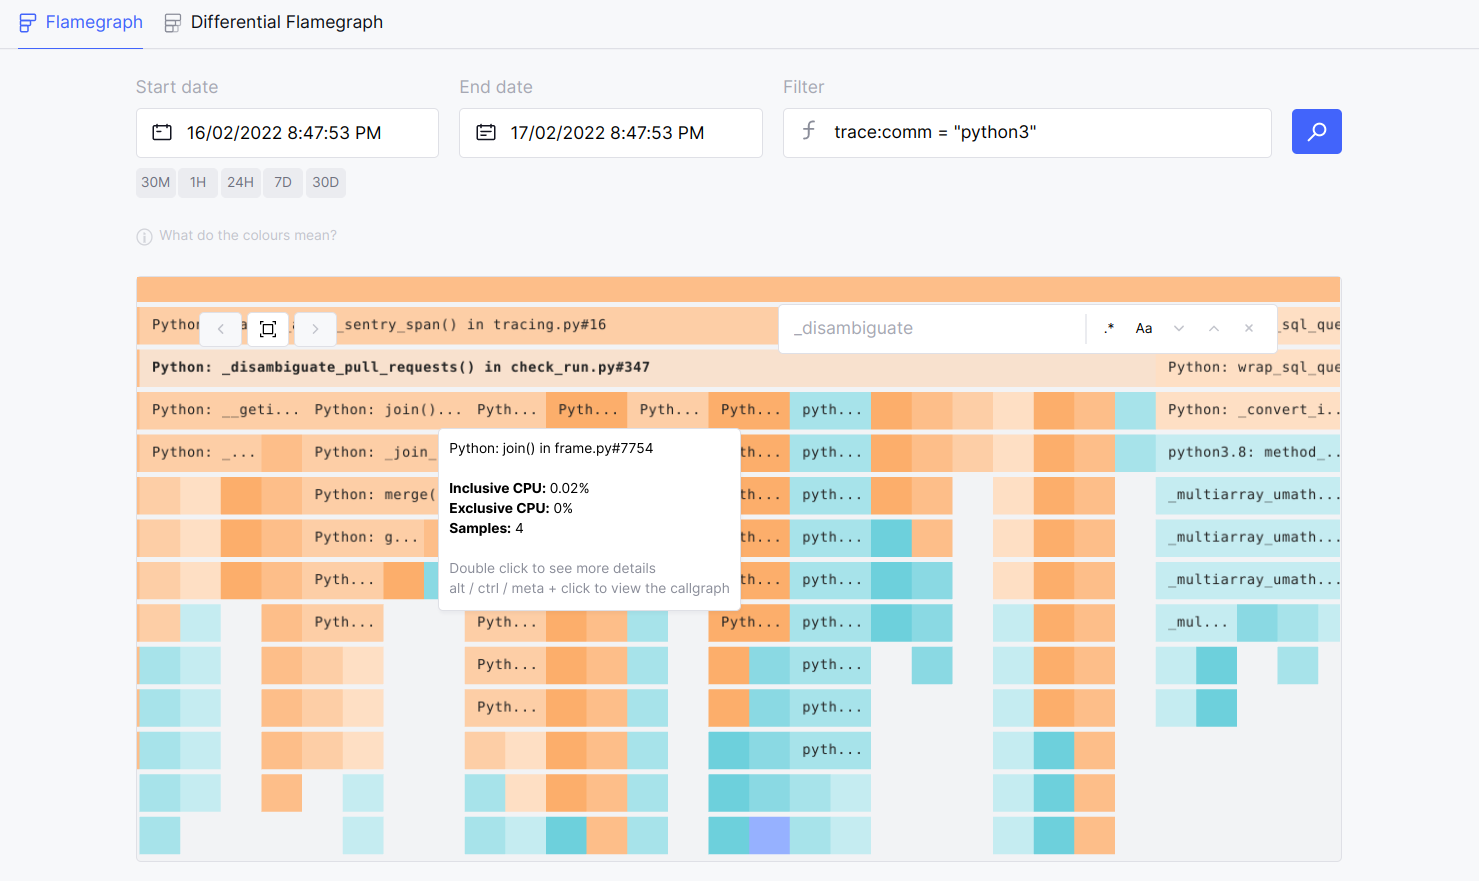
Fine-grained insight into the function’s performance in Prodfiler. Image by Author.
There are a few caveats:
We compile CPython with some extra optimizations compared to the standard OS package. Hence we have to submit debug symbols to Prodfiler in our CI/CD.
asynciois not supported, so there are no coroutine stack traces.Compared to manual Sentry-like instrumentation, it’s impossible to measure logical parts of a function.
Overall, Prodfiler has proved to be a great tool to validate performance optimizations. As a bonus, it seamlessly decomposes the flames down to specific kernel functions, which py-spy cannot do.
Summary
I have described how we identify slow CPU spots in the backend, profile them, and monitor the optimizations. We have used:
py-spy.
Prodfiler.
The next post should cover how we wrestle with PostgreSQL performance, so stay tuned and please follow the author. Oh, and if the product we’re building sounds like something your engineering org needs, check out our website.


