Custom Performance Metrics: Tips from Etsy’s Performance Team
Custom Performance Metrics: Tips from Etsy’s Performance Team
Geoff Graham is a frontend engineer, designer, and teacher. He is also a writer and editor for Smashing Magazine and often consults with companies on web strategies and best practices. Geoff guest authored this article, based on Terry O’Shea’s recent talk at Smashing Meets Performance.
Terry O’Shea is a senior engineer on Etsy’s performance team and leads a regular web performance meetup in New York when she isn’t winning Jeopardy! She recently gave a talk at the semi-monthly Smashing Meets event, focused solely on measuring performance.
There’s nothing inherently wrong with using Core Web Vital metrics as a yardstick against which to measure your site’s performance. Knowing which element represents the Largest Contentful Paint (LCP) or what’s most responsible for Cumulative Layout Shift (CLS) is nothing short of useful. These and other Core Web Vitals provide crucial context to diagnose and ultimately address any performance concerns.
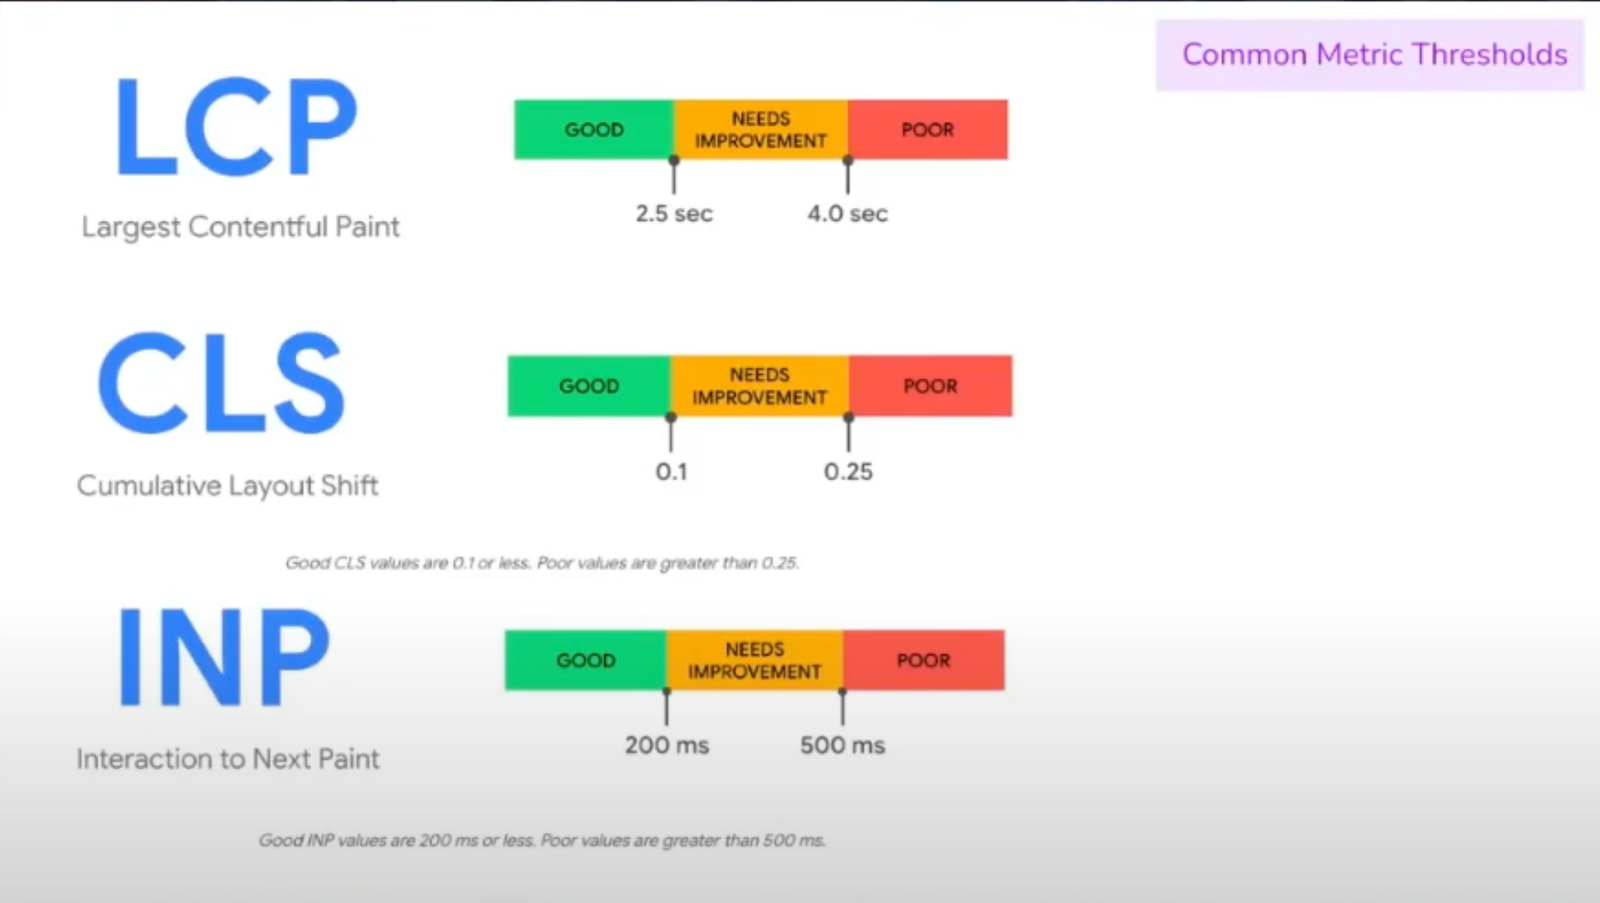
Showing scoring thresholds for three Web Core Vital metrics, LCP, CLS, and interaction to next paint.
But that doesn’t mean that Core Web Vitals are a silver bullet for measuring All Things Performance™ — they’re more like a one-size-fits-all garment that generally works everywhere. There’s a point at which something — anything — becomes less custom-tailored to your specific needs as it becomes more and more uniform.
Terry O’Shea, senior engineer on Etsy’s performance team, recently challenged us to think beyond the common metrics we use to measure performance, which are often baked into widely available tools such as DevTools, Lighthouse, and WebPageTest. You’ve probably read a bunch about those already with the deluge of materials on Core Web Vitals. But we also have additional developer resources we can use to get timely, relevant, and actionable performance data tailored to your specific site.
So, what’s wrong with using Lighthouse?
Nothing! But if you want to get more into the weeds and truly understand the factors contributing to the scores you get in Lighthouse, DevTools, WebPageTest, etc., there are some limitations to these tools to be aware of.
But general Core Web Vitals might fall short when it comes to reporting the “best” information.
Core Web Vitals are too general and opaque
While the metrics are useful, they are also based on certain assumptions that may or may not be relevant to your needs, making the insights you glean from them less than clear.
Core Web Vitals ill-suited for Single-Page Apps (SPA)
When evaluating Core Web Vitals, you need to first understand the difference between “hard” and “soft” navigations, and how each navigation type influences the numbers. Soft navigations are influenced by caching, which means we get fewer performance details compared to the relatively richer picture we get with hard navigation.
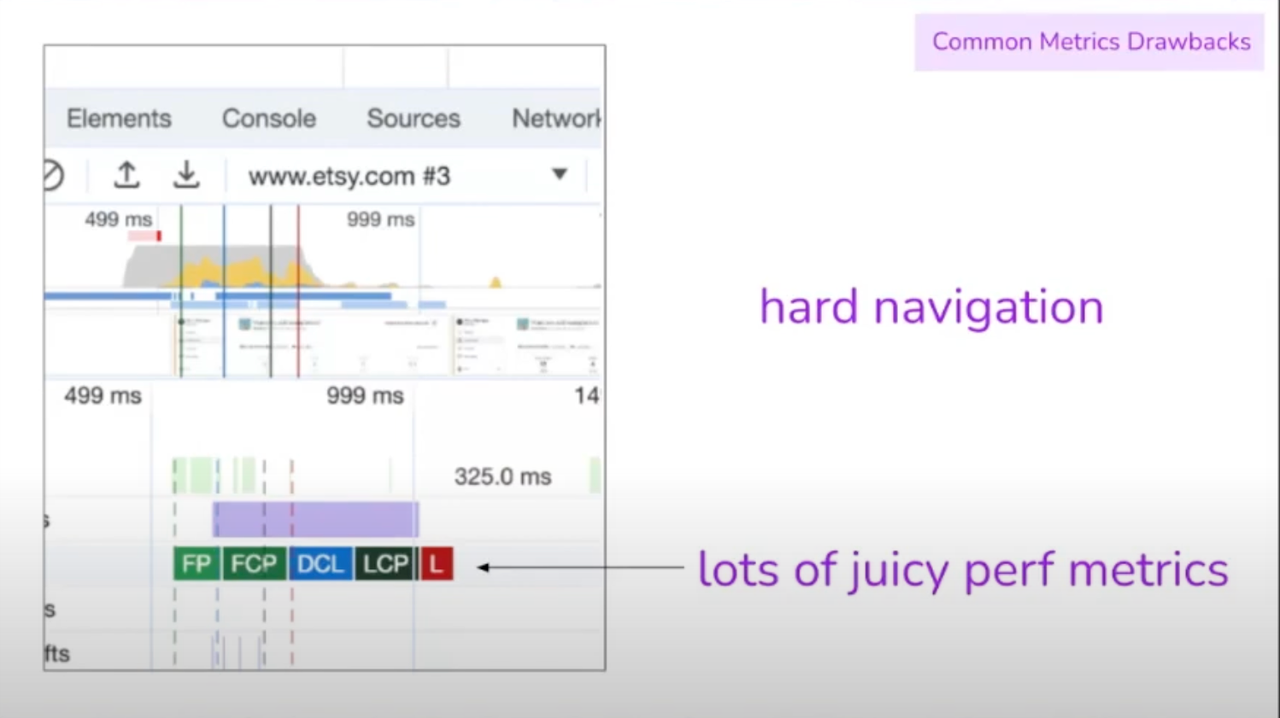
DevTools timeline showing core web vitals information for a hard navigation.
I knew caching had something to do with measuring performance, but seeing the picture this way opened my eyes to just how different the datasets are and why it’s a limitation of the common tools we use. That’s a big deal for SPAs since there is technically no reload or refresh happening, but rather reactive views that update based on user input. Reporting is going to look a lot like the soft navigation side of things in this context.
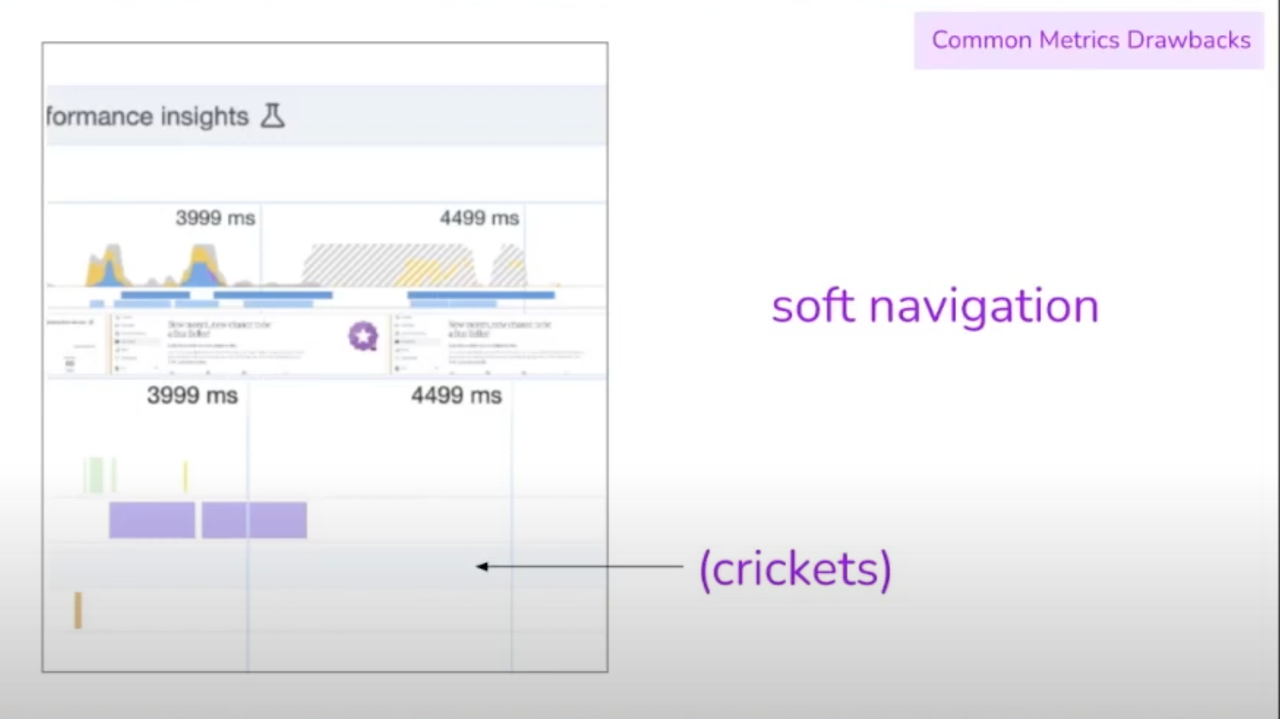
DevTools timeline showing core web vitals information for soft navigation.
Core Web Vitals require technical knowledge to understand
You may get blank looks from a manager or client when you excitedly tell them you know exactly what’s causing all that cumulative layout shifting on the homepage. Have you tried explaining CLS or any other core web vital to a friend who isn’t in web development? It’s tough.
What would be better is a report of metrics that don’t require a high degree of technical proficiency.
Hello, Performance API
So you might be convinced that performance goes beyond Core Web Vitals, but now you need to figure out how the Performance API can be used to not only get more specific details about your site but also how they can be used to create custom dashboards that tally and visualize results, even over time.
I’ll summarize the parts of the API that Terry recommends you prioritize.
Element Timing API
We can be in total control, measuring what we believe are the most important elements on a page. Rather than reporting on every single image, icon, stylesheet, or block of text, the PerformanceElementTiming interface, more colloquially called the Event Timing API, allows us to tag which items we specifically want to measure.
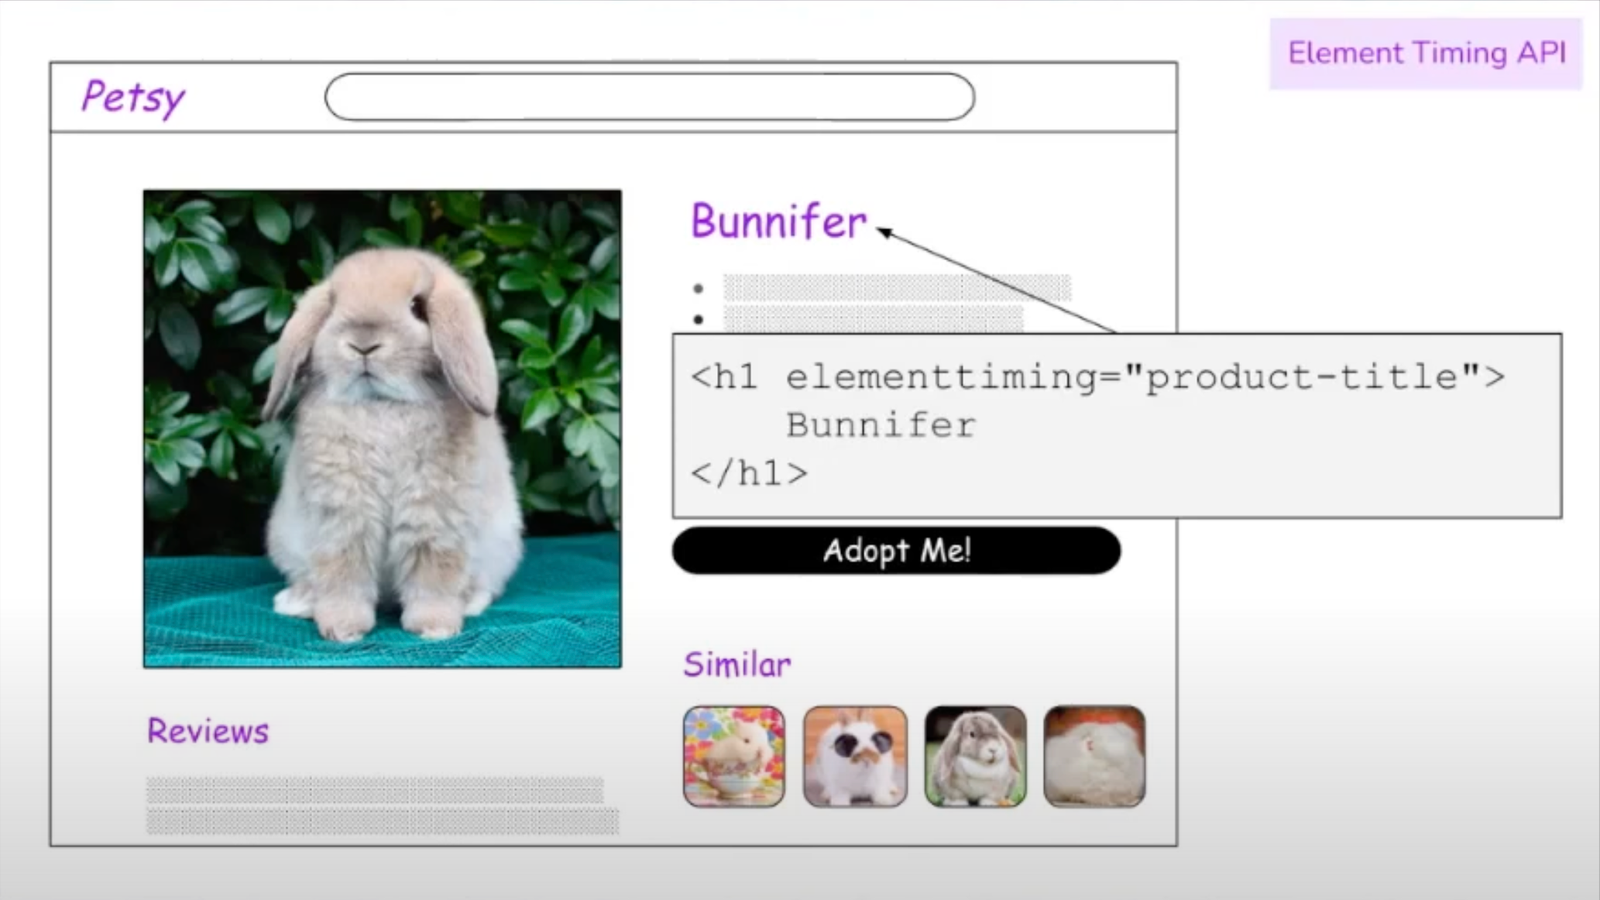
Webpage mockup of a product page for a pet bunny showing the main heading tagged for measuring element timing.
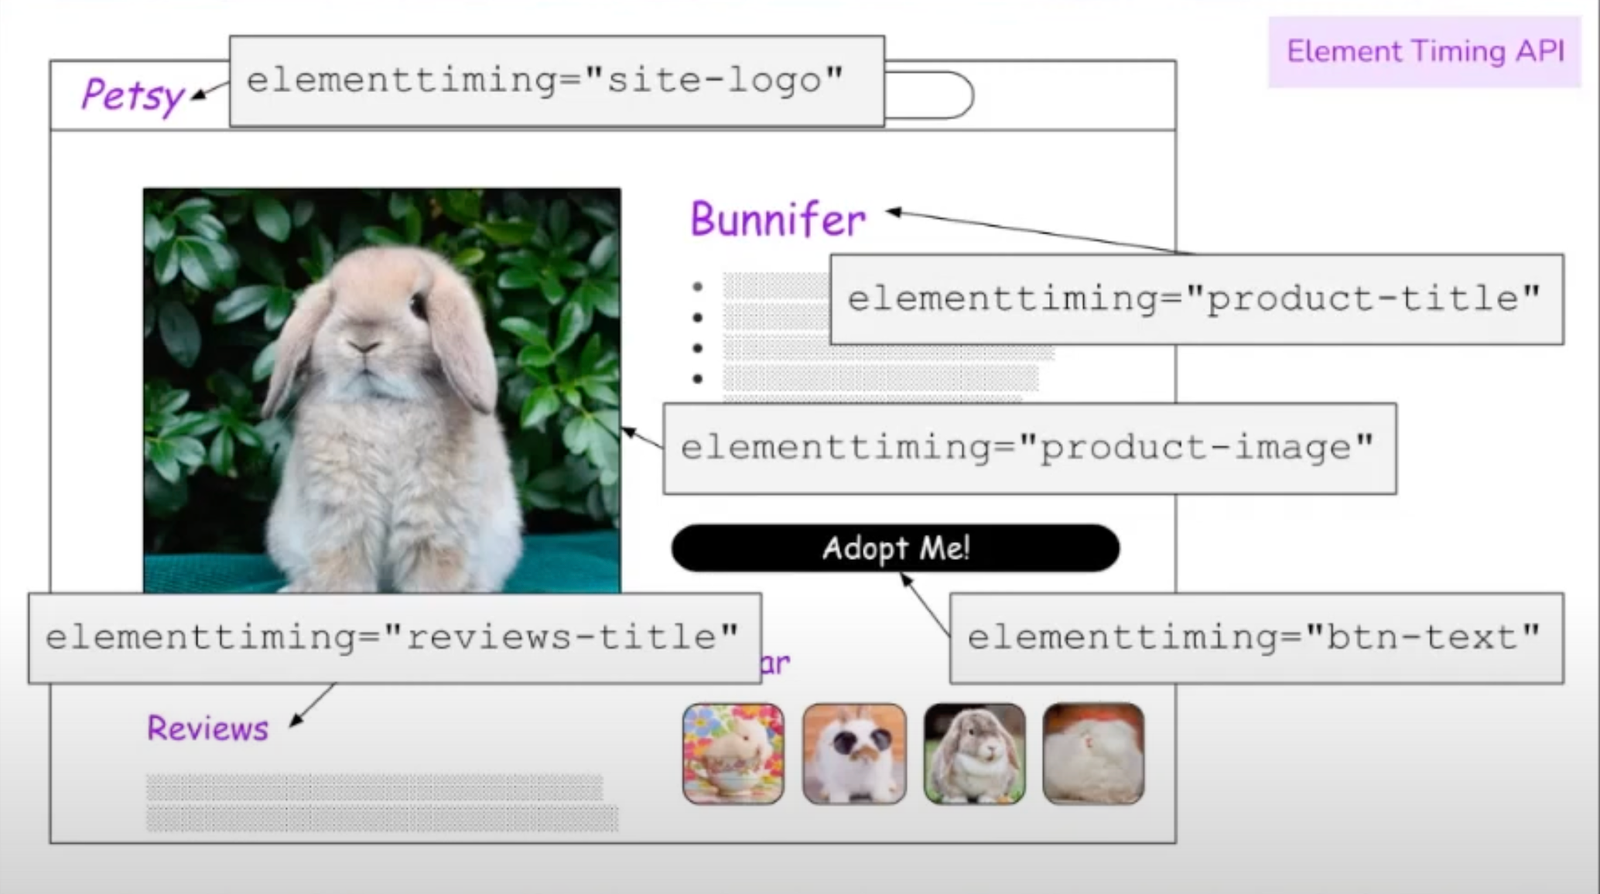
Same bunny product page showing five elements tagged for measuring element timing.
We can take that as far as we want.
From there, all it takes is a snippet of JavaScript to pull down that information and print it to the console.
performanceMetrics.js
new PerformanceObserver((list) => {
list.getEntries().forEach((e) => {
console.log(`${e.identifier}:${e.loadTime} ms`);
});
}).observe({type: "element", buffered: true});
/**
* prints:
*
* product-image: 354.9 ms
* product-title: 299.6 ms
*/User Timing API
The User Timing API can be used to slap timestamps on elements that mark when they become interactive. Essentially, it involves attaching a performance.mark to label elements and marking the times they load.
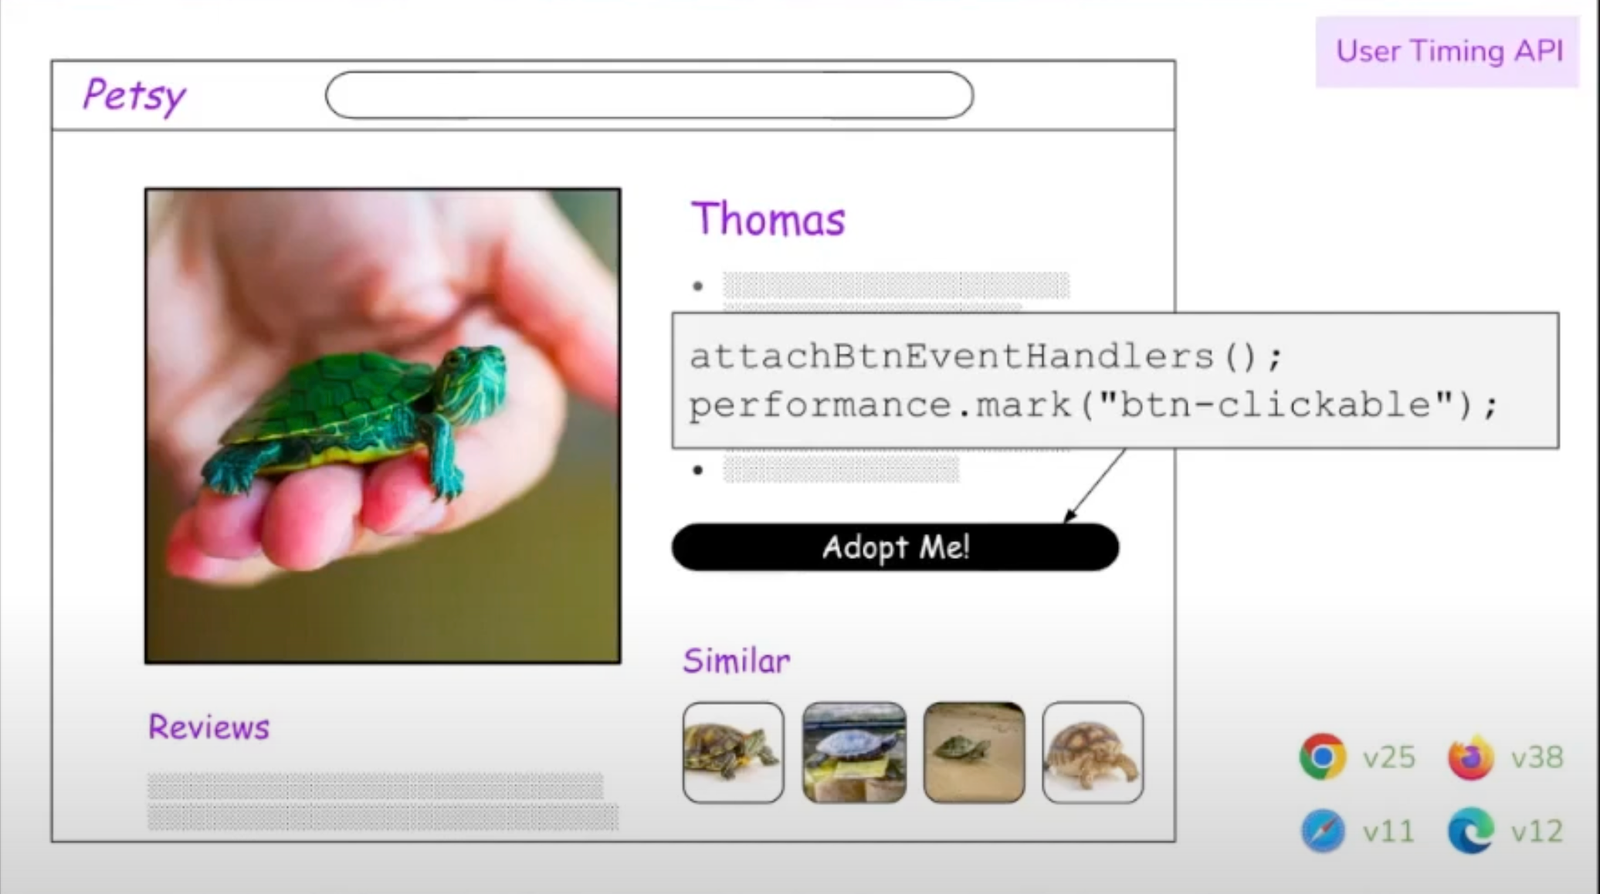
The “Adopt Me” button is now marked with an event for when it becomes “clickable.”
More than that, we can measure how that marked element responds to user input, comparing the time it loads to the time it becomes clickable to see what sort of lag a user may be experiencing.
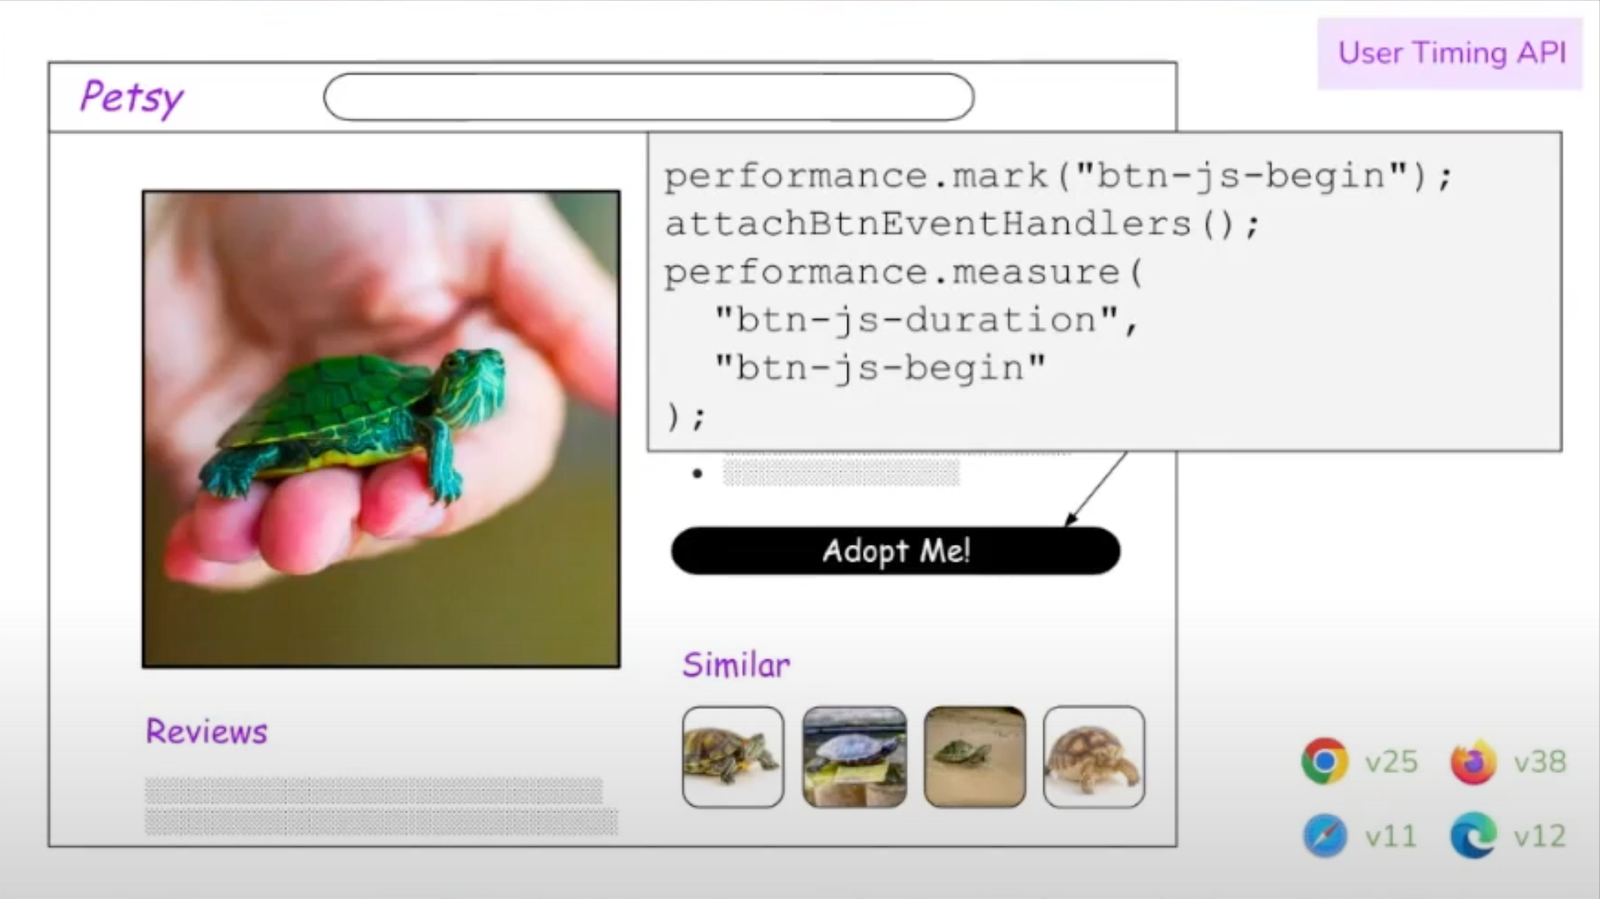
Same turtle product page showing the same button tagged for when it loads and when it becomes interactive. Showing how to mark the same element with two points in time to calculate the interval.
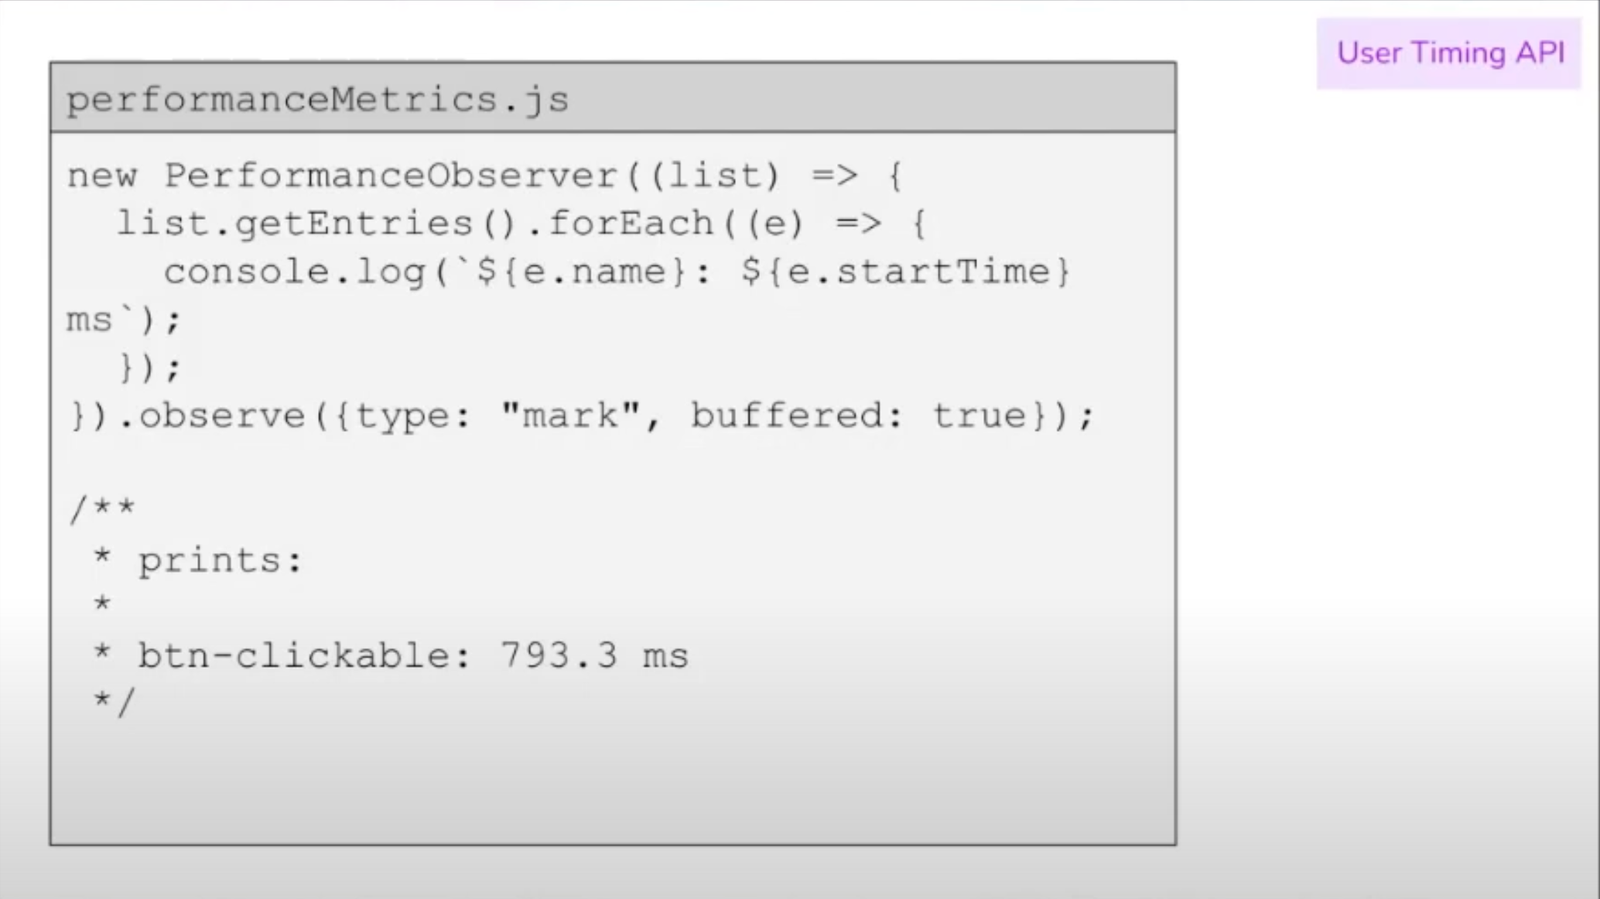
This snippet fetches a list of tagged elements and prints them to the console, including the names and start times of the elements as they are “marked” for measurement.
Resource Timing API
Any time we discuss performance, you’ll likely want to know what resources the site is loading and how long they take to process. We saw this with the Element Timing API, but the Resource Timing API is useful for measuring the things the page needs to render—things like CSS, JavaScript, fonts, and images.
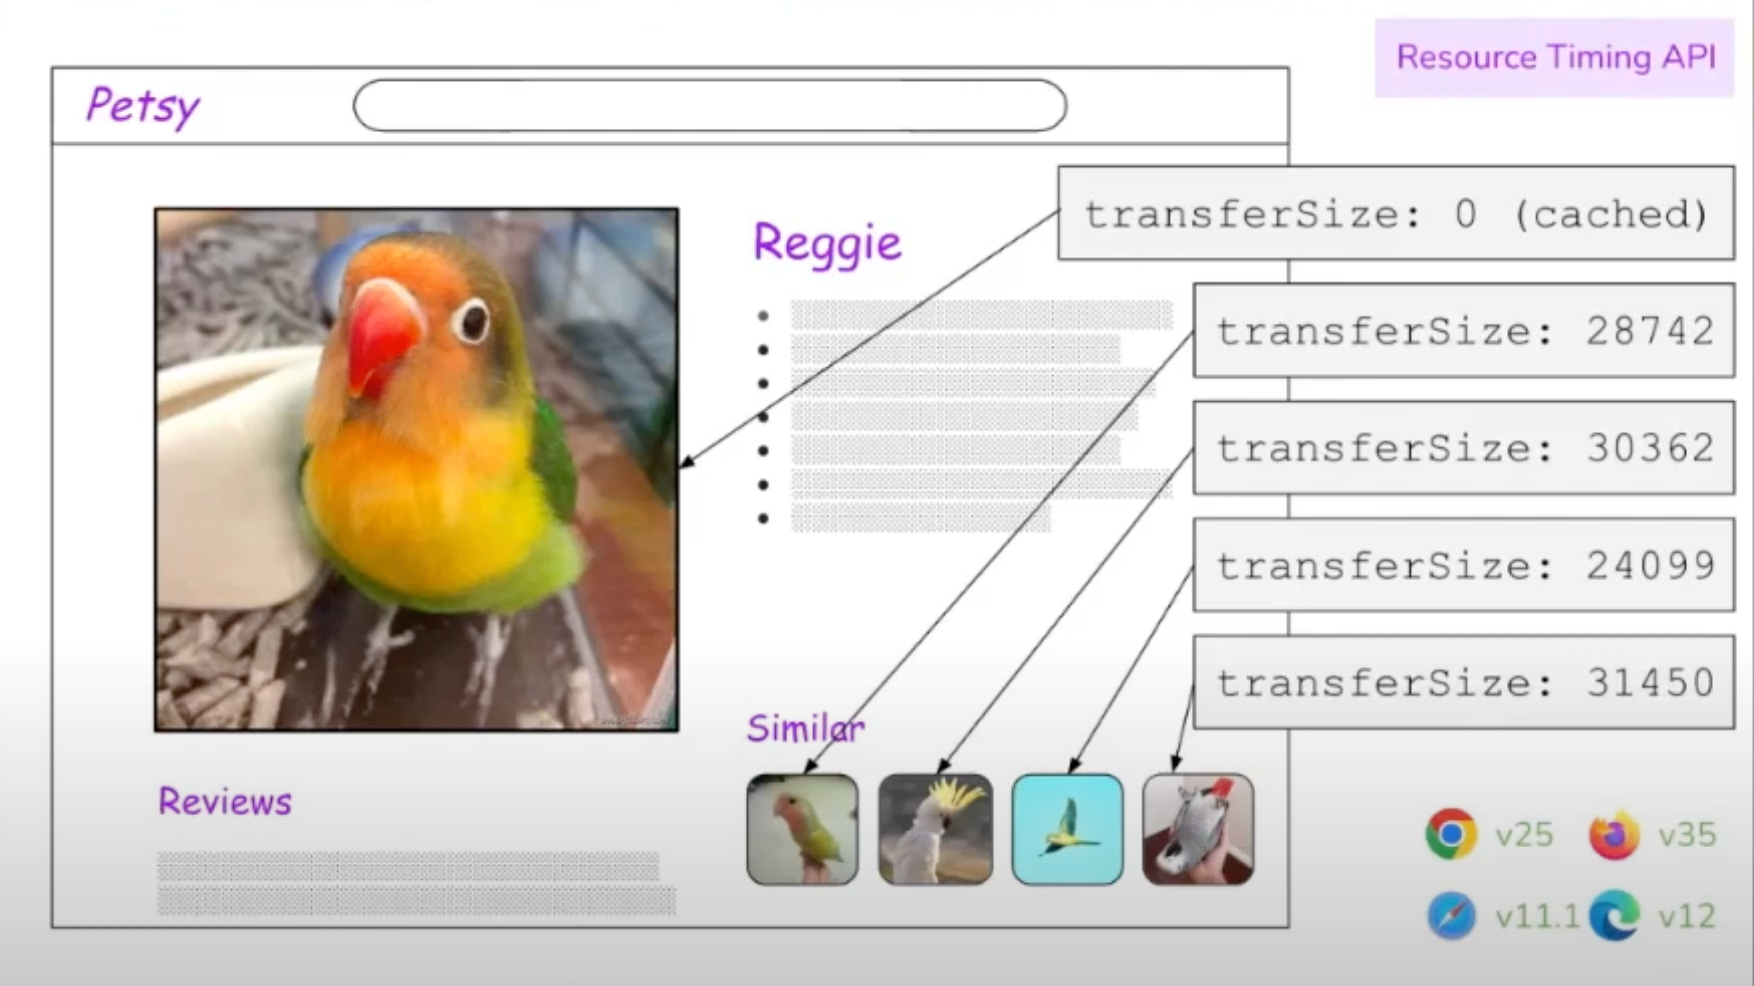
We can use the Resource Timing API to see how long certain assets, like images, take to transfer from the server to the page.
Notice how the API automatically respects caching? That’s handy for troubleshooting assets that may or may not be properly cached.
We get access to resource timing directly from the PerformanceObserver which can read a bunch of details about how and when assets are transferred from the server to the page, including:
connectStart / connectEnddomainLookupStart / domainLookupEndredirectStart / redirectEndresponseStart / responseEndfetchStart / fetchEnd
…and, of course, transferSize recorded in bytes.
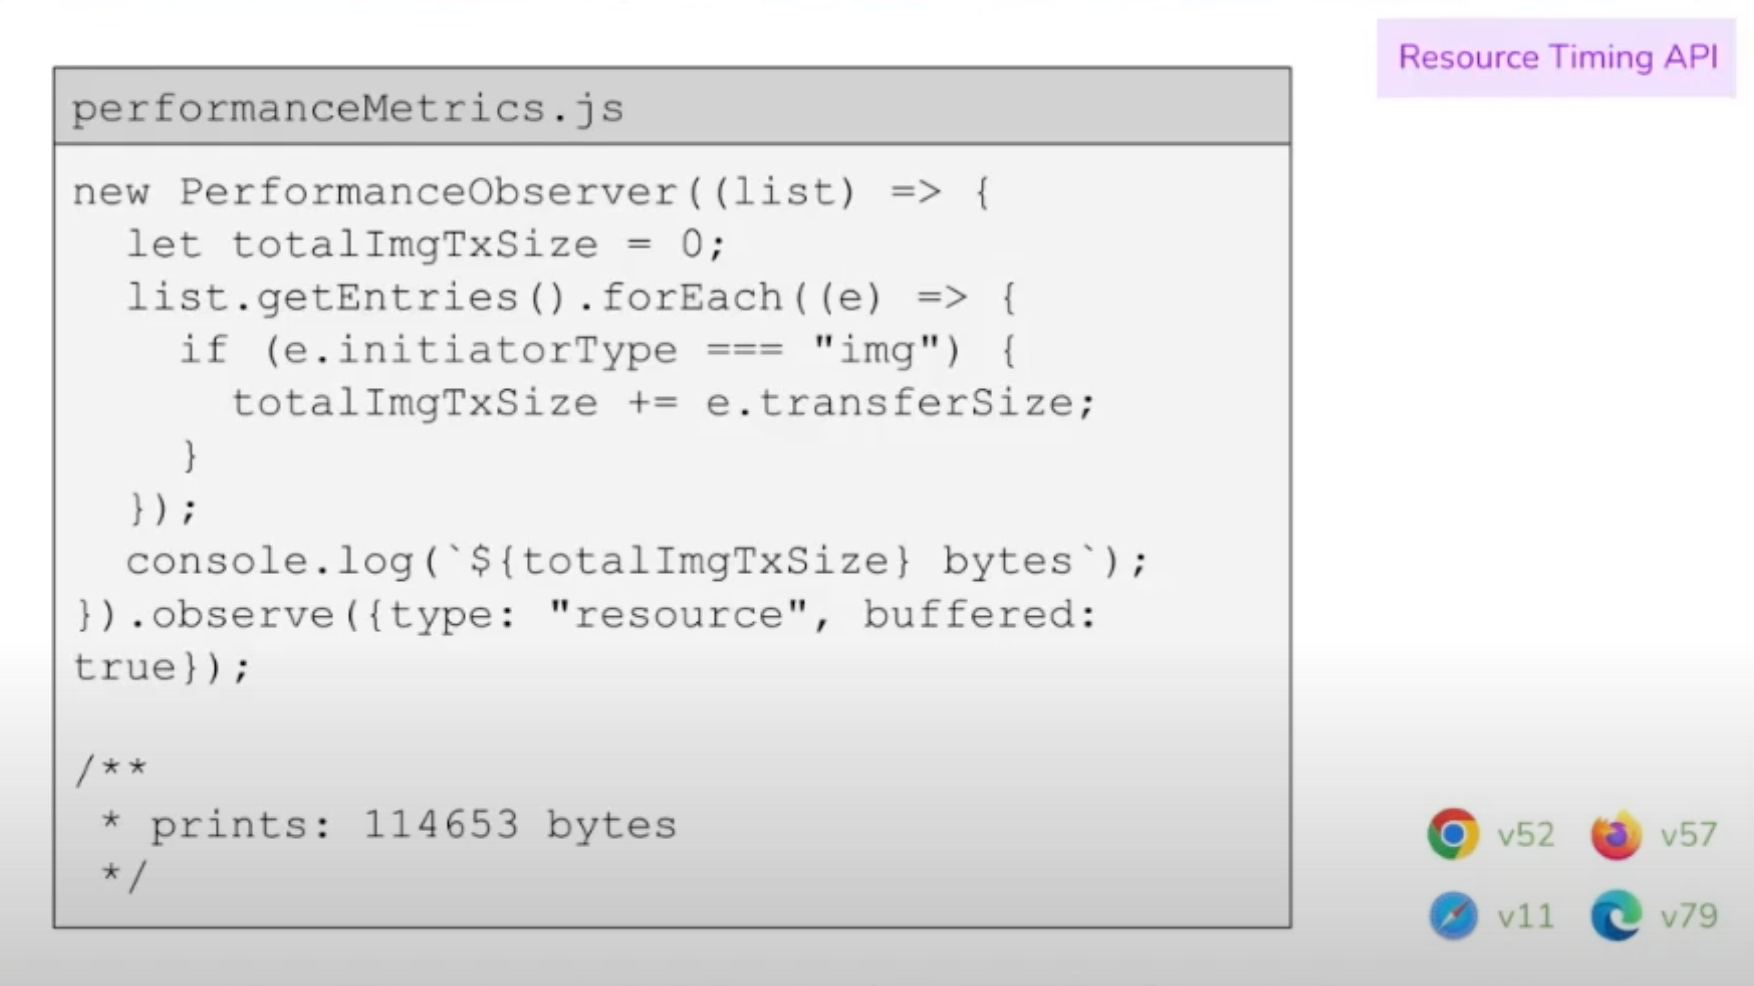
This snippet lists all resources marked up as images and calculates the amount of bytes that were transferred between the server and the page.
It all comes back to back-end metrics
The biggest takeaway for those of you looking to improve performance is that there is only so much we can do on the front end to improve performance. The process of requesting, sending, downloading, and rendering a page involves many moving pieces, but there’s always going to be a period where the HTML waits for dependencies before it can do anything.
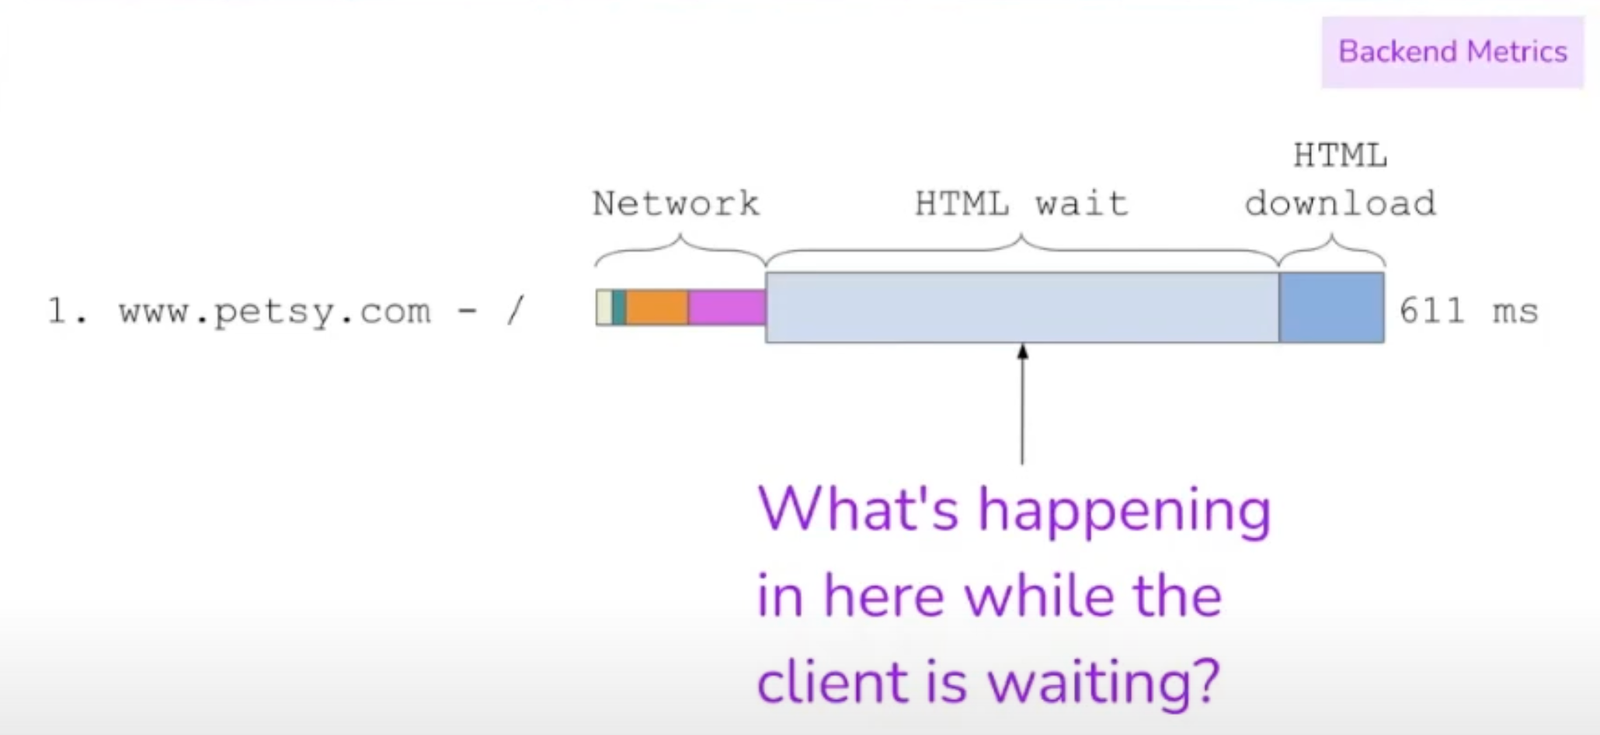
Yes, indeed: What is happening while the client is waiting all that time?
Essentially, we can categorize things into four general buckets of activity:
Routing
Data fetching
Data processing
View Rendering
That’s where the Server Timing API can help. Rather than focusing on specific elements on the page or assets pulled from the server, we can read assets from any network request—whether it’s on our server or not—to identify which assets are being sent to users uncached.
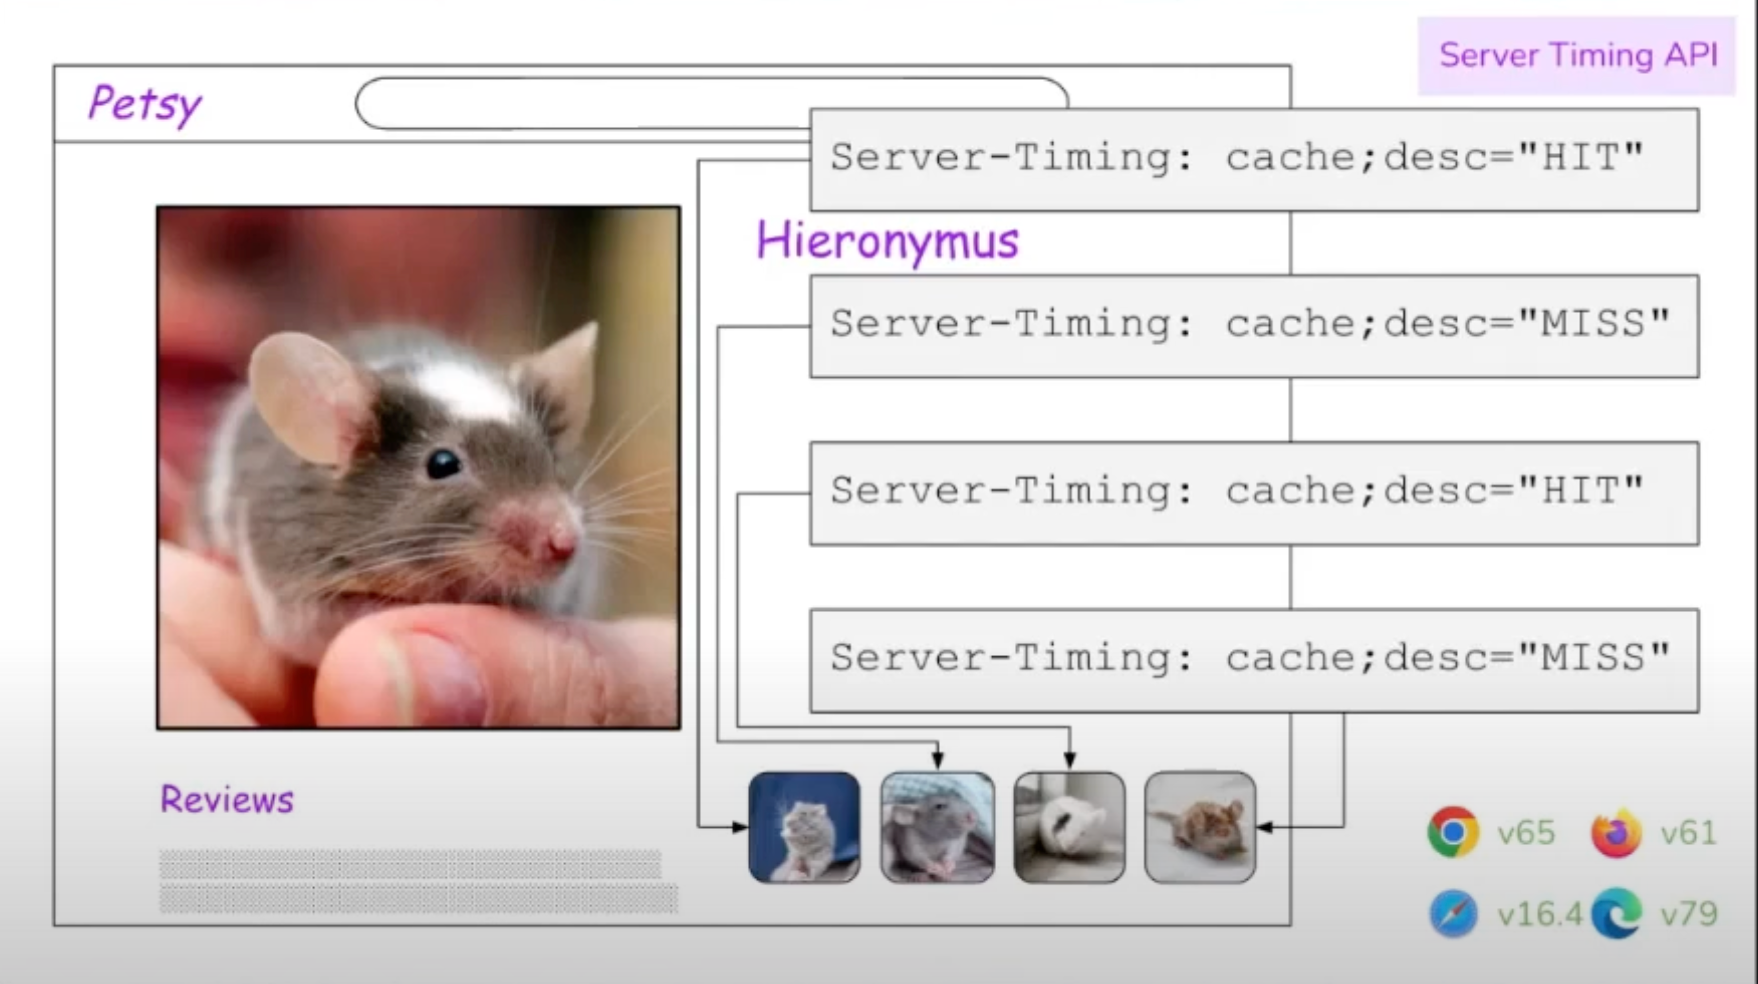
A “Hit” means the file was served from the cache.
You can imagine how useful this is for sites that rely on CDNs for caching and delivering assets. Once again, this information can be tapped directly from the PerformanceObserver.
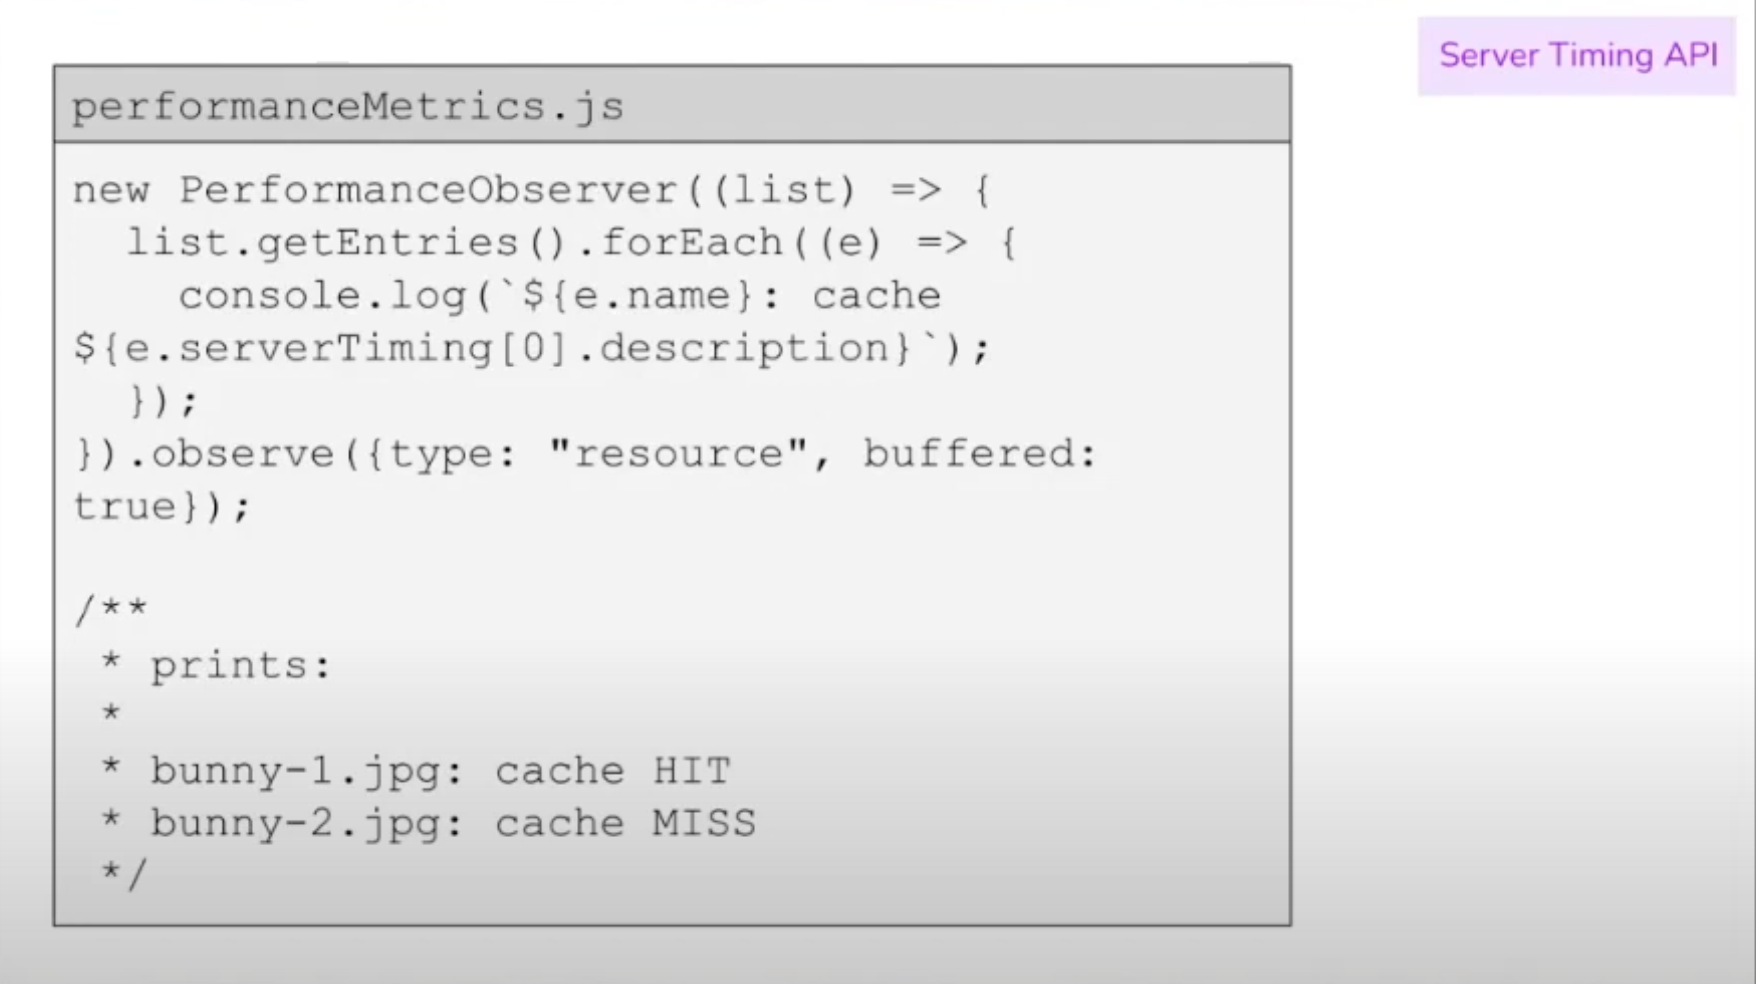
This snippet lists all resources on the page and prints their names and whether or not they were served from the cache.
Wrapping up
This is merely a summary of all the amazing performance suggestions Terry shared in the Smashing Meets Performance talk. Of course, the nuances of what she discussed contain many more details and useful gems, so consider these my personal notes from the session.
I think you know where I’m going with this: You should watch her presentation. Terry’s anecdotes on Etsy’s internal processes and how they arrived at the metrics they use to measure performance are incredibly cool; it’s the sort of thing you normally have to be behind the curtain to see.
The bottom line, though, is that there are enough ways to measure performance to fill an ocean. It’s remarkable just how much information is available to us with a few lines of JavaScript. And, in turn, we can use that information for deeper insights and even capture the data to create custom performance dashboards that are tailored to your needs rather than the one-size-fits-all nature of widely available tools.
Of course, there are companies and paid services that do all that for you. Even Terry admitted that Etsy’s custom performance dashboard is fairly complex and requires a good deal of upkeep despite the perks. So, perhaps an Application Performance Monitoring (APM) tool like Sentry — which can record these metrics for you to curate into custom reports — is the happier path in your case.


