Debug errors in Lambda functions
Debug errors in Lambda functions


Troubleshooting production issues in Lambda environments is often challenging. CloudWatch requires developers to comb through logs, search for relevant terms that they may not always know of and has hard-to-consume stack traces.
For obvious reasons, we recommend using Sentry to instrument your Lambda Functions code in order to report error stack traces and associated debugging context.
Here's a walk through on how to instrument a Node function. If you are using Python environment, there are parallel docs.
Step 1: Create a dummy function to test the error reporting - we created a simple function that calls an unknown function.
const mySyncHandler = (event, context, callback) => {
notDefinedFunc();
};Step 2: Add Sentry to the Node folder - we used npm for this example, but you can use yarn too.
npm install --save @sentry/serverlessStep 3: Initialize Sentry in the Lambda function - Import Sentry's Serverless package and wrap your handler.
const Sentry = require("@sentry/serverless");
Sentry.init({
dsn:
"Get your dsn by creating a free account with Sentry",
});
const mySyncHandler = (event, context, callback) => {
notDefinedFunc();
};
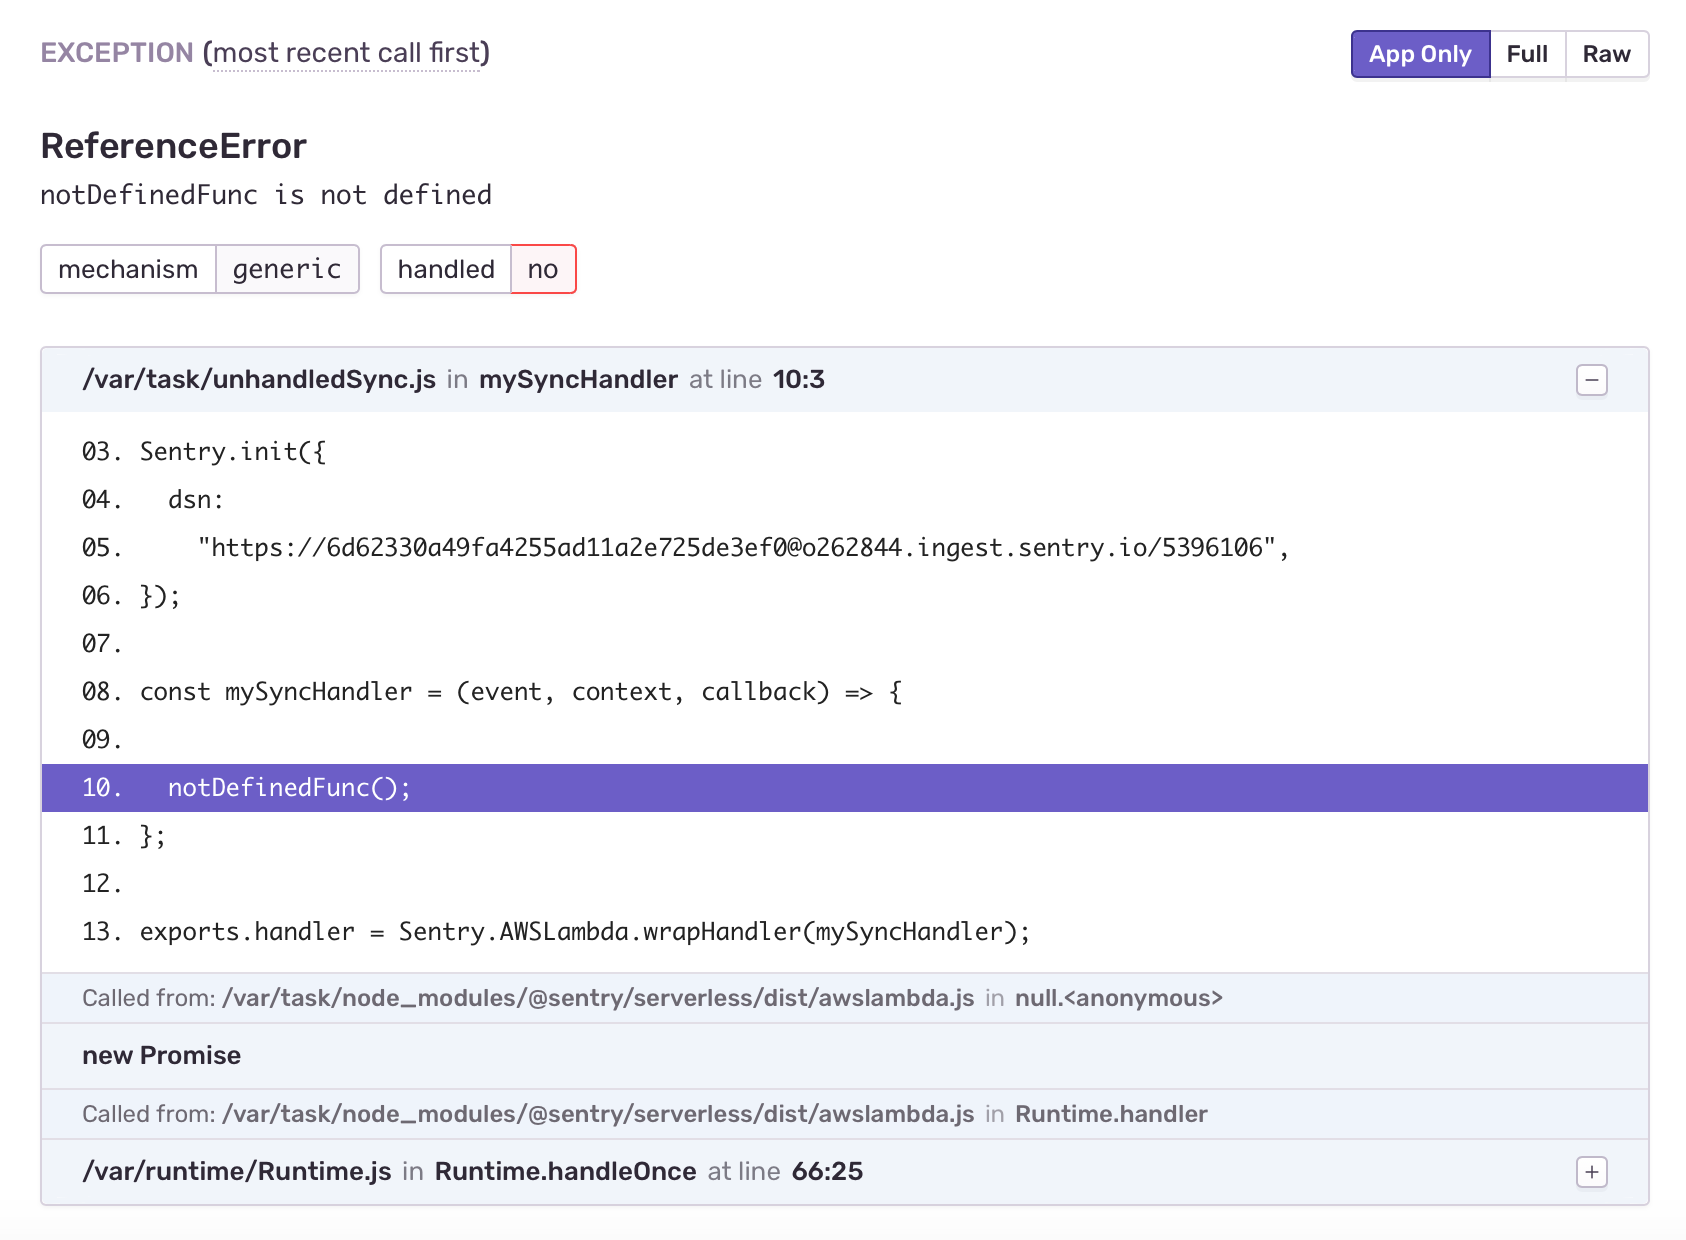
exports.handler = Sentry.AWSLambda.wrapHandler(mySyncHandler);That's it. You now have visibility into errors from my Lambda functions.
The stack traces are detailed and point you to the line of code that's causing the exception.
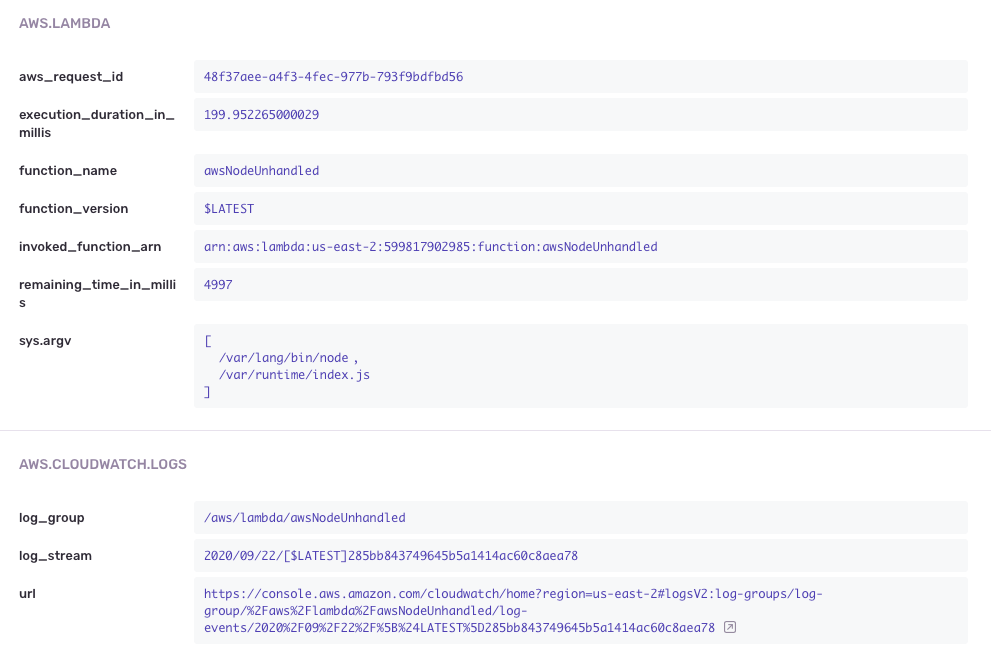
Function context like aws_request_id and remaining_time_in_milis are super helpful. In addition, you get deep links to CloudWatch logs.
For extra credit, I made couple customizations to my error reporting:
I really care about timeout issues. They end up bleeding into unknown issues that are difficult to debug. So, I enabled timeout warnings.
exports.handler = Sentry.AWSLambda.wrapHandler(yourHandler, {
  captureTimeoutWarning: false,
});
Also, while Sentry automatically captured breadcrumbs from console logs, I added some of my own.
Sentry.addBreadcrumb({
  category: "auth",
  message: "Authenticated user " + user.email,
  level: Sentry.Severity.Info,
});
With this instrumentation, I can quickly identify issues, reproduce issues in my local environment and get to the root cause of the problem.
Looking for a bit more help? Our Lambda Docs are a great place to start. And if you have questions or feedback, visit our Python SDK on GitHub, or shout out to our support engineers. They’re here to help. And also to code. But mostly to help.


