Debugging a Slack Integration with Sentry’s Trace View
Debugging a Slack Integration with Sentry’s Trace View
While building Sentry, we also use Sentry to identify bugs, performance slowdowns, and issues that worsen our users’ experience. With our focus on keeping developers in their flow as much as possible, that often means identifying, fixing, and improving our integrations with other critical developer tools.
Recently, one of our customers reported an issue with our Slack integration that I was able to debug and resolve with the help of our Trace View. Using Sentry as my primary debugging tool made it quick to resolve the issue for our customer and confidently confirm the issue had stopped. This blog post recounts how I debugged and resolved this tricky issue.
Discovering the root cause of intermittent issues
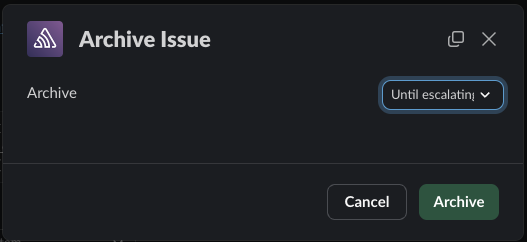
A few weeks ago, we received a customer report about an intermittent issue with our Slack integration. The customer was sometimes having trouble archiving and resolving issues using the modal we generate when the customer clicks on “Resolve” or “Archive.”

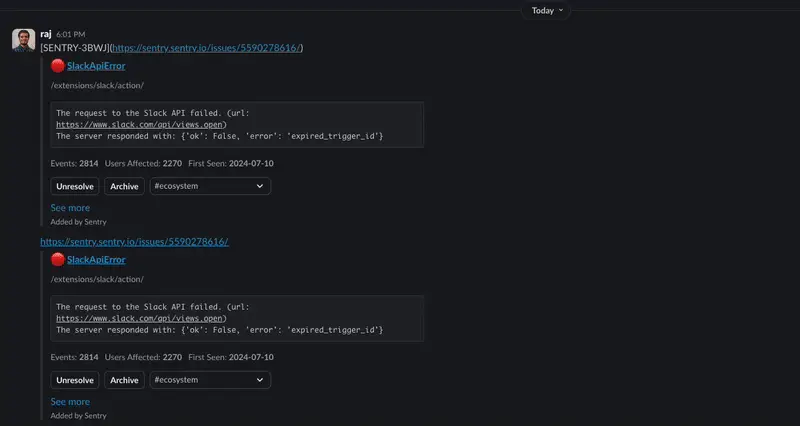
I triggered a sample Sentry error, and sure enough, when I got a notification in Slack and clicked on either “Archive” or “Resolve”/”Unresolve,” the associated modal would sometimes not render, making these action buttons appear to have no effect. Intrigued, I opened Sentry and used Issue Search to find relevant issues. Since this issue was happening intermittently, the most useful search parameter was our custom tag for integrations, integration_id.
I quickly found a relevant issue. It was a SlackAPIError that was showing up intermittently. I noticed that sometimes when we send Slack a request to render a modal, Slack servers respond with expired_trigger_id error codes.

Before I dove into the Trace View, I familiarized myself with the Slack documentation for their responses. I quickly realized what the likely root cause was: we were likely not sending the payload to render a modal to Slack fast enough. Slack expects integrations to respond within 3 seconds:
[Y]our app must reply to the HTTP POST request with an HTTP 200 OK response. This must be sent within 3 seconds of receiving the payload. If your app doesn't do that, the Slack user who interacted with the app will see an error message, so ensure your app responds quickly.
This expectation seemed reasonable, and if my hypothesis that this was the root cause was correct, then why weren’t we responding in time?
Debugging performance issues that caused a poor user experience
Since I had the likely error causing this issue, I decided this would be a great use of Sentry’s Trace View. I found a sample trace where the response time was the worst. Since we add spans whenever we’re working with an external service, like Slack, I was able to better track down the likely source of why it was taking us more than 4 seconds to complete the user's request.

I decided convert_to_async_slack_response and API endpoint extensions/slack/action would serve as a good starting point to start investigating the code, since that span was where the Trace View identified the performance slowdown.
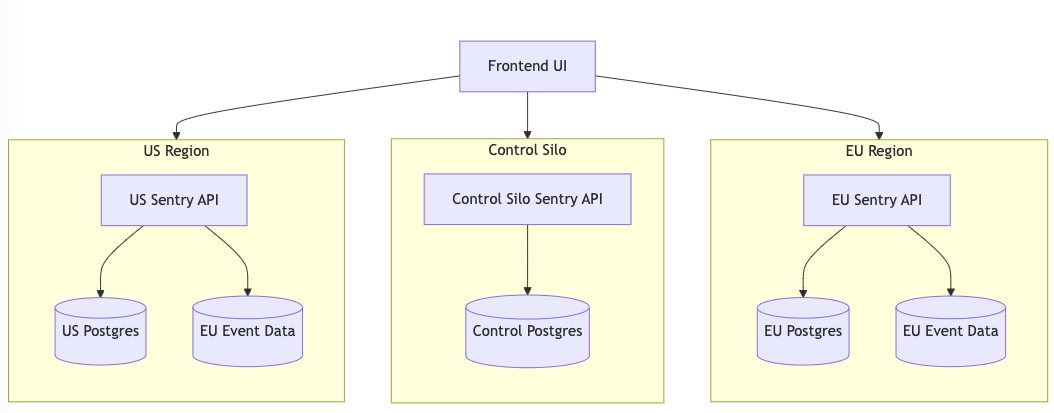
I observed that convert_to_async_slack_response was a Celery task. I realized that Sentry utilizes this task to transfer requests from the control silo, where all requests originate, to the region silo. This is where we generate the response that includes the relevant error details before sending it to Slack.
We split our customer’s data in different “silos” to provide our customers data residency.

This task is asynchronous, so we couldn’t guarantee when the task would trigger our response to Slack. To respond to Slack in time, we would have to respond in the control silo.
Fixing the Sentry-Slack Integration
With a rough idea of the problem and a possible solution, I worked on figuring out where this task was being populated from. Returning to the Trace View, I saw we were populating this from our IntegrationControlMiddleware.

With this in mind, I worked on a fix. First, I created a method to create a simple loading modal that we could send to Slack initially:
def handle_dialog(self, request, action: str, title: str) -> None:
payload, action_ts = self.parse_slack_payload(request)
integration = self.get_integration_from_request()
if not integration:
raise ValueError("integration not found")
slack_client = SlackSdkClient(integration_id=integration.id)
loading_modal = self.build_loading_modal(action_ts, title)
try:
slack_client.views_open(
trigger_id=payload["trigger_id"],
view=loading_modal,
)
…You can see this new method on GitHub.
Next, I updated our async response logic so that if the user decides to open a modal, we would send them a loading modal before we send kick off the celery task to respond to them with the more detailed modal:
        try:
            if (
                options.get("send-slack-response-from-control-silo")
                and self.action_option in CONTROL_RESPONSE_ACTIONS
            ):
                CONTROL_RESPONSE_ACTIONS[self.action_option](self.request, self.action_option)
        except ValueError:
            logger.exception(
                "slack.control.response.error",
                extra={
                    "integration_id": integration and integration.id,
                    "action": self.action_option,
                },
            )

        convert_to_async_slack_response.apply_async(
            kwargs={
                "region_names": [r.name for r in regions],
                "payload": create_async_request_payload(self.request),
                "response_url": self.response_url,
            }
        )
You can see this logic on GitHub.
The result was an experience that looks like this:
(Note: I slowed the gif down to make the loading state more apparent.)

The power of debuggability in software development
And that’s it! We got the PR merged and saw that the number of events for the issue dropped to 0 once the change was deployed.

Our journey through debugging this issue underscores one critical lesson above all: the immense power of debuggability in modern software development. Tools, like Sentry, allow us to:
Pinpoint the exact cause of our performance bottleneck
Visualize the entire request flow
Quickly navigate to relevant parts of our codebase
Without this level of visibility, we might have spent weeks trying to reproduce and understand the issue. Instead, we diagnosed and solved the problem efficiently, demonstrating how crucial proper instrumentation is for effective debugging.
Remember, in the complex world of software development, debuggability isn't just a nice-to-have—it's a must-have.
Happy debugging, and may your traces always be insightful!


