Debugging Query Rate Limiting in Sentry
Debugging Query Rate Limiting in Sentry
Snuba, the primary storage and query service for event data that powers Sentry in production, has historically been doing rate limiting under the hood, making it hard to discover and increasing time to resolve customer support requests.
This is not something you’d know the specifics of unless you were deep in the Snuba code. But as we triage support questions from customers, one issue tends to pop up: RateLimitExceeded.
You got tired of not getting query results. We got tired of seeing this exception. So we fixed it.
Why Sentry had RateLimitExceeded issues
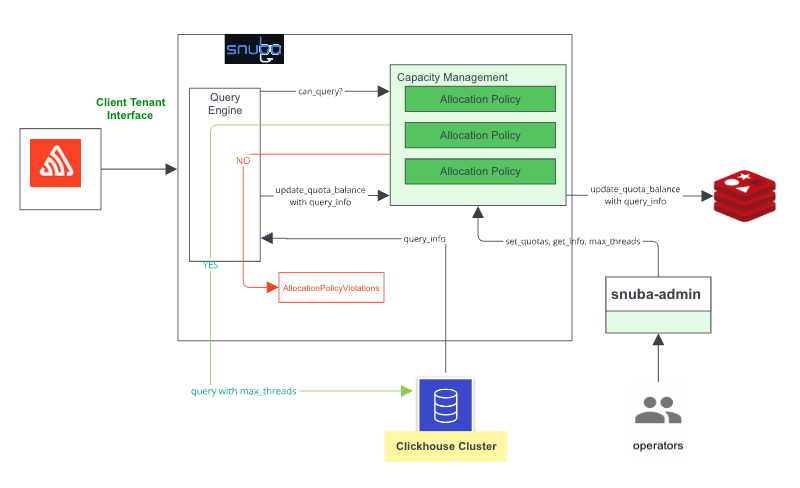
RateLimitExceeded issuesAt Sentry we use various ClickHouse clusters that are managed in-house. These ClickHouse clusters serve the data for both our UI and API. We also have a collection of allocation policies as part of our “ClickHouse Capacity Management System” to determine how to allocate ClickHouse resources to incoming queries.
For each query sent to Snuba, the Capacity Management System will apply its collection of allocation policies to determine whether the query will be accepted, rejected, or throttled.
How Sentry reduced rate limiting for everyone
First, to make rate limiting less dark and shadowy, we created a “Snuba Customer Dashboard” in an infra tool so that Sentry engineers could see what was happening to their queries in aggregate.
And while error-related queries are successful 96.628% of the time, just knowing wasn’t enough. And, unfortunately, infra monitoring tools like Datadog are not debugging tools.
And since we make a debugging tool (it’s called Sentry 😃), we figured we should probably surface the information around these rate limited queries in Sentry. So we did that.
Step 1: Improving our developer workflow
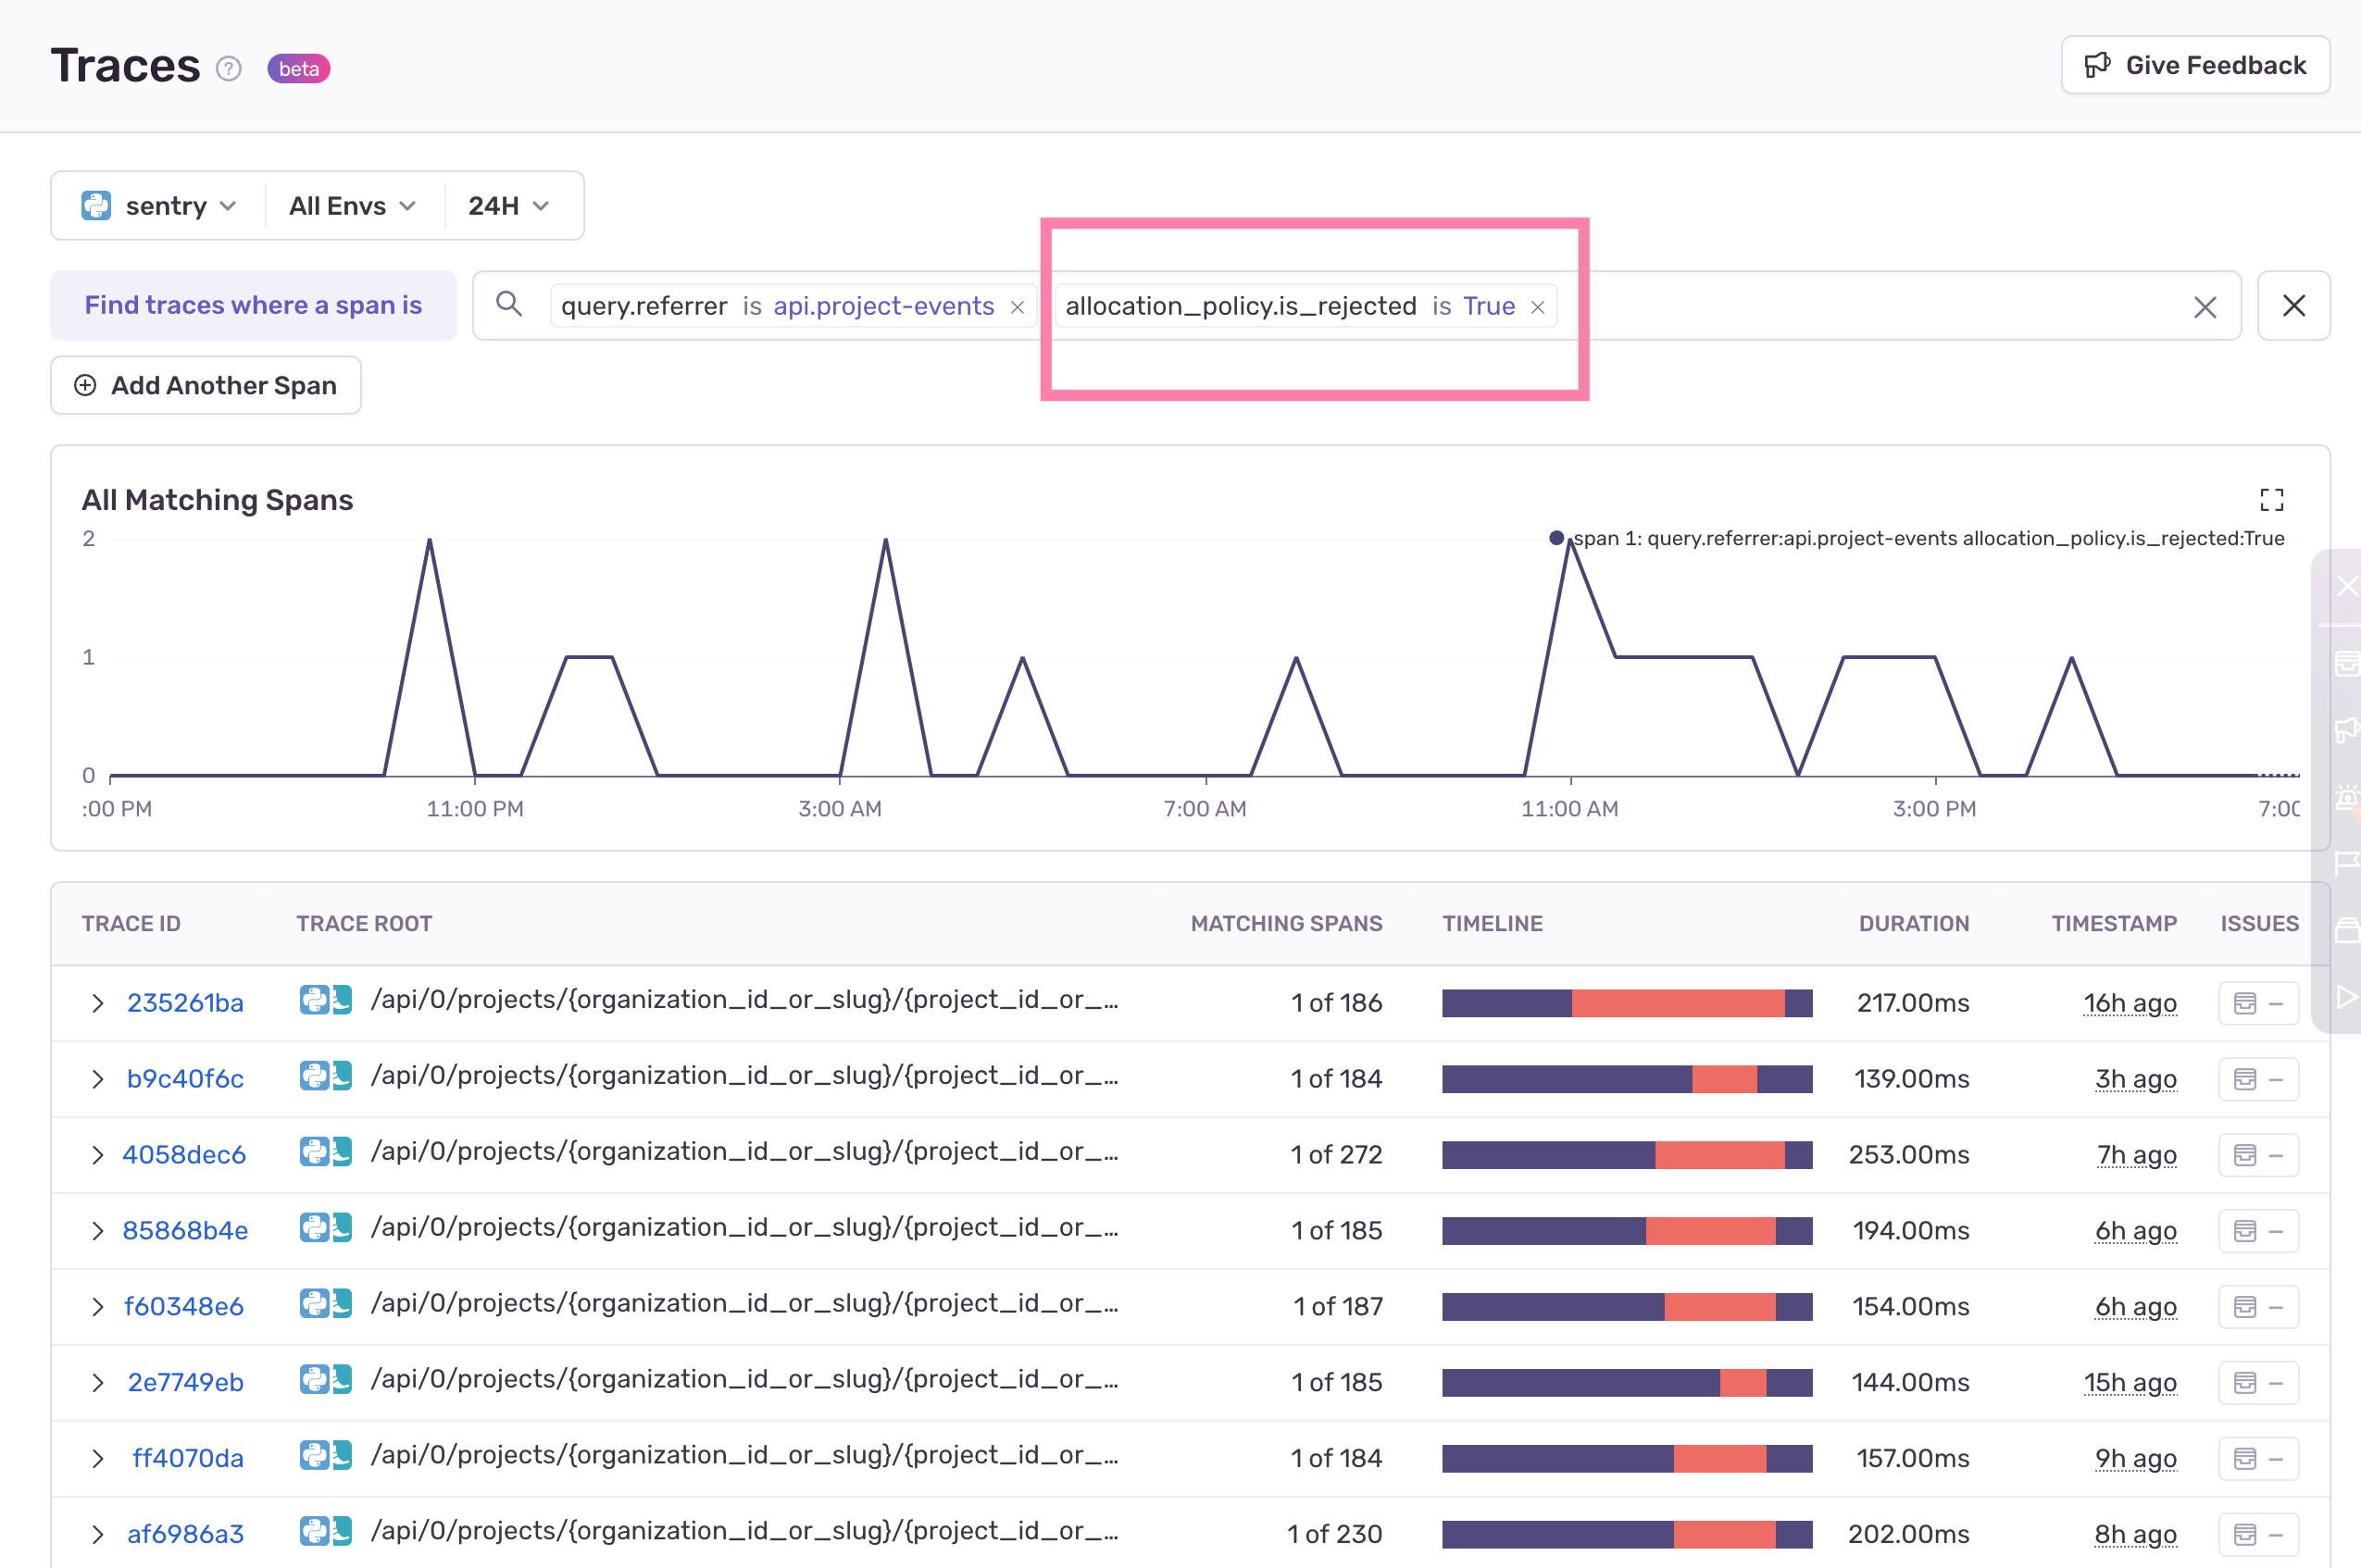
Before we just built some new functionality in Sentry, we decided to make sure we had the information we needed. So we started with enabling the Snuba Customer Dashboard to find out what is going on from an aggregated overview (the “what”), and then we used Sentry Trace View page to dig into the specifics of the queries being rate limited (the “why” and the “how”)
Below is an example of how we get all the traces from the api.project-events referrer that had rejected queries:
Step 2: Give customers “warning zones” before rejecting queries
Sentry customers wouldn’t realize they were making excessive queries until a threshold is reached and queries start getting rejected. For a better developer experience, we introduced a “warning zone” before queries are rejected. With this warning zone, we accomplish two things:
We throttle the queries sent by the same customer. This means those queries will be executed with fewer threads, so they will take longer to run.
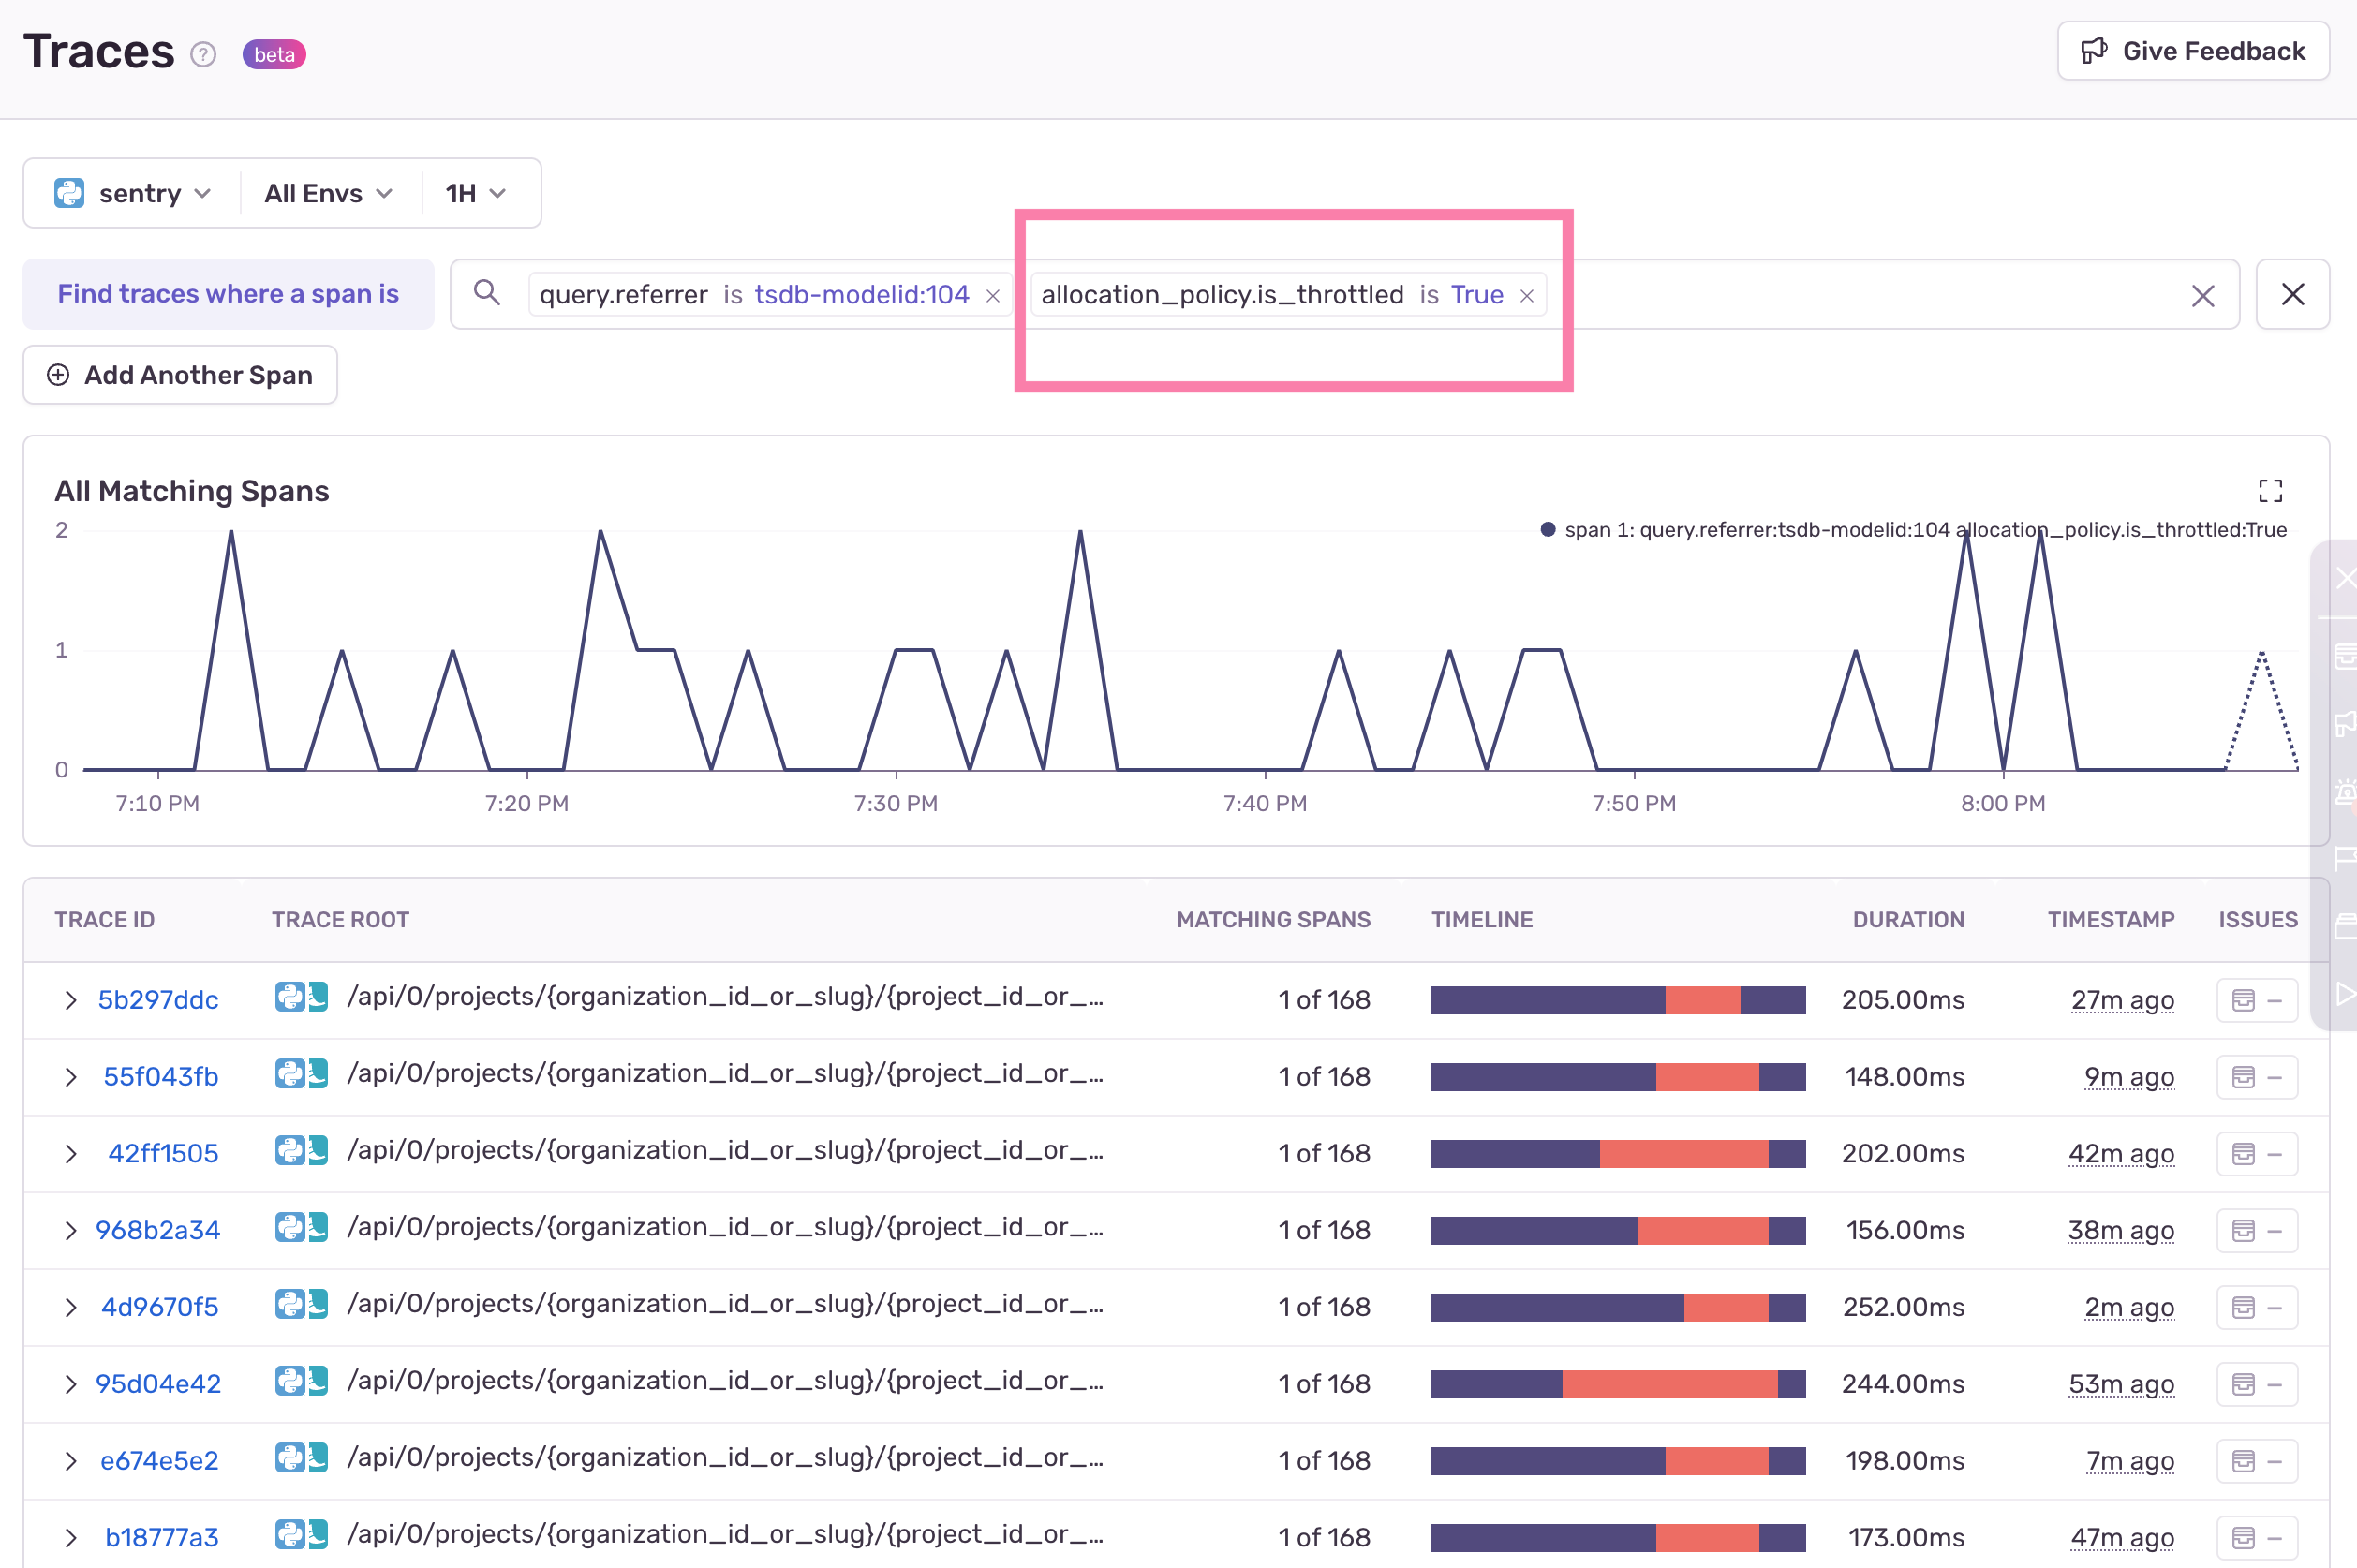
We can filter for these queries in the warning zone, or throttled queries, so that Sentry developers can use them to be proactive in remedying frequent queries.
Now, instead of only checking if the allocation policy is rejected or not, Sentaurs could check if the queries from that account were being throttled:
Step 3: Organize information about throttled and rejected queries on Sentry
With Datadog dashboards, engineers can see the volume of affected queries, but they lack critical debugging information. Identifying trends can be useful, and was particularly useful for us when we decided to build this, but without detailed debugging information, such as the rate limiting thresholds, we were still not able to offer suggested actions for customers to more quickly unblock them with our infra monitoring tool.
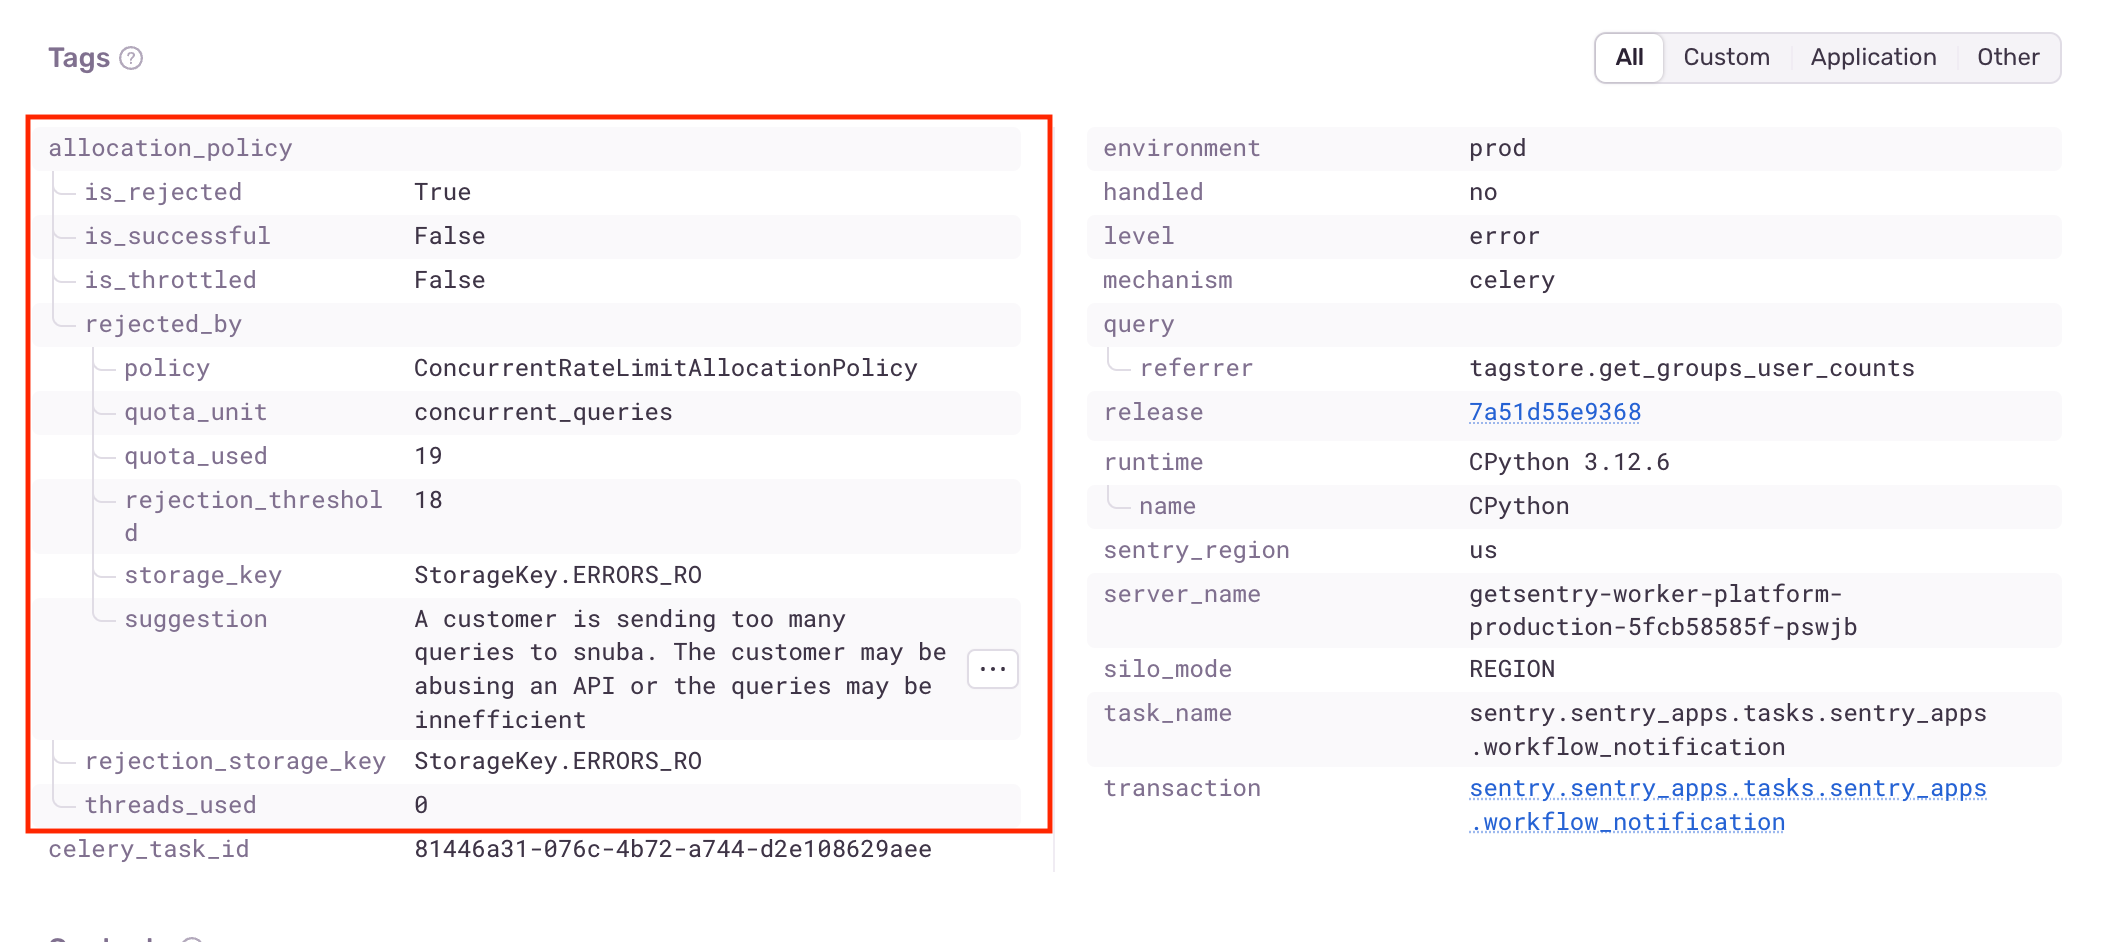
Now, Sentry engineers can use Sentry to click into affected queries, and view helpful debugging information under our custom tags.
Additionally, this information is also available as tags under spans. In the example below, we can see that the span with ID aa73cba0b21d86bc is throttled.
The existence of these tags allows Sentry engineers to get a comprehensive view with desired fine-grained filtering - all from within our normal debugging workflow in Sentry.
How do these improvements benefit Sentry users?
Our goal for this solution was to not require Sentry engineers to have to change the way they debug when trying to resolute rate limit issues on queries. So with these changes, Sentry engineers can send queries to Snuba like normal.
If the queries are successful, nothing happens (other than the result being returned). However, if RateLimitExceeded starts showing up, then the queries are getting rejected and the new information in the Sentry Issue and Span details will help debug why.
So when you are no longer getting query results and you ask a Sentaur for help in figuring out “why Sentry is broken”, we will be able to not only figure out exactly what and why this issue was triggered, but we will be able to leverage the allocation_policy.suggested tag to suggest possible actions to take.
We can all be debugging faster with Sentry
If you have read any of our other blog posts you might have seen a trend: we’re always wanting to help you debug faster. Selfishly, it’s because we also want to debug faster and ship with more confidence. It’s “small”, yet constant, improvements like this that help us not only debug our own application, but help our customers faster too. If you have any questions, be sure to reach out to us on Discord.


