Debugging the slow query that broke our SaaS app


There are many things I would rather do at 9pm than tracking down a mission-critical bug, but sometimes you don’t have a choice. Let me tell you the story about a slow query that led to a cascading failure–and how it could have been worse.
I was chilling in my hotel room in Hamburg after a hackathon day, when I got an urgent alert that our API was down. Our Laravel-based SaaS app placid.app usually generates creatives at scale, but at that moment, it wasn’t generating anything.
Adrenalized, I had my laptop open in a second:
The API? Unresponsive
The app? Down
The database? CPU load through the roof
Error logs? Timeouts and errors all over our Sentry dashboard
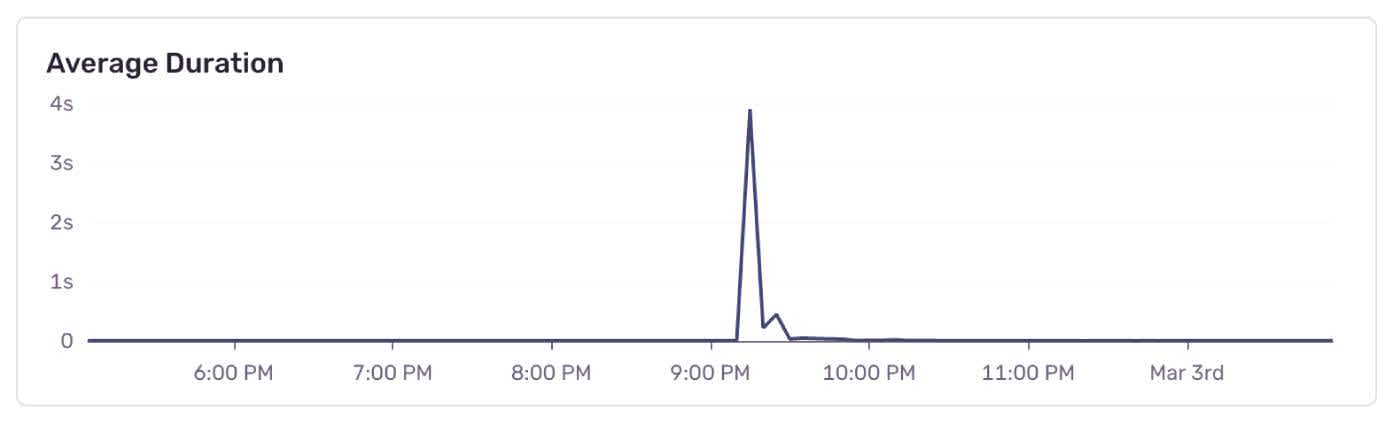
With that info, I decided to take a closer look at the monitoring data to find out what was hammering our database. I jumped into Sentry’s performance dashboard and spotted a suspect among the query logs: A spike in average duration, caused by a super slow query that usually runs in the background.
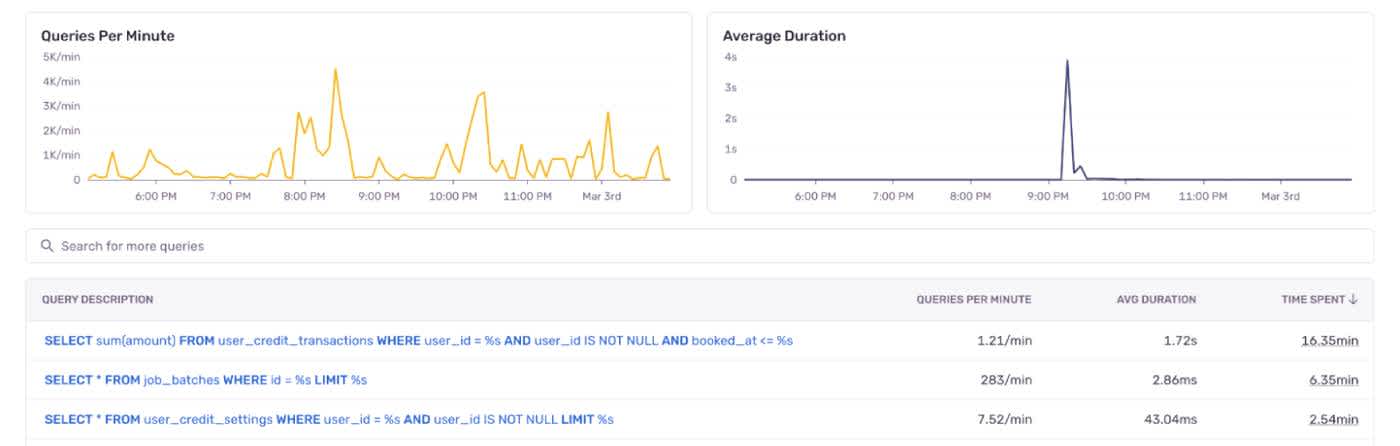
The slow query in question calculates our user’s credit balance. A credit is our in-app currency used to generate images, PDFs and videos. With each generation, we have to check if the user’s balance covers the credit cost of the job.
The balance is calculated with data from past credit transactions and then cached to avoid expensive recalculations. (At least in theory. Spoiler alert: This is important later!)
SELECT sum(`amount`) AS aggregate
FROM `user_credit_transactions`
WHERE `user_credit_transactions`.`user_id` = ? AND `user_credit_transactions`.`user_id` IS NOT NULL AND `booked_at` <= ?
This innocent-looking query started taking minutes to run.
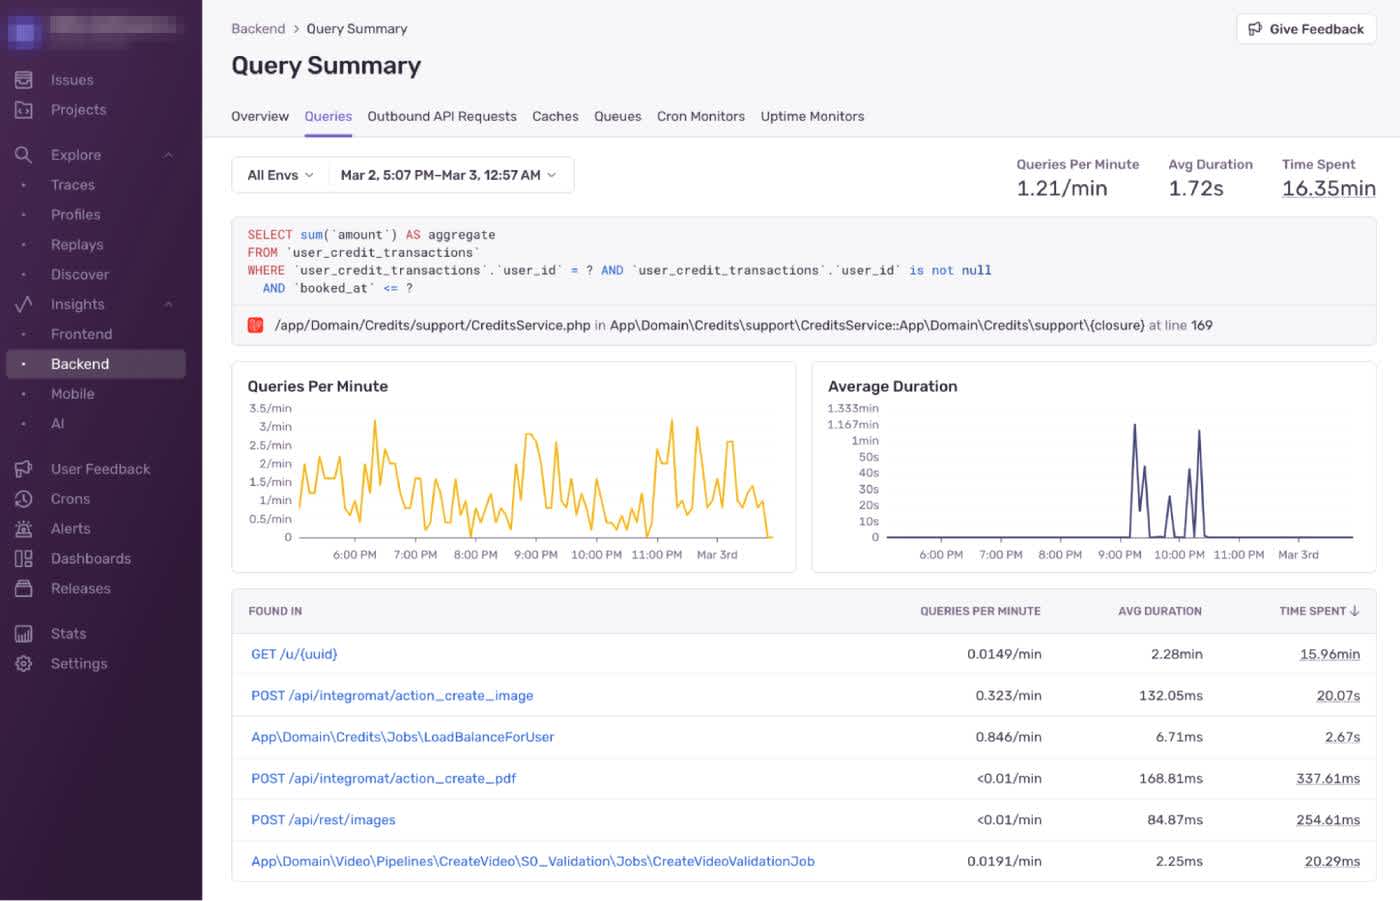
Digging deeper, I found that it was triggered live by API endpoints that handle creative generation. That should not even happen. Workers should just pull the cached balance without hitting the database at all.
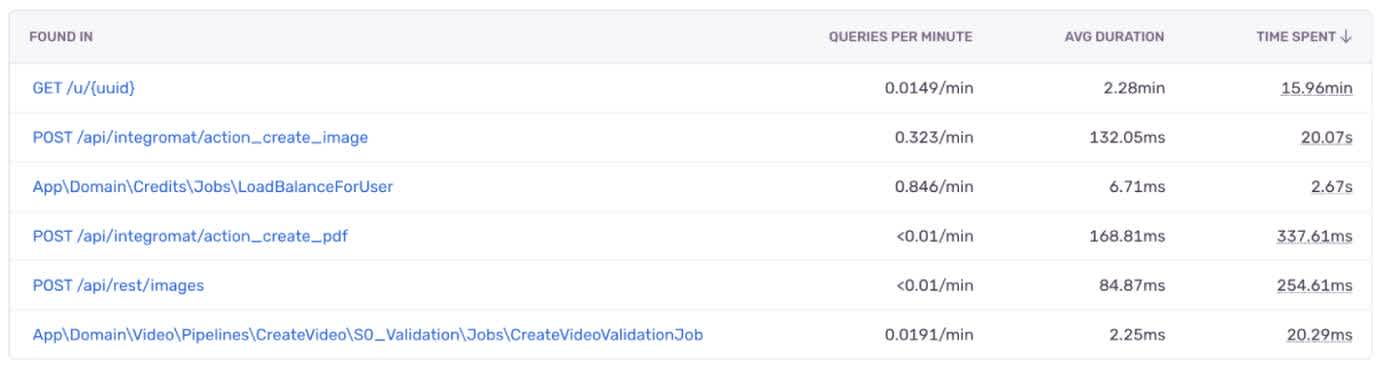
Only the `LoadBalanceForUser` job should have triggered the query. Everything else was part of a hot API path and should have used the cached value.
Looking at the request metadata, I could identify the trigger.
I found that a user has been sending a high amount of requests through our URL-based API earlier. Normally that’s not a problem, but now every one of those requests hit the credit balance calculation query. This endpoint allows high throughput for availability reasons, so this led to thousands of concurrent slow queries.
Multiple workers tried to calculate the same user’s balance simultaneously and the load ballooned, causing a cascade of failures, timeouts, blocked queries, and a growing backlog that eventually froze the system.
To stabilize things, I quickly killed all open MySQL queries and cached the credit balance for the affected user manually. That brought the system back to life: Workers could now grab the cached value (as intended) and move on.
A first relief. Crisis mode off!
To solve the problem long-term, the big question remained: Why wasn’t the balance cached in the first place?
The user in question didn’t have a large credit budget or tons of transactions. Their usage should not have caused a timeout during the calculation. This user probably wasn’t the root cause–they were just unlucky enough to trigger the problem.
My gut feeling told me that the calculations for some of our large customers with a grown, massive transaction history could be the culprit. I tested that theory by triggering the balance calculation for one of them and observing the process. Sure enough, it took forever and eventually timed out.
So our caching job died silently halfway through, and users with higher IDs processed after the failed one never got their balances cached. The user causing our incident was one of them.
Our initial assumptions for the design of the credit balance calculation were based on a smaller user base and less credit transactions. It was a pragmatic choice for the scale we were at, but now growth pushed it past its limits.
We have since optimized the query by storing partial (weekly) credit balance aggregations as a base for the ongoing calculations. That makes it more efficient and resolves the bottleneck. In case of any future cache misses, we also implemented more fallback strategies to prevent repeated database hits after failures.
If I had watched query durations more closely, I would have noticed them getting worse over time. I could have seen that the API endpoints were triggering the credit balance calculation query sometimes (without causing an issue at that time). If we had revisited this part of our architecture earlier, we would have had more guardrails in place and it wouldn’t have snowballed. I could have prevented this downtime.
Designing and maintaining a growing app means constant reevaluation and well… monitoring! Sometimes you catch issues in time, sometimes you have to stare at slow queries at 9pm.
Thankfully I had some quality data to work my way through this incident quickly. With Sentry, I could immediately make the connection between the incident, the specific slow query and the affected user.
I found and fixed the immediate problem in about 10 minutes total. This would have taken me a lot longer if I just had log files to analyze. The queries that were still open at that time wouldn’t even have been added to the MySQL slow query log yet. The chart that showed me the obvious spike in average query duration was also helpful, of course. 🙃
So yes, this was preventable, but those 10 minutes also held us accountable for making our architecture more resilient. That’s a reasonable price to pay, and a net positive in my book!