Deconstructing Distributed Tracing
Deconstructing Distributed Tracing


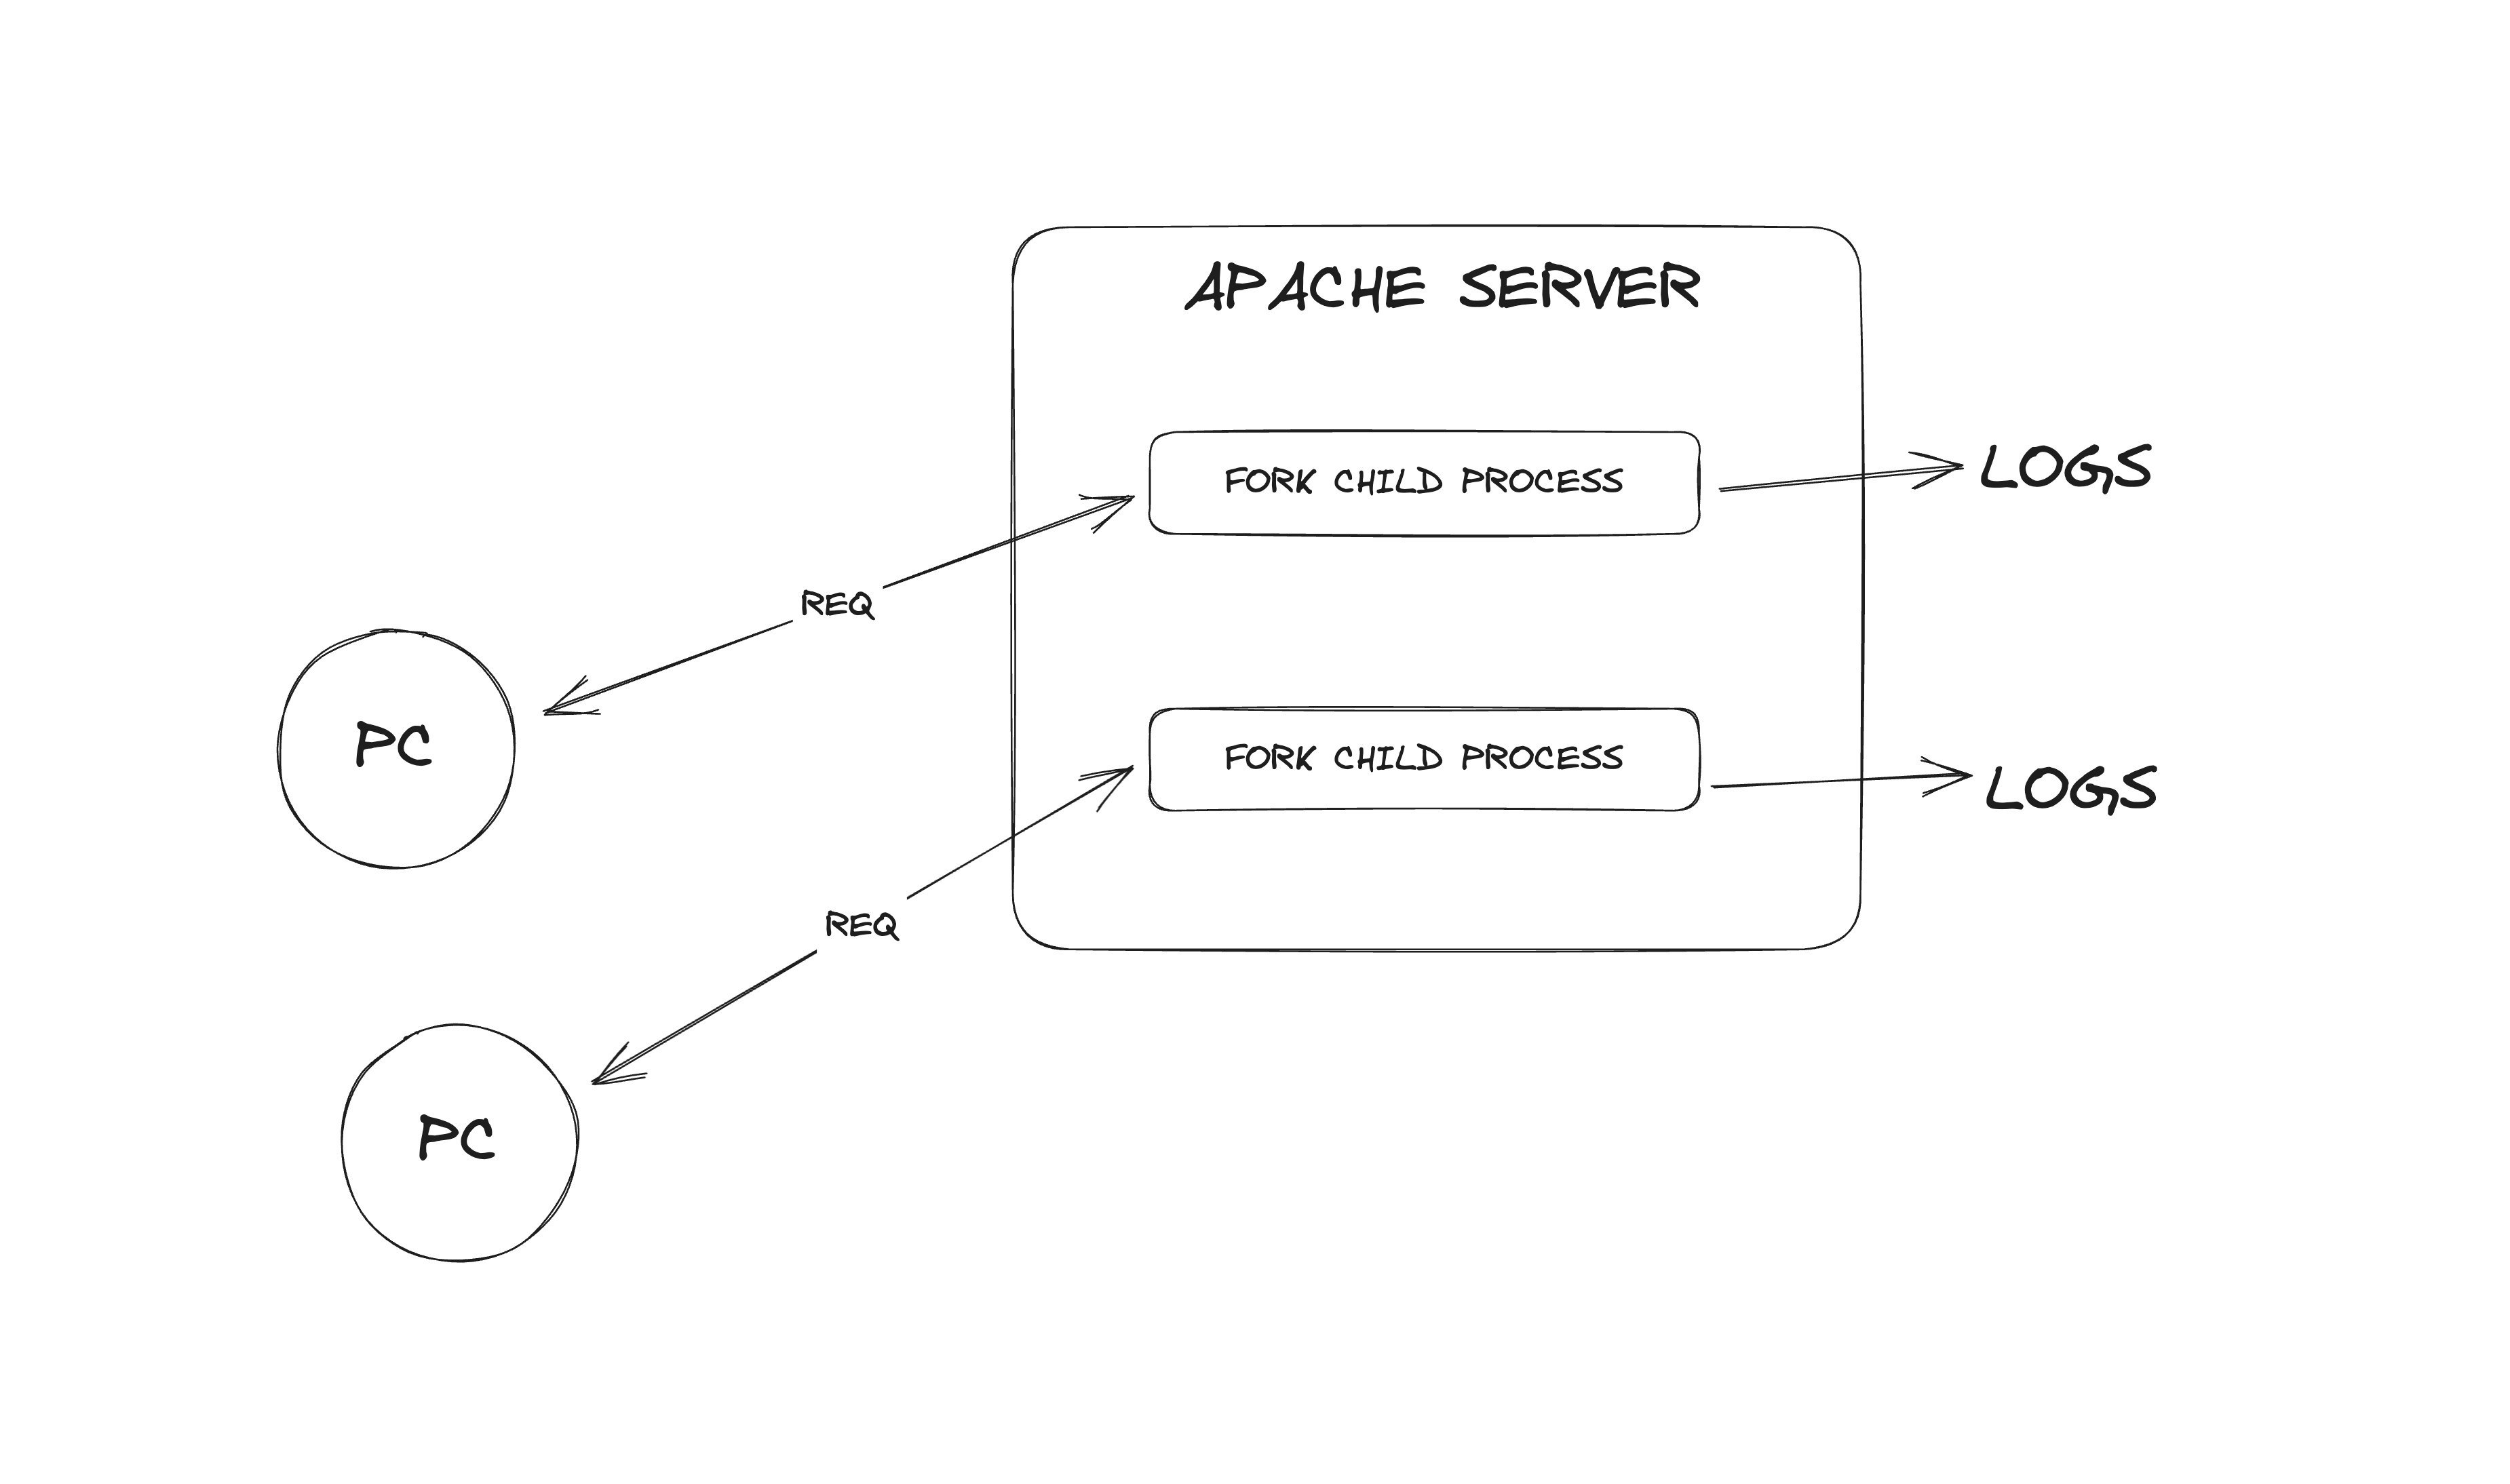
Let’s start at the beginning. As our libraries and frameworks evolve, our debugging tools need to as well. Back in the early days of the Apache HTTP Server logs were one of the few methods of debugging web applications, and they got the job done. Requests were being handled in their own processes, so obtaining logs for each request was fairly easy.
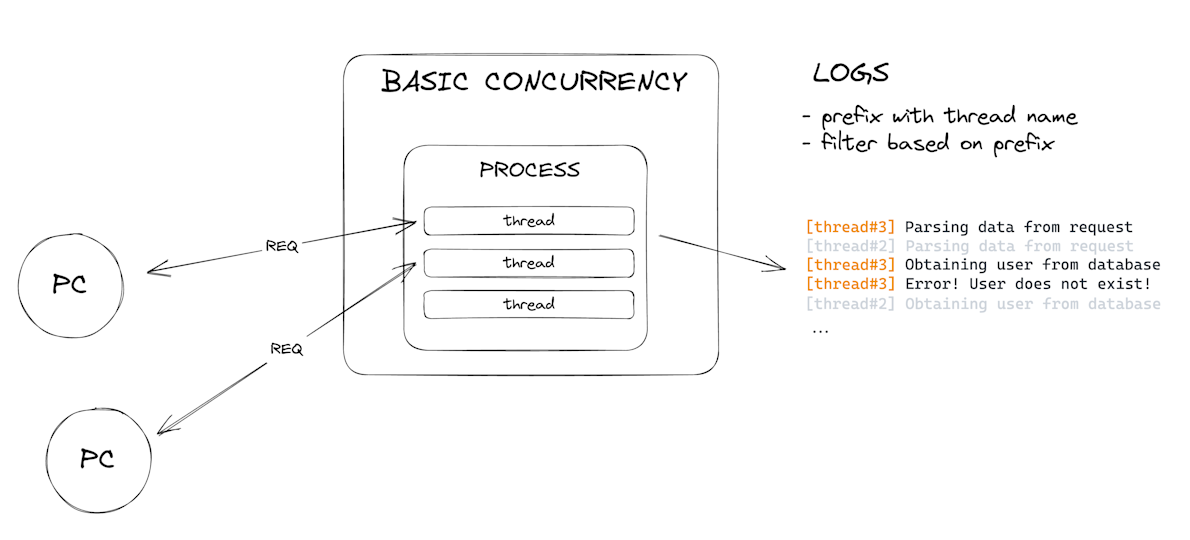
Then we got frameworks that supported basic concurrency, like how IIS in ASP.NET in its early days handled each request in its own thread. Since now we have all logs in the same process, what we did to obtain the logs for a specific request is to prefix our logs with the thread name, grab all the logs, and then filter out every log that has nothing to do with our request’s thread. Okay, not too bad, right?
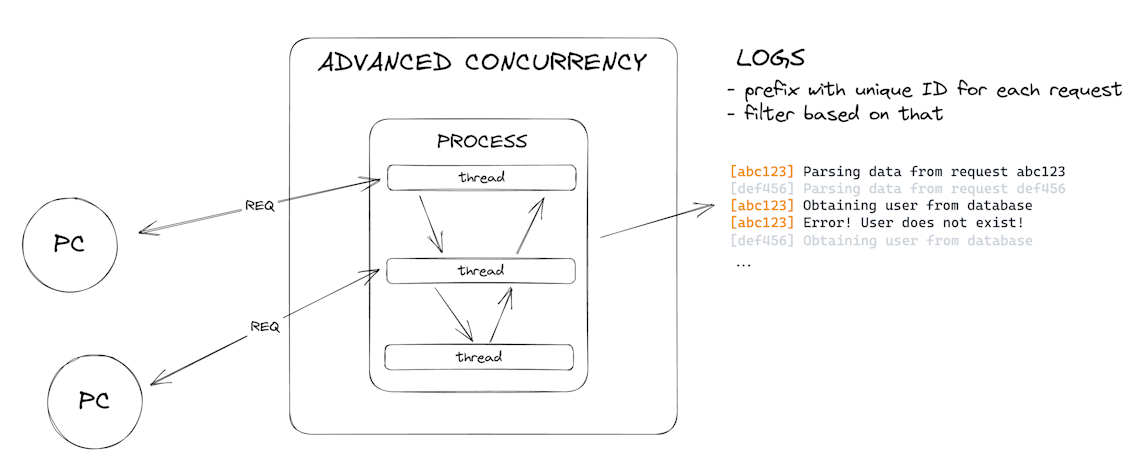
Then our frameworks evolved into asynchronous, multi-threaded, futures and promises, event-loop-based frameworks like Node.js. The request in this case might start on one thread, move to do some work on another, and finish on a third one. Prefixing the thread names don’t cut it anymore. We need to do something unique to the actual request, since that’s the only thing that’s constant throughout the whole execution. Something like a uniquely generated ID for that request, so the logs can follow its trace between the threads. Its trace you say? Okay, let’s call it a trace. We can filter out the logs based on the “trace ID” and we can see the execution flow of our request. It’s a bit more complicated than before, but okay.
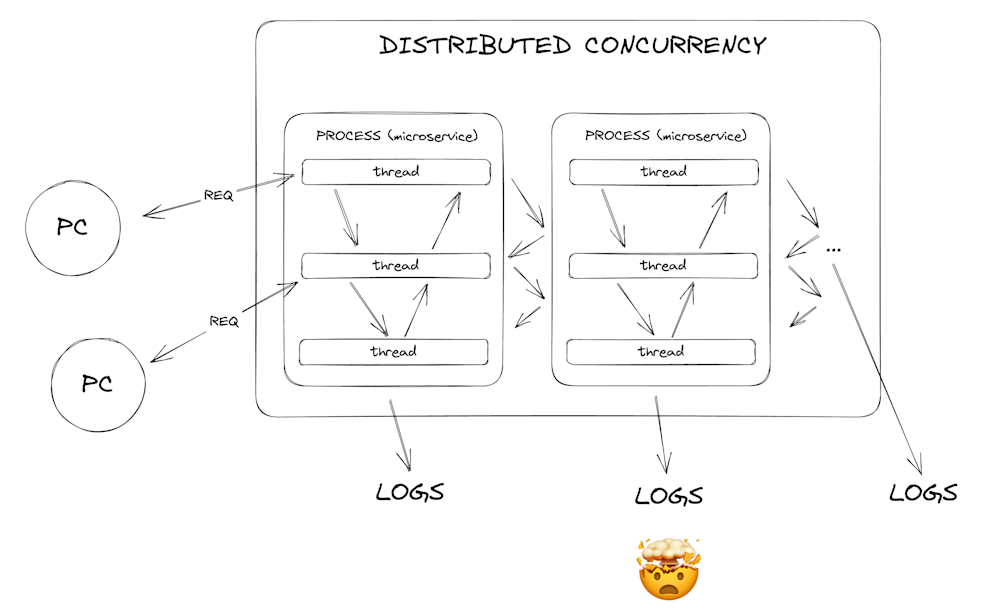
And that’s not the end. About a decade ago, Docker and AWS made way for the containerized services and FaaS (Function as a Service, or Lambdas to be more precise). Now our backend doesn’t even need to live on the same machine. Should we even care about logs? I mean we could see tiny pieces if we look at our services’ logs, but we can’t really see the whole picture. We need to find a way to “distribute” the trace we did in the previous era. Enter: Distributed Tracing.
To be clear, there are “traces” 🥁 of Distributed Tracing dating even back to 2003 in a paper on Magpie, but with the popularization of Docker and AWS the need for Distributed Tracing as a tool grew significantly.
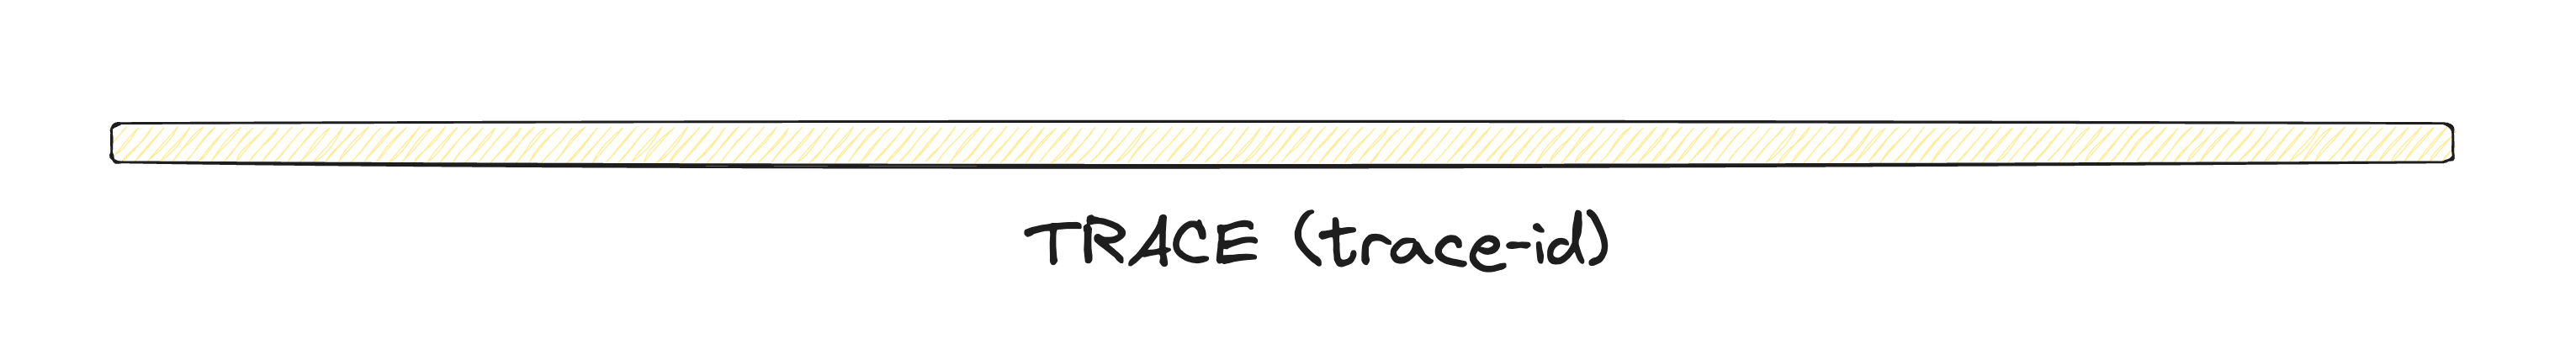
Before we think about distributing the trace, let’s solidify the concept of a trace first. A trace is going to describe the execution flow of a certain request or operation, regardless of where its moving parts live. We’re going to identify that trace with a unique trace ID, so wherever the execution is, it can “attach stuff” to that trace with that ID. Very nice!
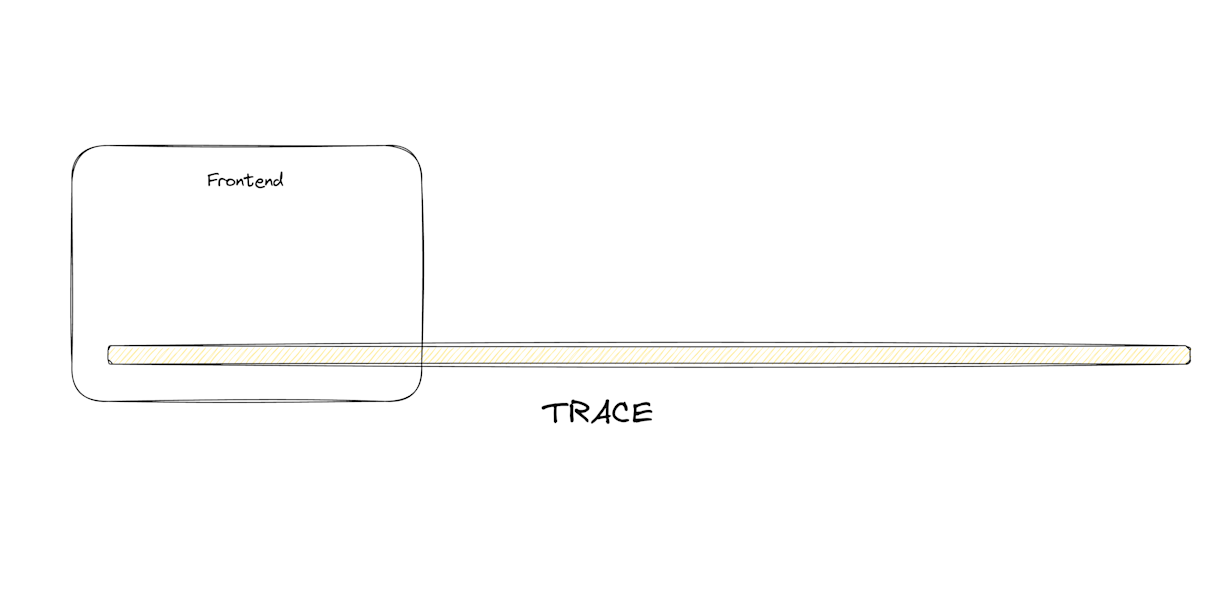
The trace would start when the operation flow we’re looking to trace starts. Let’s say that the operation flow starts on the front end, when a user triggers a certain action.
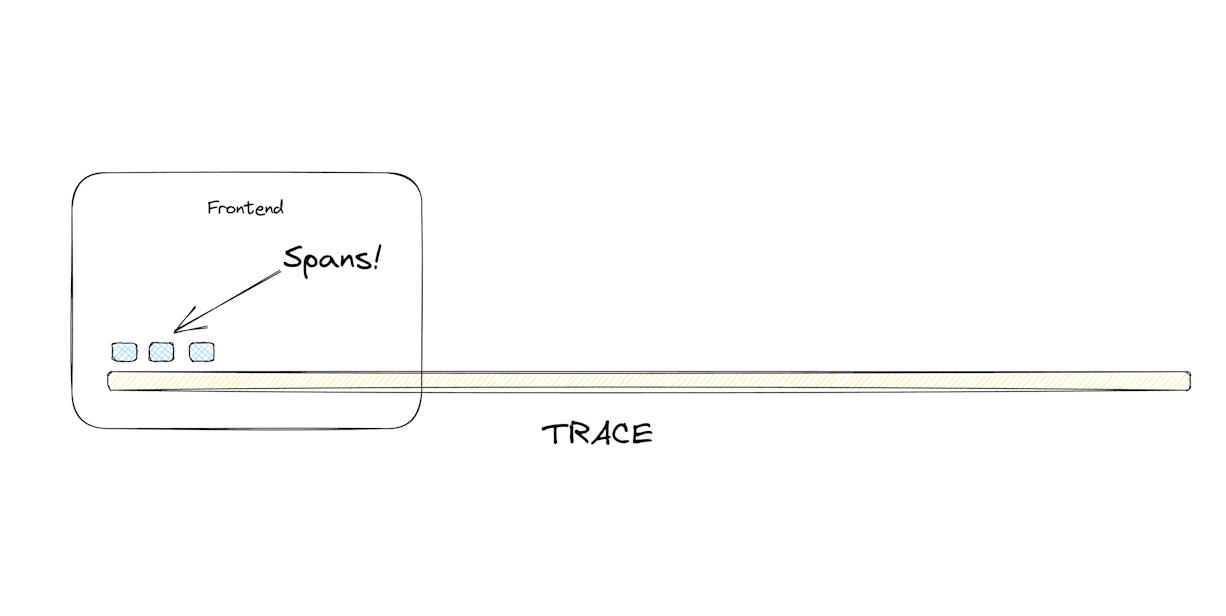
Now let’s create the thing that describes what the execution does at a certain moment. Let’s call it a “span”. Spans will be the smallest unit of work. They can be an HTTP request, or a function call, or whatever our software does at a particular moment. Every trace starts with a root span that gets created at the beginning of the trace.
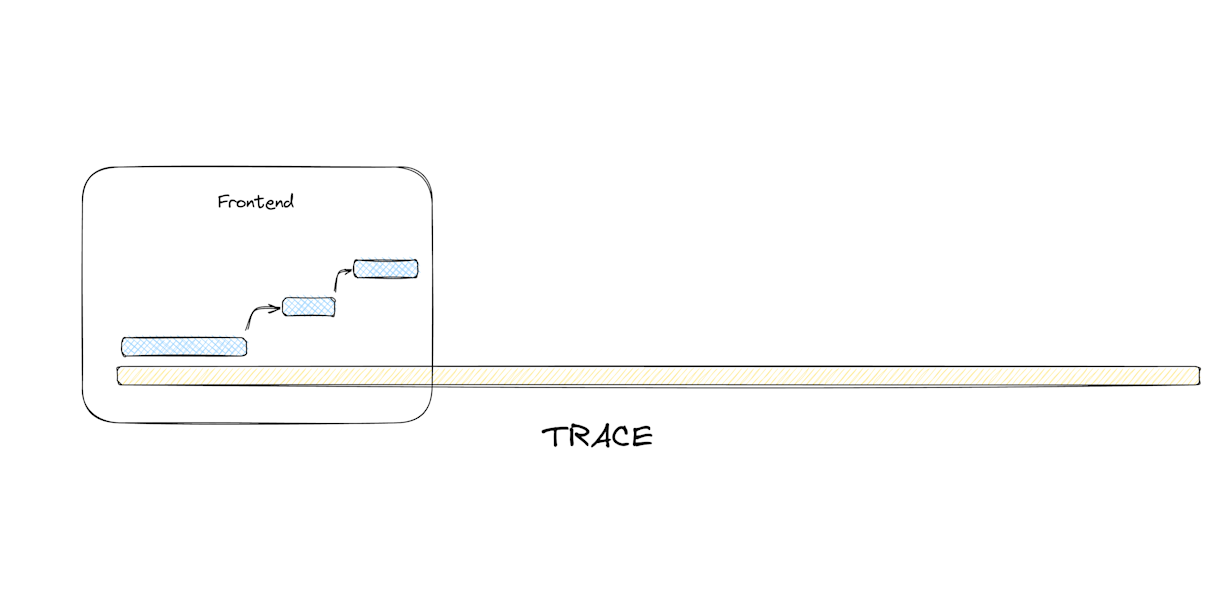
But what if we also made it possible to create spans out of spans? That mirrors our code in a way. We invoke a function, that invokes a different function, that invokes a different function etc… Okay, now we can create span hierarchies to mirror our code as well. Great! Let’s also give them IDs so we know which span gets created out of which one and we’re set. To persist the hierarchy, let’s define a concept called Span Context which is going to be a collection of values attached to a certain span. Let’s keep the trace-id so we know which trace a specific span is attached to, and also a parent-id so we know which is the parent span of a particular span. While we’re here, let’s also create a .finish() method that will stop the span’s internal clock that measures its lifespan (pun intended). Okay so we have a hierarchy of spans that are tied to a certain trace, connected to each other and that also have the concept of length in time. Awesome!
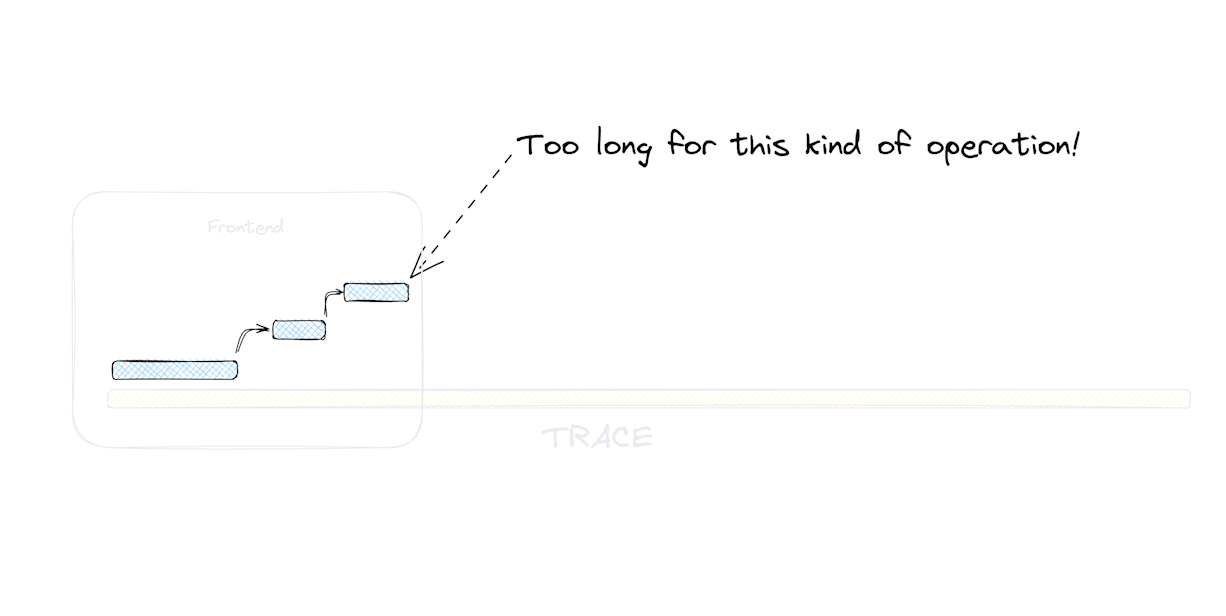
I bet we can create a Gantt chart out of this. Guess what? We can, and we did, and that’s one of the killer features of Distributed Tracing. If we instrument (create spans in specific places) our software correctly and visualize the span hierarchy with their lengths, we can see all the tiny operations that took place and how long they took, and if some of them took longer than anticipated. Hey we can use this to identify performance bottlenecks! Hell yeah!
What if we also added statuses to the spans? Like a success, or cancelled, or not found, or whatever? Now if an error occurs, we can set the current span’s status to any error status like invalid_argument for example and send it as such to the backend. Very nice! Hmm, adding stuff to spans… Well what the hell, let’s also add tags and arbitrary metadata. We can send all sorts of metrics through them! Here’s a crazy idea: let’s get rid of logs completely (whaaat), and store the data within the spans instead of logging it out. Okay, so we ended up with spans containing a parent span ID from which they were created from, an operation name that describes what they do, a start and end timestamp that describes how long they took, a status that mirrors the operation status, we can throw in a description as well, an array of tags that we can later search or filter spans with, and an arbitrary structured metadata that we can fill with just about anything that’s relevant to that span.
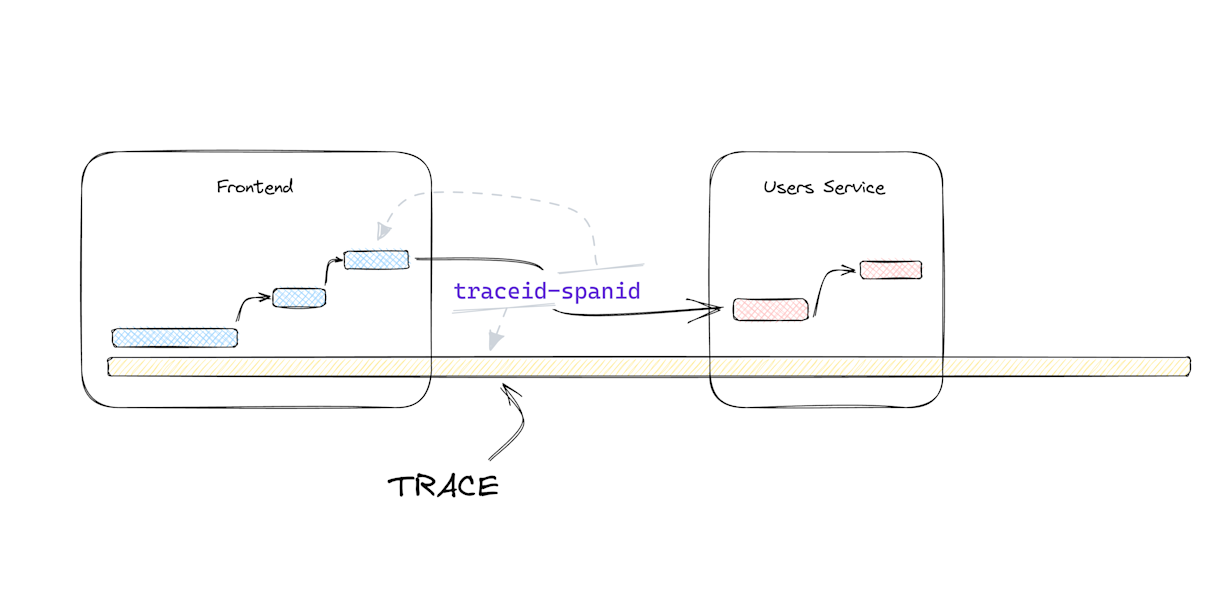
Now we just need to find a way to link everything and we’re pretty much done. So we got the trace and its trace ID. We also got spans and their span ID. What if we took the last span’s ID and glue it to the trace ID like [traceid]-[spanid]? That’s a good way to mark which trace is ongoing, and what was the last span that took place so we can continue the trace. That works! And it’s also a string which send it to the backend as an HTTP header. Let’s call this header the Trace Context (it's actually a W3C Standard). Then in our backend we’ll parse the trace context and create a new span that’s linked to the parsed trace ID and span ID. Now we can continue instrumenting on the backend, and have everything connected to the same trace! We just distributed the trace! Alright! 💃
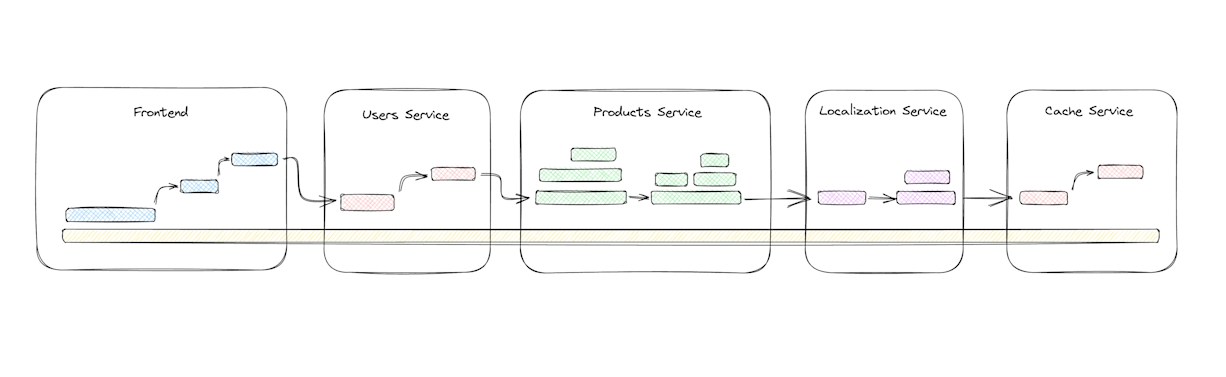
We can throw the trace context between all our services this way. It’s a string! We can send it through headers, or store it either in memory or file, and have a different service pick it up later. Whatever happens, as long as we’re linking to a specific trace id, we’re going to keep adding our spans to that particular trace and view the whole operation flow later on. Whether it’s a client, or a micro service, or a Cron job, or it’s JavaScript, or Python, or PHP, or Kotlin, as long as we can send the trace context from one point to another, we can trace any operation flow in our software. And that’s distributed tracing!
Conclusion
So let’s do a quick recap. Because we kept evolving our libraries and frameworks, we had to do the same for our debug tools. At some point, logs stopped working for us developers, so we invented Distributed Tracing. DT enables us to follow the execution flow of specific requests using unique trace IDs and spans, providing us with insights into the tiniest operations. By creating and distributing the tracing context across services and platforms, we can seamlessly track the entire journey of our apps, and identify performance issues and errors with ease. With Distributed Tracing having our backs, we can easily navigate the complexities of our modern apps, and quickly figure out where the performance issues come from, or when something goes wrong within our system. Awesome!
Btw, check out Sentry’s Distributed Tracing feature. It’s literally all you need.


