Harnessing Distributed Tracing for Application Performance Optimization
Harnessing Distributed Tracing for Application Performance OptimizationDistributed tracing is a powerful technique that allows you to track the flow and timing of requests as they navigate through a system. By linking operations and requests between multiple services, distributed tracing provides valuable insights into system performance and helps identify bottlenecks. In this blog post, we will delve into the benefits of distributed tracing, explore its relevance for various application architectures, and uncover how it operates behind the scenes.
Additionally, we'll examine the essential components of distributed tracing, such as traces, transactions, and spans, and discuss the propagation of trace context for achieving distributed tracing. Let's unravel the mysteries of distributed tracing and gain a deeper understanding of this indispensable tool for application performance optimization.
What is Distributed Tracing? Benefits and Applications
Distributed tracing is the process of tracking the flow and timing of requests as they pass through a system. It helps you understand the performance of the system and identify any bottlenecks. Essentially, it allows us to link the operations and requests that occur between multiple services.
So, what are the benefits of distributed tracing? Firstly, it provides you with a clear view of the entire operational flow of a specific action, from the frontend or mobile interface to the database. This visibility allows you to identify performance bottlenecks throughout the entire application stack. By pinpointing these bottlenecks, you can improve the quality and reliability of your service.
Now, let's discuss who needs distributed tracing. If your application is built on microservices or serverless architecture, distributed tracing is essential. These architectures bring their own advantages but also introduce challenges such as reduced visibility. Distributed tracing serves as a perfect remedy in such cases.
However, even if your application is not built on microservices or serverless architecture, the benefits of distributed tracing still matter. Every developer wants to identify performance bottlenecks, regardless of their application's architecture.
Deep Dive: The Inner Workings of Distributed Tracing
Now, let’s explore the inner workings of distributed tracing and understand how it operates behind the scenes.
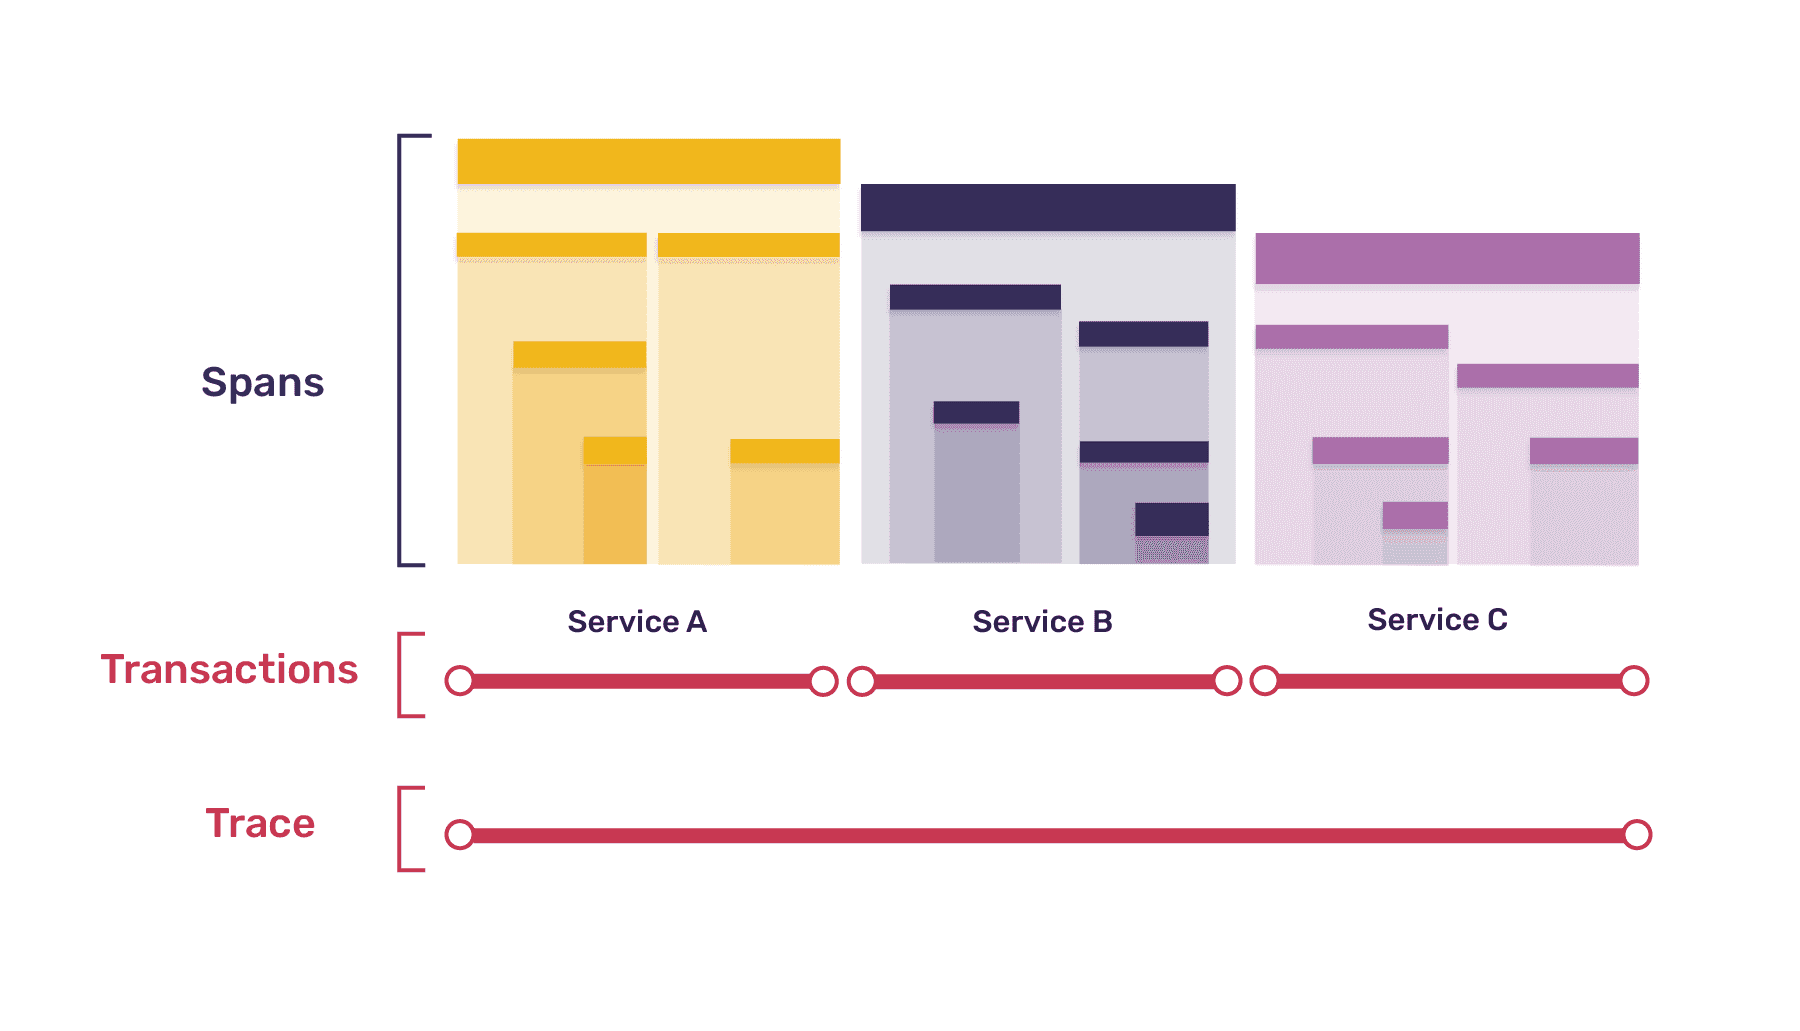
To begin, let's take a look at a diagram that illustrates the various components involved in distributed tracing. At the core of it all is the trace, which represents a log of events occurring during the execution of a program. Think of it as a chain of operations performed during a specific task.
Diagram illustrating how a trace is composed of multiple transactions, and each transaction is composed of multiple spans.
Every trace is uniquely identified by a UUID (Universally Unique Identifier). This trace identifier allows you to differentiate between different traces. Moving on, you have transactions. A trace consists of multiple transactions, each representing a different part of your application, such as the frontend, backend, or database. A transaction describes the operations carried out within a specific entity. For instance, it could be an API handler on the back-end.
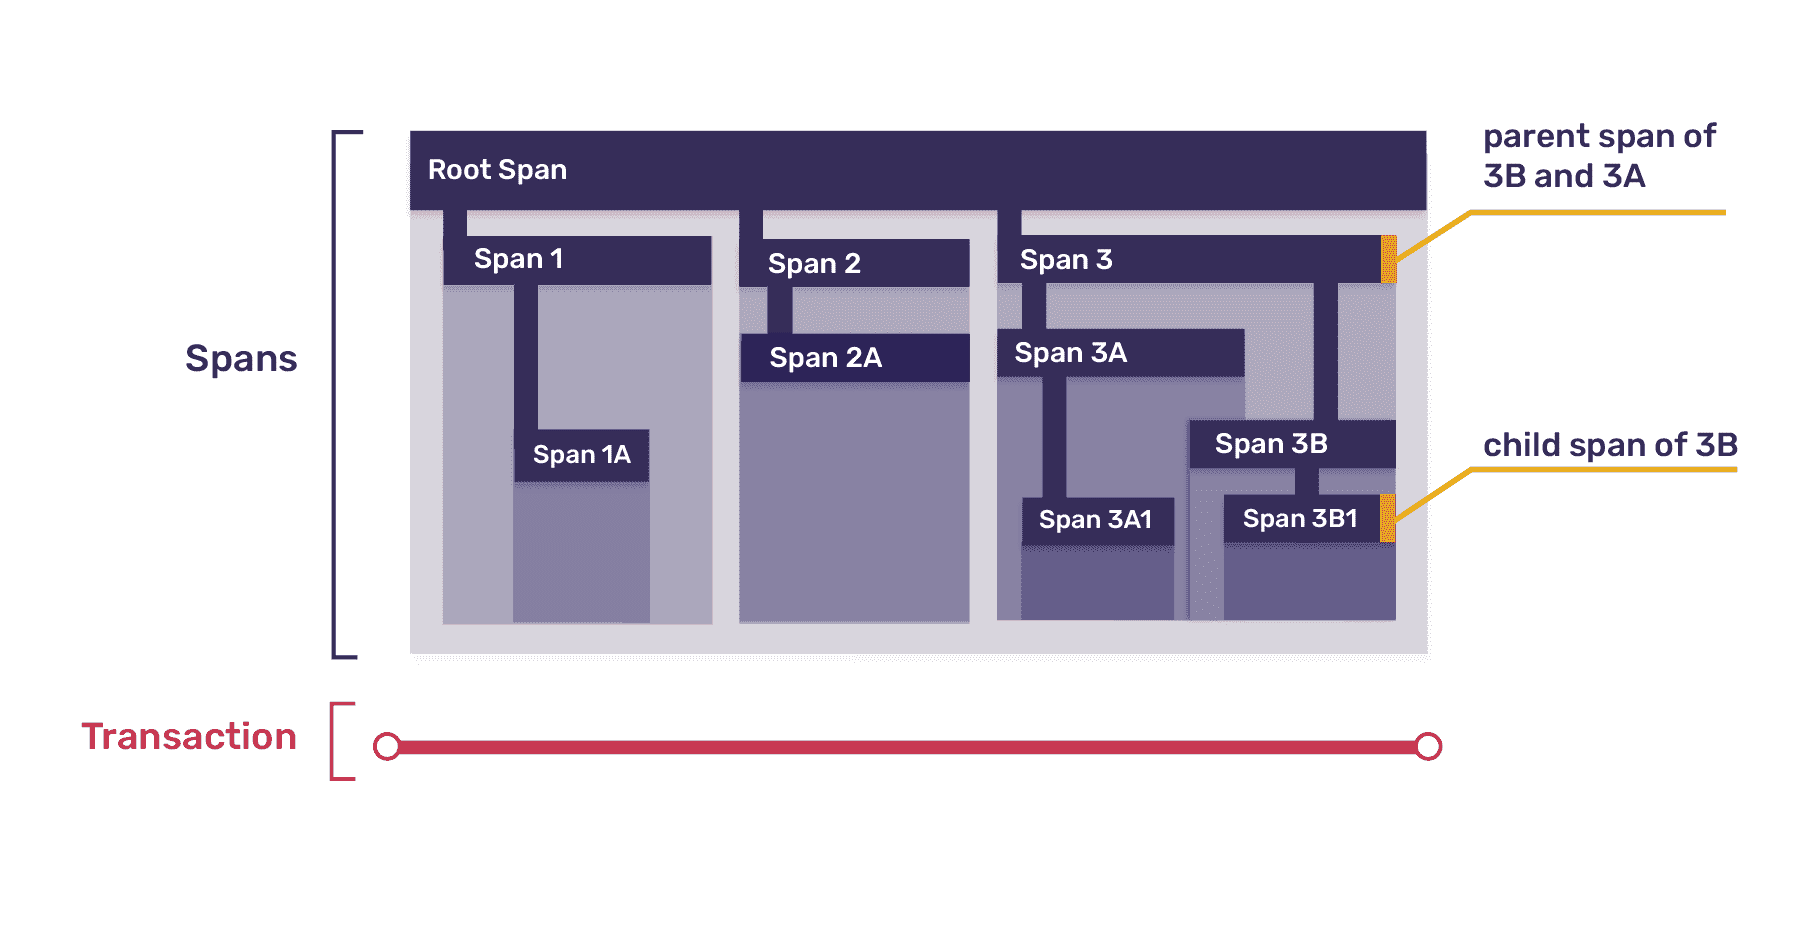
Within each transaction, you have spans. Spans are the atomic units of work and represent individual resources being loaded, UI component lifecycle events, file I/O operations, requests made to external services, and more. Since transactions follow a tree structure, top-level spans can be further divided into smaller spans, mirroring the way one function may call several smaller functions.
Diagram illustrating the parent-child relationship between spans within a single transaction.
Imagine the root span as a function calling three different child spans, each potentially representing a separate function. These child spans can then call four more functions, and so on. Each span requires its own span identifier, created as a UUID when the span begins its operation.
Now, let's examine a real-world example to better understand how distributed tracing works. Consider a page load event triggered by the browser when a user lands on a page. In this scenario, you have three services involved: the browser, the backend, and the database — each service has its own transaction.
The browser, besides rendering the page, sends an API call to the backend to fetch the page's data in JSON format. To retrieve the data, the backend sends a query to the database server. Finally, the database returns the requested data to the backend, which then transforms it into JSON format and sends it back to the page. Throughout this process, transactions are created for each service involved.
Now that we've covered what a trace consists of, let's explore how we make it distributed. To achieve distributed tracing, our application must propagate the trace context between transactions. So in our previous example, the browser will send the trace context to the backend through the headers, so the backend will know which trace it should contribute spans to. The backend can also send the trace context to any other services it uses, or in this case, just measure the db queries using spans for each of them. At the end, the backend doesn’t necessarily need to return the trace context back to the client, because that’s where it originates from.
The trace context includes three values: the trace identifier, the parent identifier (which corresponds to the span identifier of the parent span), and the sampled value. The sampled value determines whether a particular transaction should be included in the trace. It can be set as no value (deferred decision), 0 (do not sample), or 1 (sampled). By passing the trace context, our services know to which trace they should append their transactions and spans.
And that's a wrap! If you’d like to learn more, check out the distributed tracing video series I created here.


