Django Performance Improvements - Part 2: Code Optimization
Django Performance Improvements - Part 2: Code Optimization
The following guest post addresses how to improve your services’s performance with Sentry and other application profilers for Python. Check out this post to learn more about application profiling and Sentry’s upcoming mobile application profiling offering. We’re making intentional investments in performance monitoring to make sure we give you all the context to help you solve what’s urgent faster.
For those who are new to profiling, application profilers augment performance monitoring data by capturing every single function call taking place in a given operation. As you’ll read below, profiling data can be pretty difficult to analyze on its own. When combined with Sentry’s Error and Performance Monitoring, developers get insights into not only what’s slow, but also the function calls that may be the root cause.
Developers continually optimize for performance as it helps applications run faster and make users happy. Code optimization is a technique that is applied to improve the quality of code and efficiency.
Code optimization involves writing code that takes the least time to execute
In this second part of Performance in Django applications, we will look at ways to diagnose slow code and increase the speed and performance of Django applications.
We will cover how to perform code optimization by following the following principles
Performance Insights with Django debug Toolbar
Profiling
Persistent Database Connections
Asynchronous requests
Task Scheduling
Optimizing Django Serializers
Third-party Dependencies
Performance Insights with Django debug Toolbar
To properly optimize your code in Django applications, you will require some performance insights that can help with code optimization, such as:
number of queries running at any given time and the time spent on each query
cached queries, etc.
You can obtain this information by installing the Django Debug Toolbar in your Django applications via pip.
python -m pip install django-debug-toolbarOnce installed, add it to the list of installed apps in settings.py as shown below.
INSTALLED_APPS = [
    # ...
    "debug_toolbar",
    # ...
]
Next, add Django Debug Toolbar urls to the main urls file
from django.urls import include, path

urlpatterns = [
    # ...
    path('__debug__/', include('debug_toolbar.urls')),
]
Lastly, add the Django Debug Toolbar middleware as in setting.py
MIDDLEWARE = [
    # ...
    "debug_toolbar.middleware.DebugToolbarMiddleware",
    # ...
]
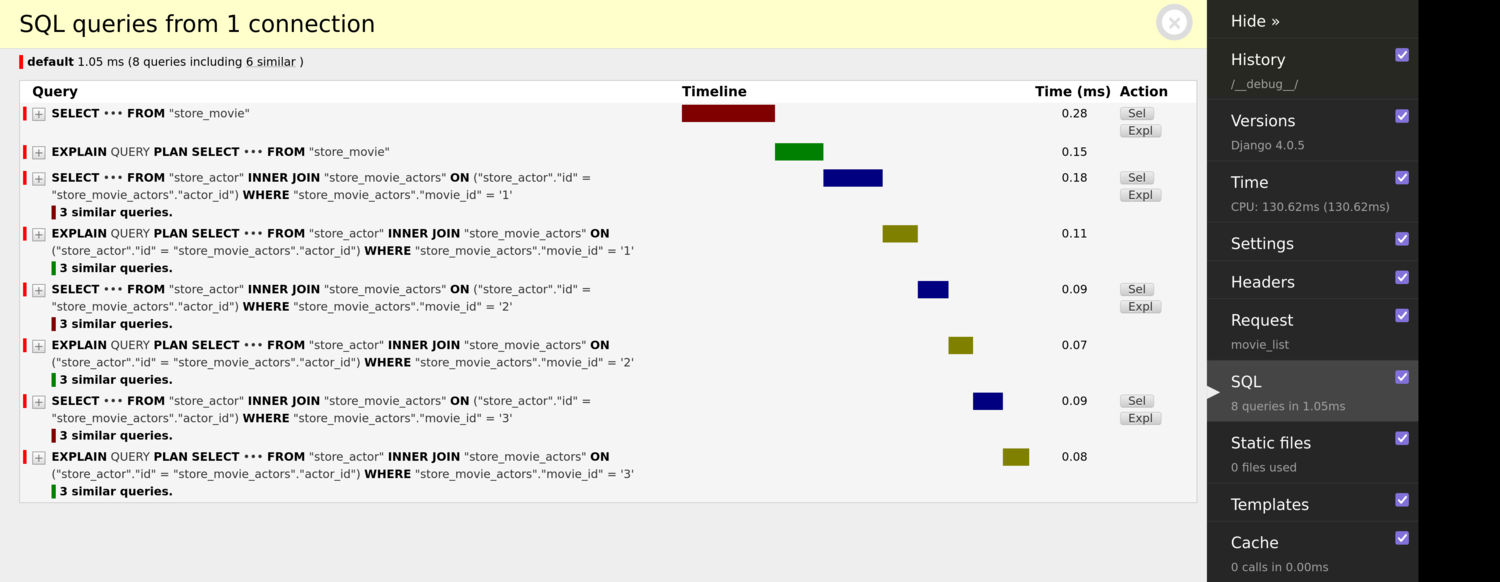
Below is a screenshot of the Django Debug Toolbar in action.
From the insights obtained from Django debug toolbar, you can identify which parts of your code need optimizing.
Profiling
Code profiling is a technique used to determine how programs use resources such as RAM, time to execute, etc.
Profiling is done to diagnose what part of your code takes a long to execute and should ideally be the first step in any code optimization operation.
If the program runs at optimal speed, there is no need for optimization; however, if certain parts of your code take too long to execute, you can start optimizing for better performance.
Python has a built-in profiler called cProfile, a C extension recommended for most users; it is also suitable for profiling long-running programs. It's easy to get started, and you can begin profiling fast by using the run() function.
For example, here is how you would use the cProfiler on a simple python code:
import cProfile
import numpy as np
cProfile.run(np.sum(np.arange(1, 1000)))
Profiling Django applications
Django-silk is a profiling tool that makes adding profiling ability to your Django applications easy. To enable profiling with django-silk, you first need to install it with pip.
pip install django_silkOnce installed, add it to settings.py as shown below.
MIDDLEWARE = [
    ...
    'silk.middleware.SilkyMiddleware',
    ...
]

INSTALLED_APPS = (
    ...
    'silk'
)
Next add it to the urls.py file to enable the user interface
urlpatterns += [path('silk/', include('silk.urls', namespace='silk'))]Apply migrations:
python manage.py migrateOnce done with the configurations, django-silk will intercept all http requests, and you can access the performance.
What next after profiling?
Once you have identified the part(s) that take too long to execute, you can optimize what is needed.
In some cases where profiling doesn't make any significant change, you might need to redesign the code from scratch, though this will take considerable effort. Complete code restructuring should, however, be the last resort.
When done right, code profiling can significantly improve performance and boost execution time.
Persistent Database Connections
By default, Django will automatically establish a new connection to the database in each request and close it after execution. This process of opening and closing database connections uses more resources than expected.
To maintain persistent connections in Django applications, add CONN_MAX-AGE in settings.py as shown below:
DATABASES = {
    'default': {
        ...
        'CONN_MAX_AGE': 500
Alternatively, you can use connection poolers such as pgBouncer and Pgpool. Database connection poolers open and close the connection requests, allowing the database to hold several connections at any given time.
Scheduling Tasks
Scheduling tasks is essential if you have no control over how long a process will take to execute. For example, suppose a customer requests some data to be sent via email using an external email provider. It would be best to schedule such tasks since the email provider may take a while to respond.
The heavy stuff can cost you your performance; hence, running them in the background is advisable, and the user can continue using the site.
Django supports celery, which is a task queue management tool.
The first thing is to install celery via pip:
pip install celeryCelery needs a message broker to transport and receive messages from celery. Redis is the most commonly used message broker.
Here is how you configure celery with redis and create a task:
from celery import Celery

# Create celery instance and set the broker location (RabbitMQ)
app = Celery('tasks', broker='redis://localhost')

@app.task
def generate_statement(user):
# fetch user data

# prepare a pdf file

# send an email with pdf data
The whole process of generating the report is added to a queue and processed by celery workers, freeing up the app's resources. The celery workers should be run beside the django application web server.
Third-party Dependencies
Third-party dependencies can add unnecessary overload on your code and cause your application to run slow. It's essential to ensure your Django application does not rely on too many unnecessary packages. For improved code performance:
Always ensure external packages are up to date
Replace poorly performing packages with better alternatives
Build your own packages that optimize performance
To diagnose third-party dependencies slowing down your Django application, you can use monitoring tools such as Sentry, which gives you an overview of slow API calls.
Other Optimization Methods
Loops
Loops are used in all programming languages to construct code that must repeatedly execute by looping over elements in a sequence.
Loops can add a significant overhead to your code. Instead, use map() function where needed. The map() function also saves memory. While a loop stores the list in memory, map() function will only store one item in memory at any given time.
import timeit

a ='''my_list = range(1,10)
for i in my_list:
    if i %2 ==0:
        result = i**2
loop_time= timeit.timeit(stmt=a, number = 10000)
print(loop_time)
#result is 0.0116
import timeit

b = '''my_list = range(1,10)
result = map(lambda x: x**2, filter(lambda x: x%2 ==0, my_list))
map_time= timeit.timeit(stmt=b, number = 10000)
print(map_time)
#result is 0.0034
From the comparison above, map() function is much faster than a for loop.
Use the latest python version.
This my seem obvious, but it's always advisable to use the latest version of python. Python 3.11 is up to 10-60% faster than Python 3.10.
Use NumPy
NumPy is the fundamental package for scientific computing in Python. Numpy provides the numpy data structure, which performs better in speed and efficiency. Numpy arrays are faster than Python lists and take up less space.
We have shown you how to diagnose slow parts in your Django projects and make them faster. We will now cover how to use Sentry to monitor the health of your Django application and identify the slow database and http requests.
How to Monitor Performance
Sentry provides a diagnostic metric that shows you where your application is slow and how to solve it. It does this by showing a performance dashboard that features the total time taken by each request-response cycle as well as the level of satisfaction of your users.
Start by installing sentry via pip in your django application
pip install --upgrade sentry-sdkNext, add the sdk in settings.py file as shown below.
import sentry_sdk

def traces_sampler(sampling_context):
sentry_sdk.init(
    dsn="https://examplePublicKey@o0.ingest.sentry.io/0",

    traces_sample_rate=1.0,

    traces_sampler=traces_sampler
)
The traces_sample_rate above can add substantial overhead when used in production and, therefore, should be adjusted.
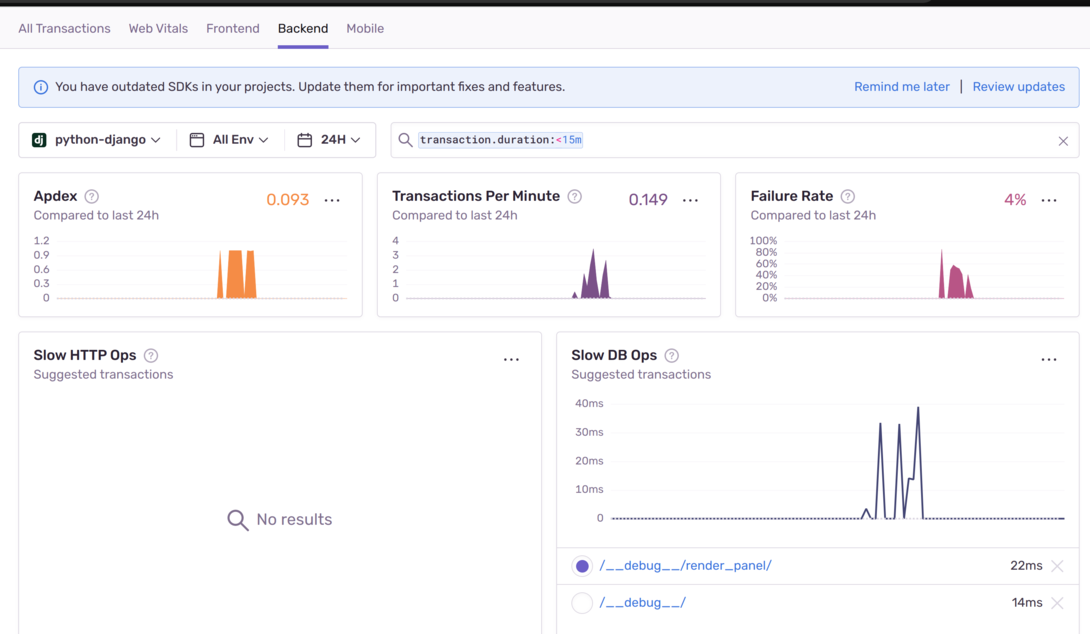
The Sentry dashboard will look like this:
Here, we can start collecting insights and taking action. For example, if the average time taken by a user to access a resource exceeds the average time, the user misery metric will be high (see the below screenshot):
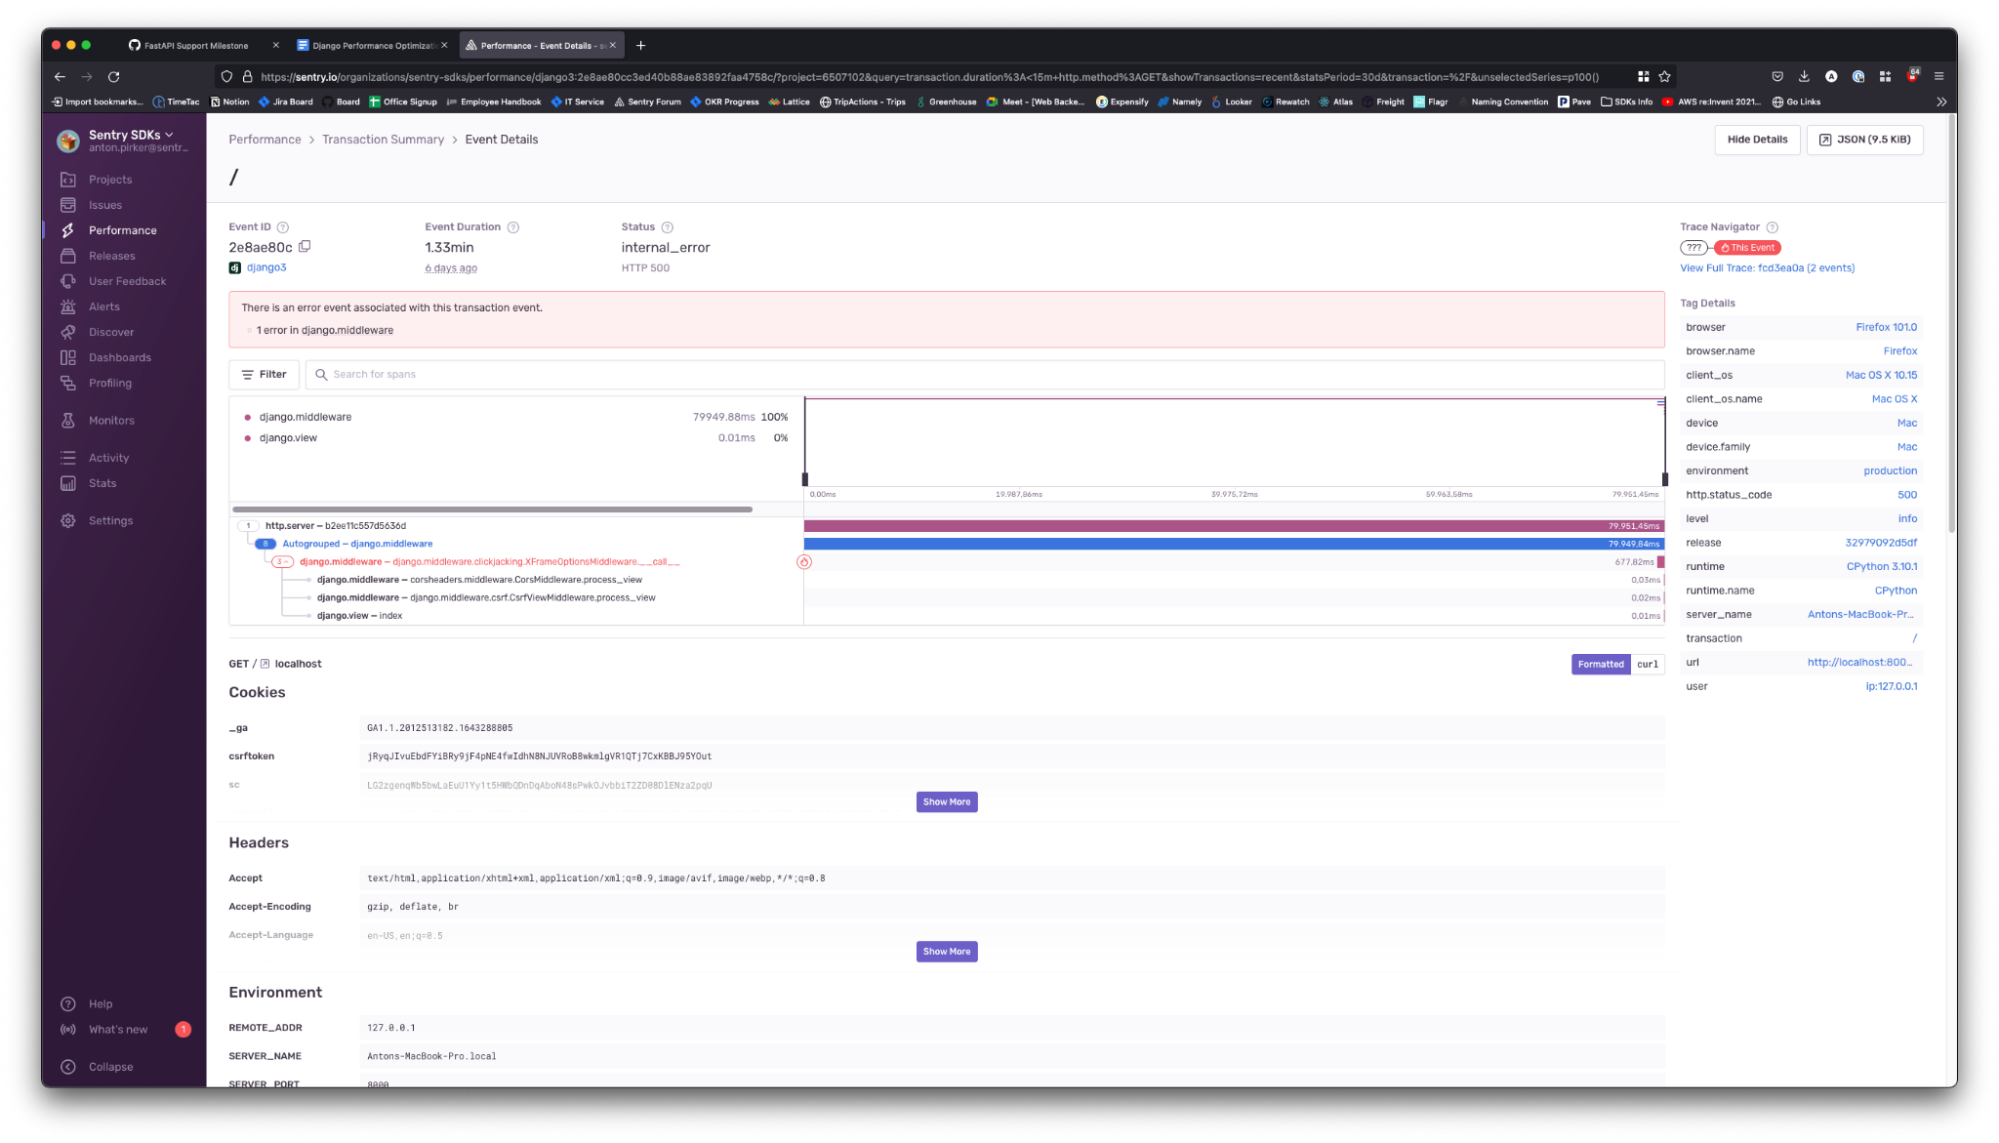
You can also see detailed information of every request such as the time taken to get a response:
Conclusion
You see, with some minor optimizations, you can significantly enhance the performance of your Django project, but code optimization does not ever stop.. As your application grows, you might encounter serious issues which might not be able to be covered by the first iteration. Therefore it's necessary to keep updating the code optimization techniques in every application stage. It's also essential to avoid premature optimization. Premature optimization is where code is optimized before you even figure out how it performs in a production environment.
The first step in any optimization process is to profile to ensure the high performance of the code. Then you can use the same practices to write high-performance code.The first step in any optimization process is to profile to ensure the high performance of the code. Then you can use the same practices to write high-performance code.
As the application grows, each stage will require a different optimization technique.


