Find slow database queries with Query Insights
Find slow database queries with Query Insights
There’s only so much you can control when it comes to your app’s performance. But you control what is arguably most important - the code. Sentry Performance gets you the code-level insights you need to resolve performance bottlenecks.
Query Insights is the first of many new performance-centered workflows we plan to roll out over the coming months to help you understand where time is being spent in your application, how it’s hurting your user’s experience, and give you the context you need to fix the right performance issue – not all long-running queries are bad, just the ones associated with heaps of support tickets. Join the GitHub Discussion - we’re posting regular updates on what we’re building and are always looking for feedback.
Find (and fix) that slow query quickly
Users logging in, searching, signing up, filtering, sorting, and even sending a notification – any time a record is updated, added, or deleted in some form or fashion your users are hitting one of your many databases. Your users can’t tell/don’t know/don’t care that searching for “beige fall hoodies” is actually really hard - not because beige anything is questionable, but because you have to somehow have the guardrails in place to automatically craft the perfect query that returns results as fast as possible. As we all know… slow is the new down… err latency is the new outage. You get the picture.
Say you do work for an online retailer, as a backend developer, you’re probably tasked with making sure product search is fast. While poor performance could be due to a caching issue, overloaded servers, API errors, or more – which shamelessly, some which Sentry can help you with too, but for the purpose of this post and to give you an idea on how to use Query Insights, let’s chalk it up to terrible SQL.
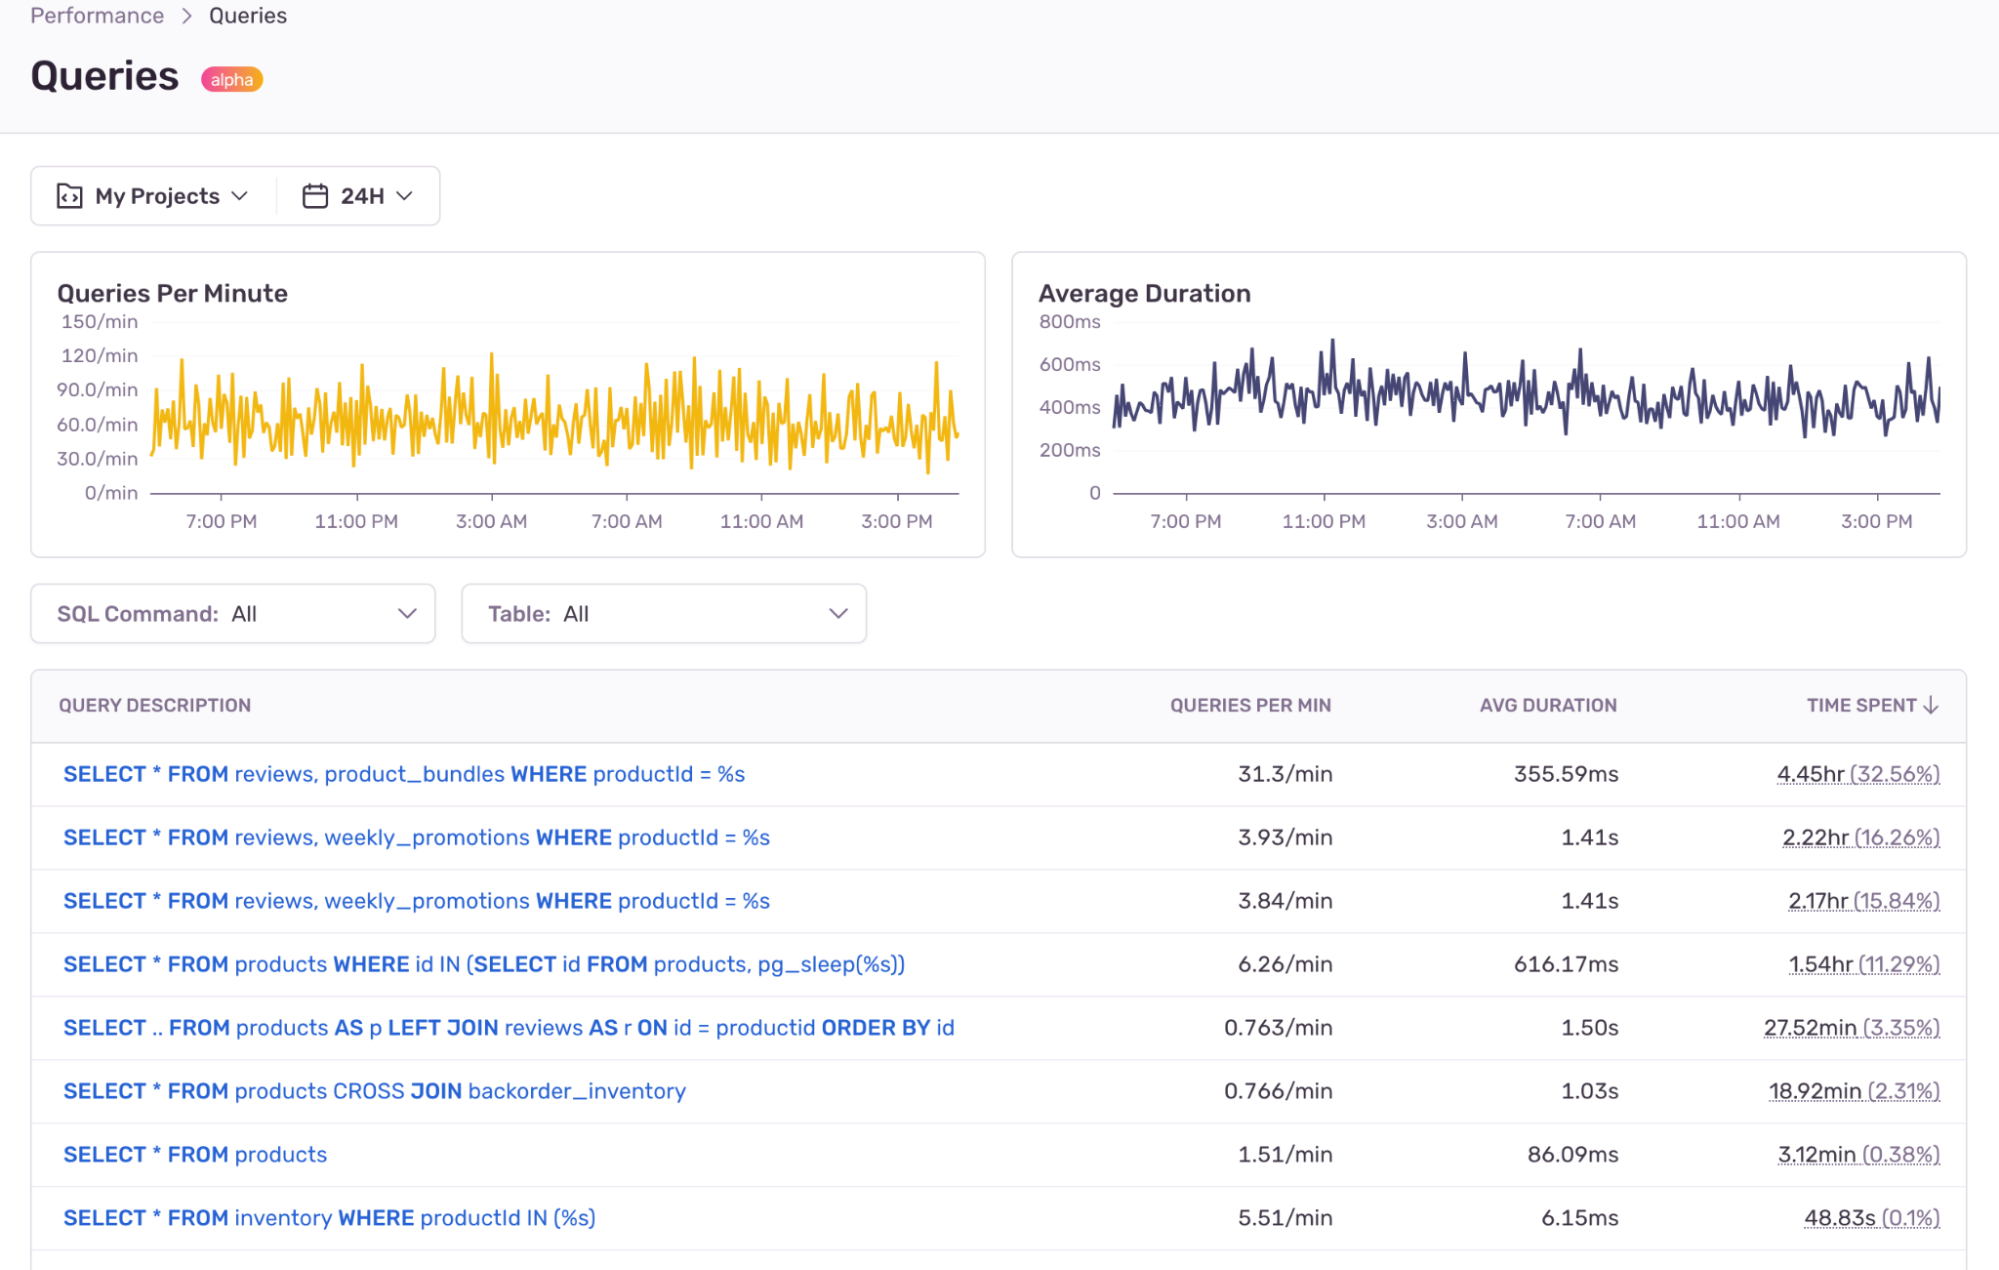
To see if a database query is behind the performance issue, click on the Queries from the left navigation menu under Performance. Here you can see if and when there’s been a recent change in frequency and average duration across all database queries. The data we serve in Query Insights is metrics-based - meaning it’s based on 100% of the events you send to Sentry, not just sample events. This gives you a more complete, accurate, and actionable data set to work off of so you can figure out exactly when a performance regression happened.
As expected, you see a database query that could be related to the search experience taking longer than it should. When you select the query in question, you’ll land on the Query Summary tab where you can see the exact query with syntax highlighting. But is this the query influencing the API endpoint related to search? The graphs and tables below have the answer.
Impacted API endpoints
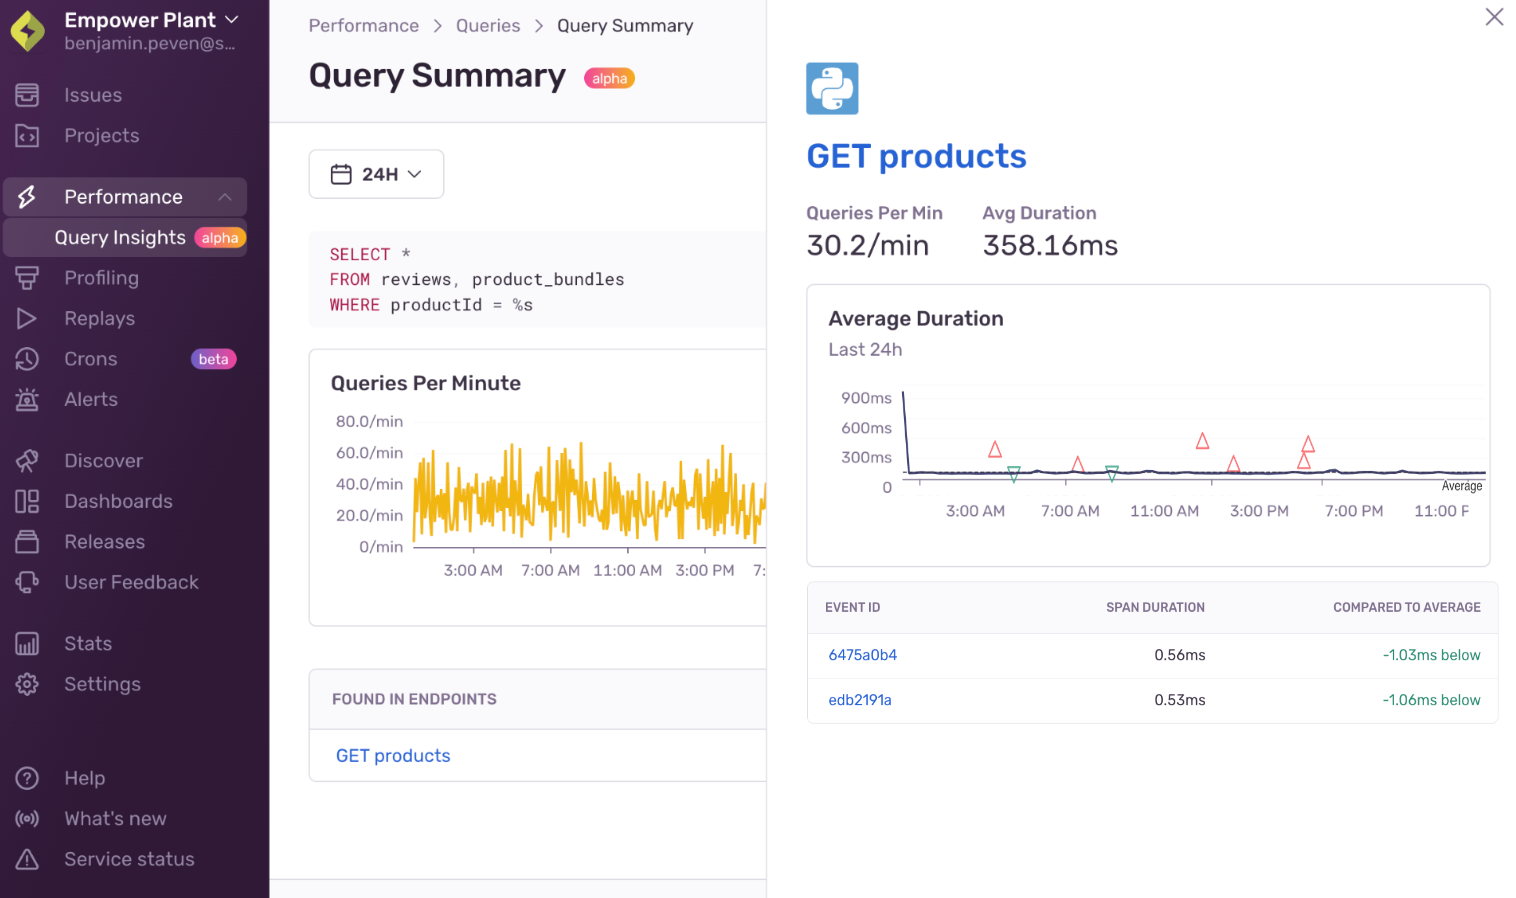
Just like on the Queries tab, you’ll see duration and throughput summary graphs showing when the query’s performance started to degrade. The table below contains a list of API endpoints in which the query was run. Bingo - the query you selected is impacting the API endpoint related to the search experience. In this case, it’s pulling user reviews to display alongside the products.
Select the API endpoint to see the average duration of that API endpoint over time. The green (faster) and red (slower) triangles are sample events that correspond to the event list in the table. The sample events in the table (the triangles) are plotted against the moving average duration over time (solid line) and average baseline over the entire period (dotted line). When you hover over a triangle in the graph it’ll highlight the event ID in the table. This will help you identify sample events that are doing better or worse than what’s typical.
When you select an event ID, you see details for the transaction and the span waterfall, with the specific query highlighted. Not bad, right?
Did you fix it?
Based on reviewing the syntax and span waterfall you pushed updates around denormalizing the schema and limiting joins to essential table relationships. Can you tell if your fix actually solves the issue?
To know for sure, open Query Insights, and select the same query to see if query duration dropped. If the query’s duration decreased, then the duration of the API endpoint related to the search experience should have decreased as well. To be certain that the change resulted in a faster search experience, you need to select the impacted API endpoint from the table below. If fixing the query improved the overall performance of the API endpoint related to the search experience, you should see the moving average (solid line) go down.
Improving database performance
Query Insights allows you to drill down from high-level query metrics across your database to individual slow queries affected endpoints, and finally debug based on event context. With this level of query visibility, it’s easier to pinpoint when and where database slowdowns occur.
This workflow is the first of many upcoming improvements to Sentry Performance meant to help you quickly find out when different parts of your application are slow and serve the data you need to fix it. Please share any questions, comments, concerns, or ideas you have with us on GitHub Discussions or shoot us a note on Discord — we’re all ears.


