Five improvements to Make Debugging Less Terrible
Five improvements to Make Debugging Less Terrible
Over the past year, we released a couple of new offerings, like Session Replay and Cron Monitoring. But in addition to building new products, we’re constantly looking for ways to improve our core platform to help you debug software issues faster. As you hopefully saw during Sentry’s Launch Week, we shipped five quality-of-life improvements addressing the following problems:
How do I make sure the files I touched don’t have open issues?
How can I trace a front end problem to a server-side error quickly?
Here's the latest.
How do I make sure the files I touched don’t have open issues?
Issue review comments in GitHub
When you open a pull request in GitHub, Sentry will now comment with any existing, unhandled issues caused by the code you’re changing. That means if the files modified as part of your PR have any open error or performance issues against them, you can better understand the risks with your proposed changes or take a minute to fix a few things – why not, you’re already in there 😉.

Check out our docs and this GitHub discussion to learn more.
What should I do if my code does not work in production?
It's mind-boggling that with all the advancements in CI/CD tooling and practices, only 30% of companies surveyed by the CD Foundation deploy on a daily basis. It seems like one of the biggest reasons why developers are not pushing to production more frequently is not knowing if their software will actually work in production.
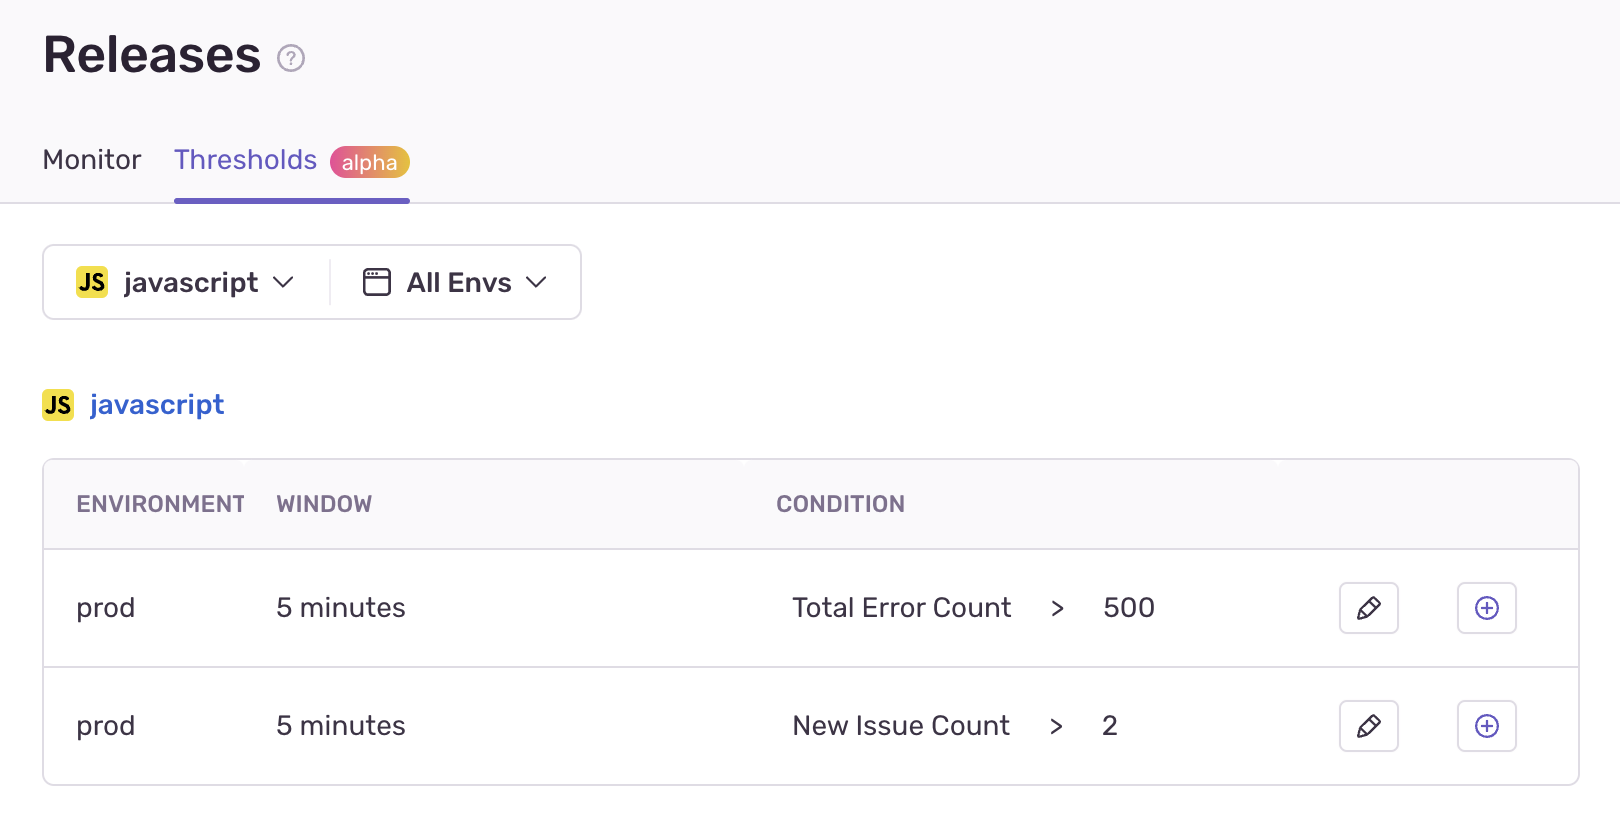
With the latest updates to Release Health, we can literally tell you if your software is working in production the second the deployment goes live and tell you how healthy the release is.
Bad release detection
We’ll show you if a release is unhealthy on our Releases page and our Release details page so that all team members involved in the release can see what went wrong and investigate. You can set up your own thresholds based on errors, issues, and even crash rates to determine the health of a release.

You can also retrieve the statuses of release thresholds by polling our new API in your CI/CD pipeline to easily detect bad releases based on your set thresholds and better automate your deployment decisions. (Stay tuned - soon we’ll fire notifications and webhooks when Sentry detects bad releases).

How can I reduce context switching?
Slack integration enhancements
Bad release detection isn't the only way we're trying to get you to what matters faster. Our Slack Integration allows teams to get alerted on new and important issues in your codebase. We added more context to these alerts so that you get the right information about your bug at the right time and in the place you work. Our updated Slack notification shows more details about the issue and gives you access to some common actions right within your Slack client. Now you’ll see:
Event and User Counts
Suggested Assignees
And be able to:
Add notes and rulebook URLs
Get options for how to archive an issue
Search on the assignment selector (so you can search for any team member to assign the issue to)

With the ability to assign, resolve, or archive issues directly from Slack with way more data - resolving, punting, and prioritizing what to fix next is a whole lot less painful.
Embedded Replays in Issue Details
As you scroll through Issue Details, you’ll now find a replay embedded on the page. Because Session Replay helps you repro issues by providing reproductions of user sessions in a video interface, you can now see what happened leading up to and after a user experienced the issue and debug faster– without leaving the issue details page.
How can I trace a front end problem to a server-side error quickly?
Improved Trace Navigator in Issue Details
We updated Trace Navigator on every Issue Detail page to make it easy to visualize where a particular error was detected in a trace, as well as what other issues could be related to this error. This enables you to clearly answer the often nebulous question, “is a backend error causing problems in my frontend?” without rolling your face on the keyboard.

For more details on our tracing improvements and all the major updates to Performance Monitoring, check out what we announced on Day 2 of Launch Week.
Conclusion
We’re doing our best to help you break production less. From new Performance features to introducing AI-enabled code review and Autofix, along with the platform updates listed above – I want to think we made a little progress in making debugging less terrible.
To stay up-to-date on the latest from Sentry, check out our Changelog for a running list of all product and feature releases. You can also drop us a line on GitHub, Twitter, or Discord. And if you’re new to Sentry, you can try it for free today or request a demo to get started.


