Fix slow mobile apps before your users uninstall with Mobile Vitals
Fix slow mobile apps before your users uninstall with Mobile Vitals


Mobile devs know the struggle. Small regressions can cause big issues in production, and fixing them isn't as easy as pushing a quick patch. Unlike a web app, shipping fixes for apps means navigating app store approvals, and often hopping on meetings with customers to debug because mobile issues can be so challenging to recreate.
Catching these issues before the 1-star reviews roll in is crucial. Luckily, Sentry just made it easier than ever.
Mobile Vitals - our latest addition to the Insights feature - highlights your slowest app starts, screen loads, and renders, so you can quickly tackle frozen or laggy interactions before users rage-quit. Whether you're building with React Native, Flutter, Android, or iOS, let's dive into what you can do with it.
(P.S. We first wrote about mobile vitals years ago—if you're curious about how this new tool works under the hood, it's a good read.)
What does Mobile Vitals track?
1: App Start Performance
You’re doom-scrolling Instagram recipes and suddenly a great ad for a calorie counting app pops up. You download it out of curiosity, and for some reason, it takes 20 seconds to boot up the first time, and 10 seconds every time after that. What are you gonna do - keep forcing yourself to go through that every time you pop another Oreo, or just go back to the scale?
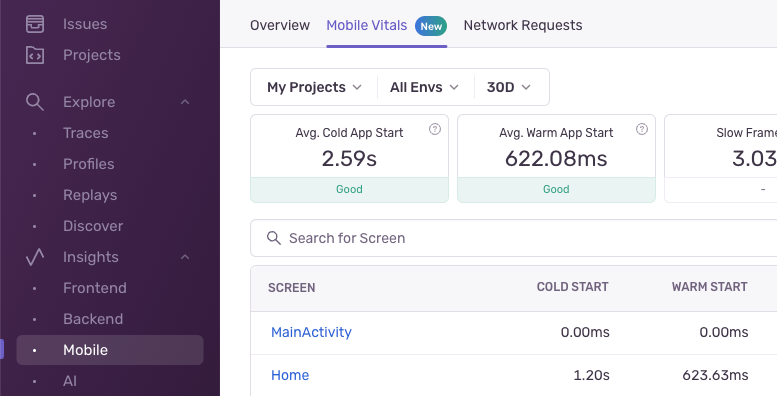
Sentry tracks App Start performance to help you prevent your users from burning unnecessary calories uninstalling your apps out of frustration. We consider two key metrics here: cold starts & warm starts.
Cold starts: You never get a second chance at a first impression. Sentry tracks cold starts independently so you can make sure your latest patch doesn’t crush your first impressions.
Warm starts: Memory management on iOS & Android is complicated and often suspends some tasks while keeping your application ‘warm’ in the background. Pulling up your application from the recent apps selector should be lightning-fast, too.
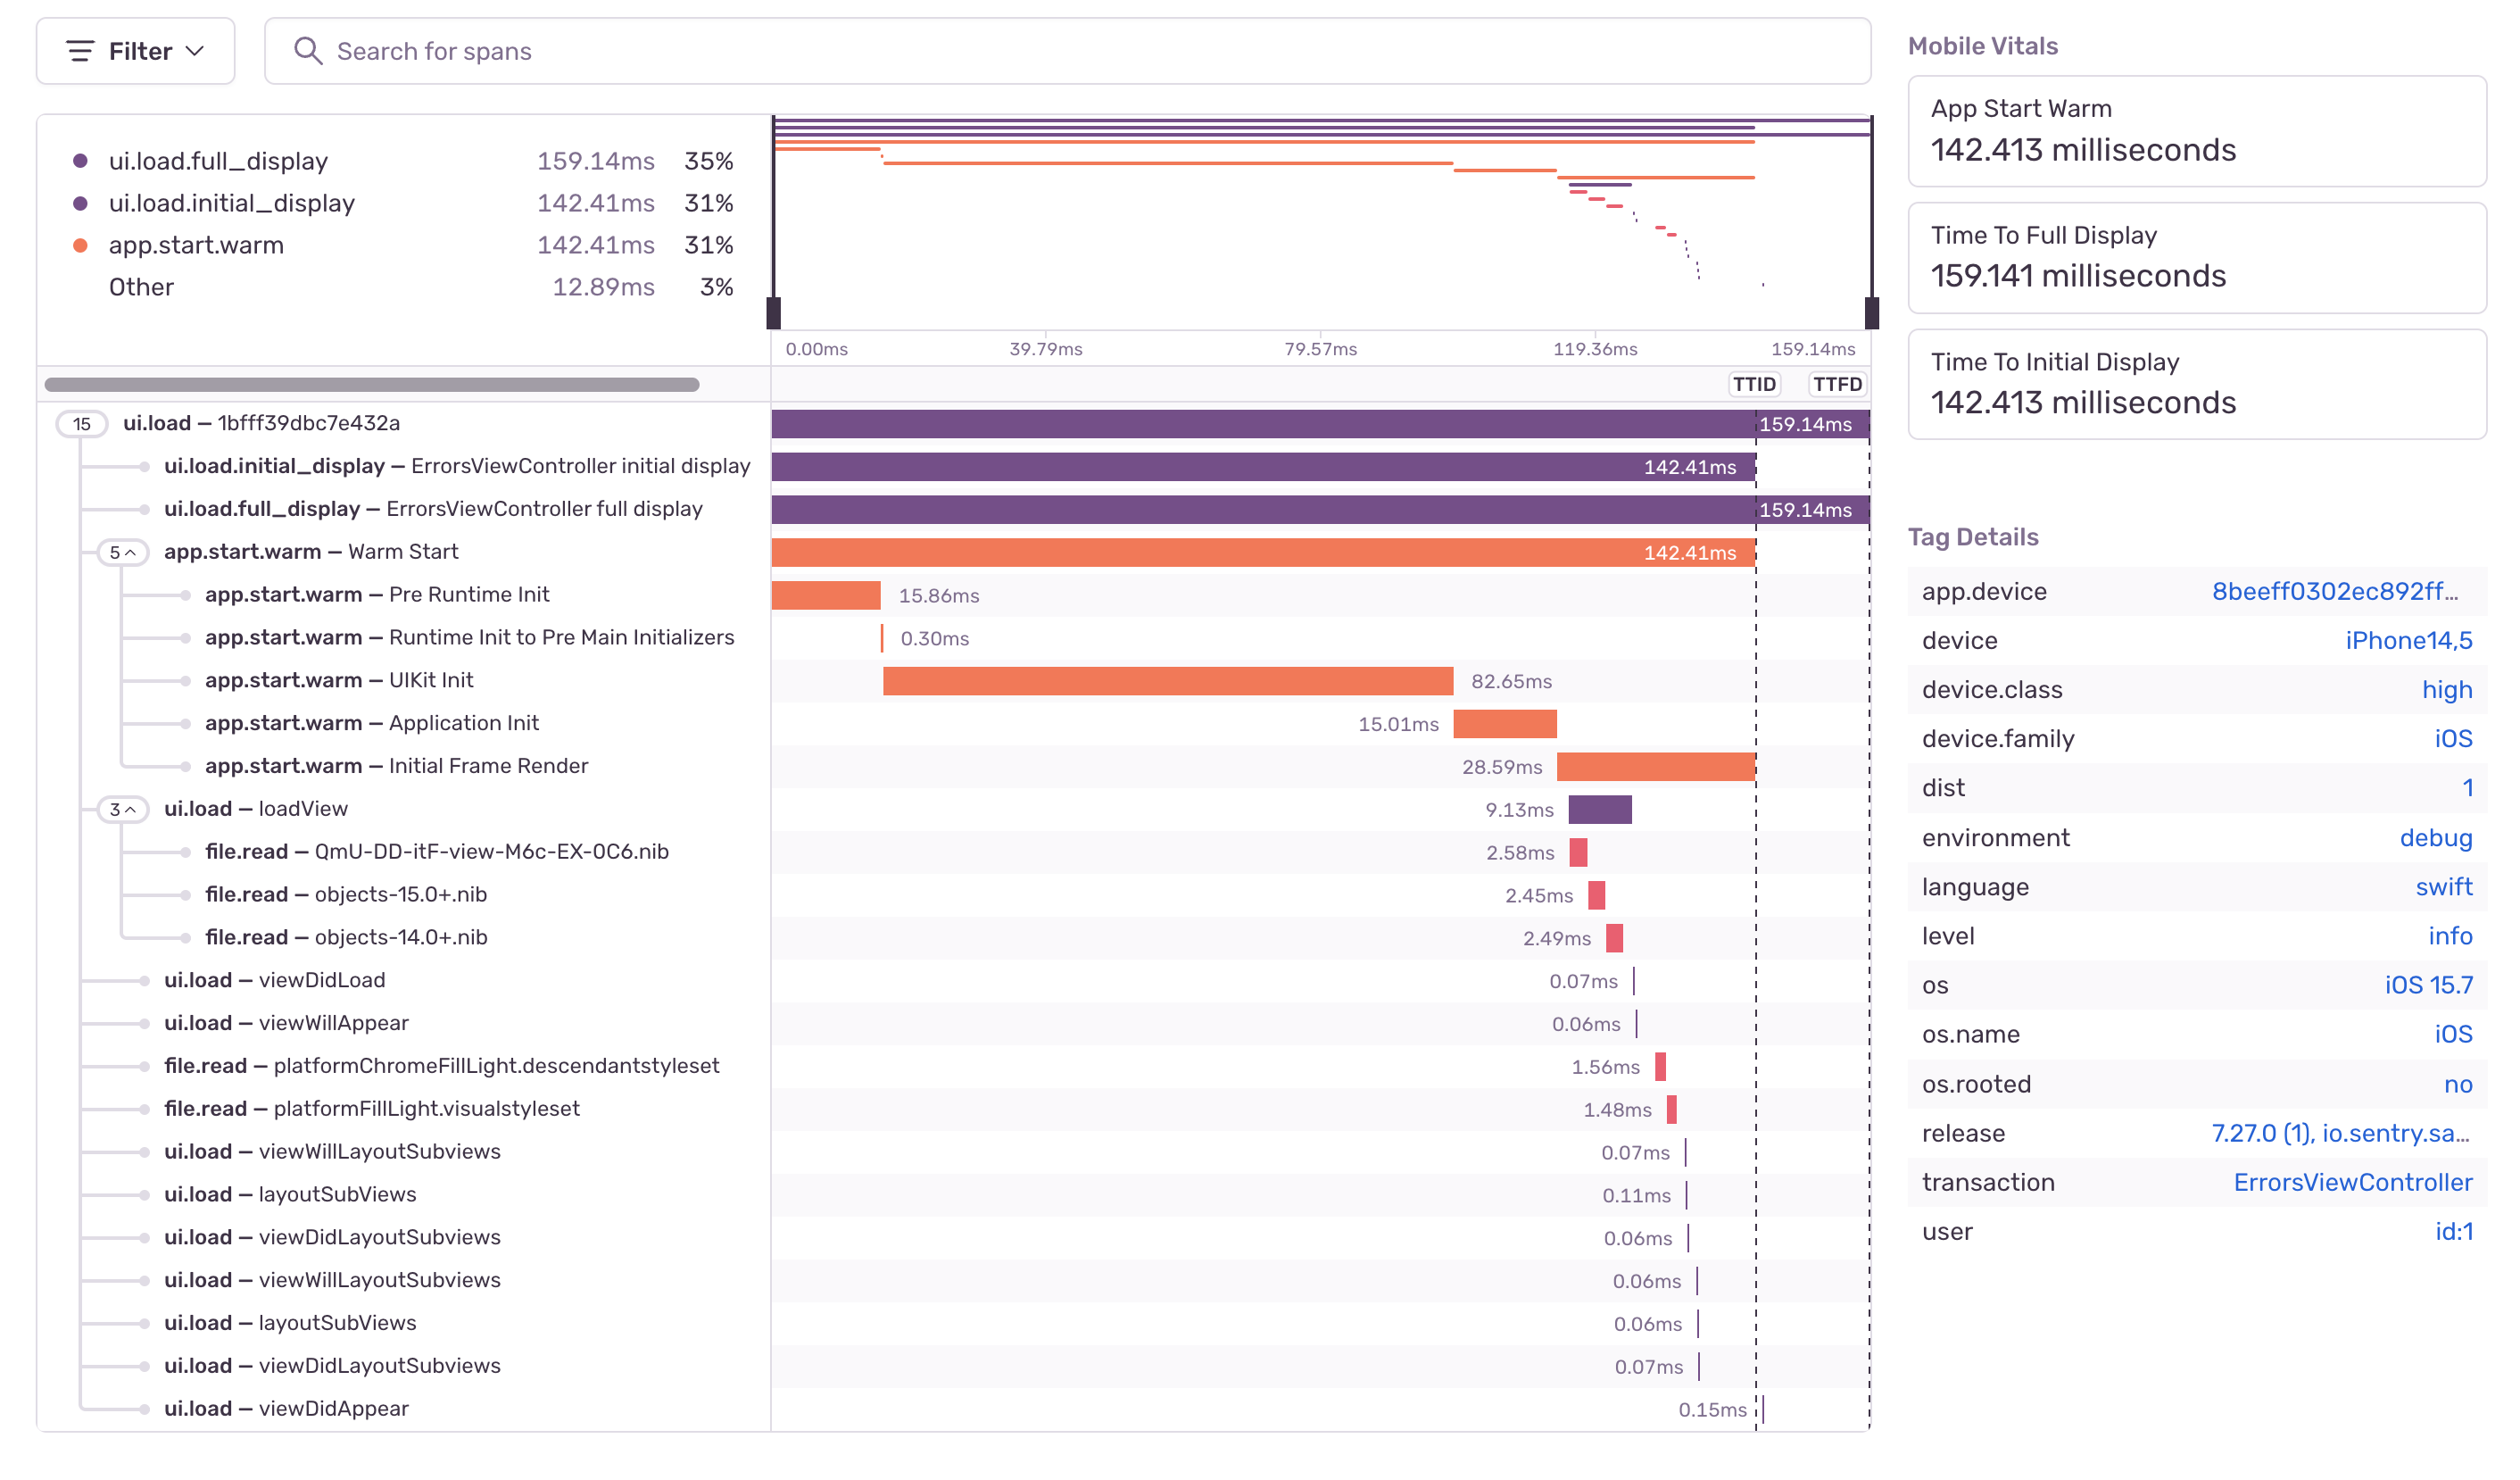
It’s not just the top-level metric that matters. For warm starts, Sentry auto-instruments iOS and Android apps with great granular detail. With iOS for instance, you can see pre-runtime, UIKit, frame renders and a bunch of other native tasks independently and work to fix what’s bottlenecking your app load performance.
Clicking into a screen shows you an overview for all your most recent app loads leading up to that screen, which you can then drill into and see what sorts of tasks may be bottlenecking.
2: Screen Load Performance
If it takes 5 seconds every time you want to load the comments page, nobody’s going to leave comments. It’s really that simple.
Sentry helps you cut down on UX bloat by tracking TTID and TTFD for every screen load:
Time to Initial Display (TTID): This tracks the time it takes for a screen to produce its first frame. Often, that’s just a background or a wall of text, but for a user, this is an important metric as it makes the app ‘feel’ fast. Sentry tracks this automatically by default.
Time to Full Display (TTFD): More importantly is the time it takes for a screen to be fully loaded and functional. This is similar to the LCP core web vital on browser loads. TTFD can include content that’s lazy- or async-loaded after getting its first content, making it a more useful metric for a lot of your mobile screens. This isn’t enabled by default, but it’s super easy to set up.
Just like with App Starts, you can drill into Screen Loads by clicking into a screen and drilling into the full trace of the user session, or even dive into a mobile CPU profile, like shown below.
3: Screen Rendering Performance
Your favorite solitaire clone ships a new patch, and suddenly you find your framerate dropping like a brick. You just got your phone a few years ago… is it time to upgrade? Nah, you’ll just throw out a 1-star review, uninstall, and go right back to Wordle.
We surface 3 key screen rendering performance metrics by default:
Slow frames: any frame that takes longer than a framecycle to render (16.7ms, or 1/60th of a second at 60hz) is considered ‘slow’, causing laggy UI responses and jittery animations. Sentry calculates the % of slow frames for each screen, so you can quickly find the conditions that lead to laggy or dropped frames.
Frozen frames: Even worse is a frame that’s stuck for a longer period of time. Sentry considered any frame render that takes >700ms ‘frozen’.
Frame delay: This is the total ‘hang’ time accumulated on a screen due to slow & frozen frames.
In our own testing, we found these 3 metrics super useful for debugging the clunkiest-feeling parts of our mobile application. By combining these with mobile session replays, we were able to quickly recreate conditions that led to clunkiness for our users and get down to the brass tax.
Why does this matter?
We’re not narcissistic enough to claim that this is as impactful as Core Web Vitals was for the internet - but it’s a start. For mobile apps, it’s extremely difficult to know what to track, let alone how to track it. So, our mobile SDK team took the step to create an awesome new way to get your mobile application performance on track by monitoring a few vital metrics simply & scalably.
More than just monitoring, Mobile Vitals gives you the why behind slow screens—not just the when. Every insight is backed by a trace, so you can see if the culprit is slow code on your main thread or a deeper issue like sluggish database queries or too complex layouts..
A few of our own, Lazar & Salma, recorded an awesome workshop about how to use Distributed Tracing to debug frontend issues with backend solutions. If you have slow screen loads on your mobile devices but aren’t able to find a root cause on the device itself, this is worth a watch.
In short, Mobile Vitals is a tool to:
Monitor mobile top level performance metrics
Easily identify key areas to improve
Deep dive from a top level metric, to a specific performance issue on a particular screen, to a concrete distributed trace, allowing you to debug and understand an issue across the full-stack
Connect your metrics with session replay and profiling, giving you full insights on what the user was experiencing and which code was running
What numbers do I need to shoot for?
Goodhart’s law - when a metric becomes a target, it ceases to be a good metric - still rings true. That said, Google and Apple both openly state that their app store algorithms prioritize app quality, user engagement, app uninstalls and other key factors that are directly related to app performance. Google in particular recommends cold starts of < 5s, and warm starts of < 2s, but these are just starting points.
Rather than just setting a target, mobile vitals monitoring is useful for objectively assessing the current state of your mobile app, deciding whether you want to try and improve it, and continuously evaluating your vitals metrics to make sure you’re not accidentally shipping a major slowdown.

Credit: xkcd
How do I get started with Mobile Vitals?
Most of the Mobile Vitals metrics are instrumented automatically, so as long as you’ve set up the Sentry SDK in your mobile app, you should be good to go! TTFD is the only exception - you’ll need to call the API to let Sentry know when a screen is fully rendered. Here’s the setup for our most popular SDK’s:
If you want to go the extra mile, you can also track custom performance metrics, add custom spans, and attach span attributes that you can use to calculate and monitor span metrics for your most critical user experiences.
If you’re a mobile developer who cares about your user experiences, tracking Mobile Vitals is a great way to gauge how your mobile app releases impact device performance beyond just the top level metrics. Mobile Vitals is available to all paying Sentry customers - just turn it on in your SDK and give it a shot.
If you're on the Developer plan and want to try out Mobile Vitals, turn on a 14 day free trial. Questions? Concerns? Ideas? Hit us up on Discord.