Flutter Debugging: Top Tips and Tools You Need to Know
Flutter Debugging: Top Tips and Tools You Need to Know
Modern applications are complex, interconnected collections of services and moving parts that all have the potential to fail or not work as expected. Flutter and the language it’s built upon, Dart, are designed for event-driven, concurrent, and, most crucially, performant apps. It’s important for any developer using them to have a decent selection of debugging tools.
The default Flutter toolchain includes a rich suite of tools for debugging and profiling applications that gives you a headstart over many other languages. This solid base allows plugins for popular IDEs and external monitoring providers to provide deep insights into your Flutter application.
In this post, I look at many options available to developers interested in common Flutter issues and offer solutions to help you better understand Flutter debugging and profiling.
Flutter debugging example
This post uses an example to do aggregator to cover the top tools and tips you need for Flutter debugging. The aggregator intends to create an application that pulls in several sources of tasks, issues, and to-dos to show them all together in a sortable, filterable list. The application only sources items from Trello and GitHub issues for this article and presents them in a list.
However, the application still fetches data from two APIs, parses JSON responses, merges data structures, and presents them in a scrollable list. Plenty of opportunities to introduce problems!
You can follow progress on the application on GitHub.
Logging options
Many developers’ first point of call is to litter the code with the language equivalent of “console.log()”. We all know it’s not the best thing to do, but sometimes it’s enough for quick and dirty debugging.
Flutter and Dart have two different ways to do this.
You can use print(), stdout, and stderr to log messages to the console.
You can use the dart:developer log() function to receive more information in the logging output. Using log(), you can add one or more of several optional parameters, including a timestamp, error level, and stack trace.
How to debug flags in Flutter
As Flutter is UI-centric and application interfaces often consist of dozens of cascading widgets, visual feedback on application UIs is important. Flutter has a handful of debug flags you can add to classes that provide a variety of uses. However, Flutter’s DevTools has features that replicate (and improve) these flags, so unless you have a reason to use them, it’s probably best not to.
You can find an overview of the flags in the Flutter documentation and a full reference in the rendering package properties list.
The Flutter DevTools Package
One of the most powerful features of Flutter is the DevTools package. It’s a collection of tools that provide debugging and performance features. It’s best used with the Android Studio, IntelliJ, or VS Code plugins, but you can also use it in-browser or from the command line. For an in-built tool, it provides a lot of useful features, including:
Inspect the UI layout and state
Diagnose UI performance issues
CPU profiling (in profile mode only)
Network profiling (in profile mode only)
Source-level debugging
A timeline view that supports tracing
Debug memory issues
View general log and diagnostics information about a running app
Analyze code and app size
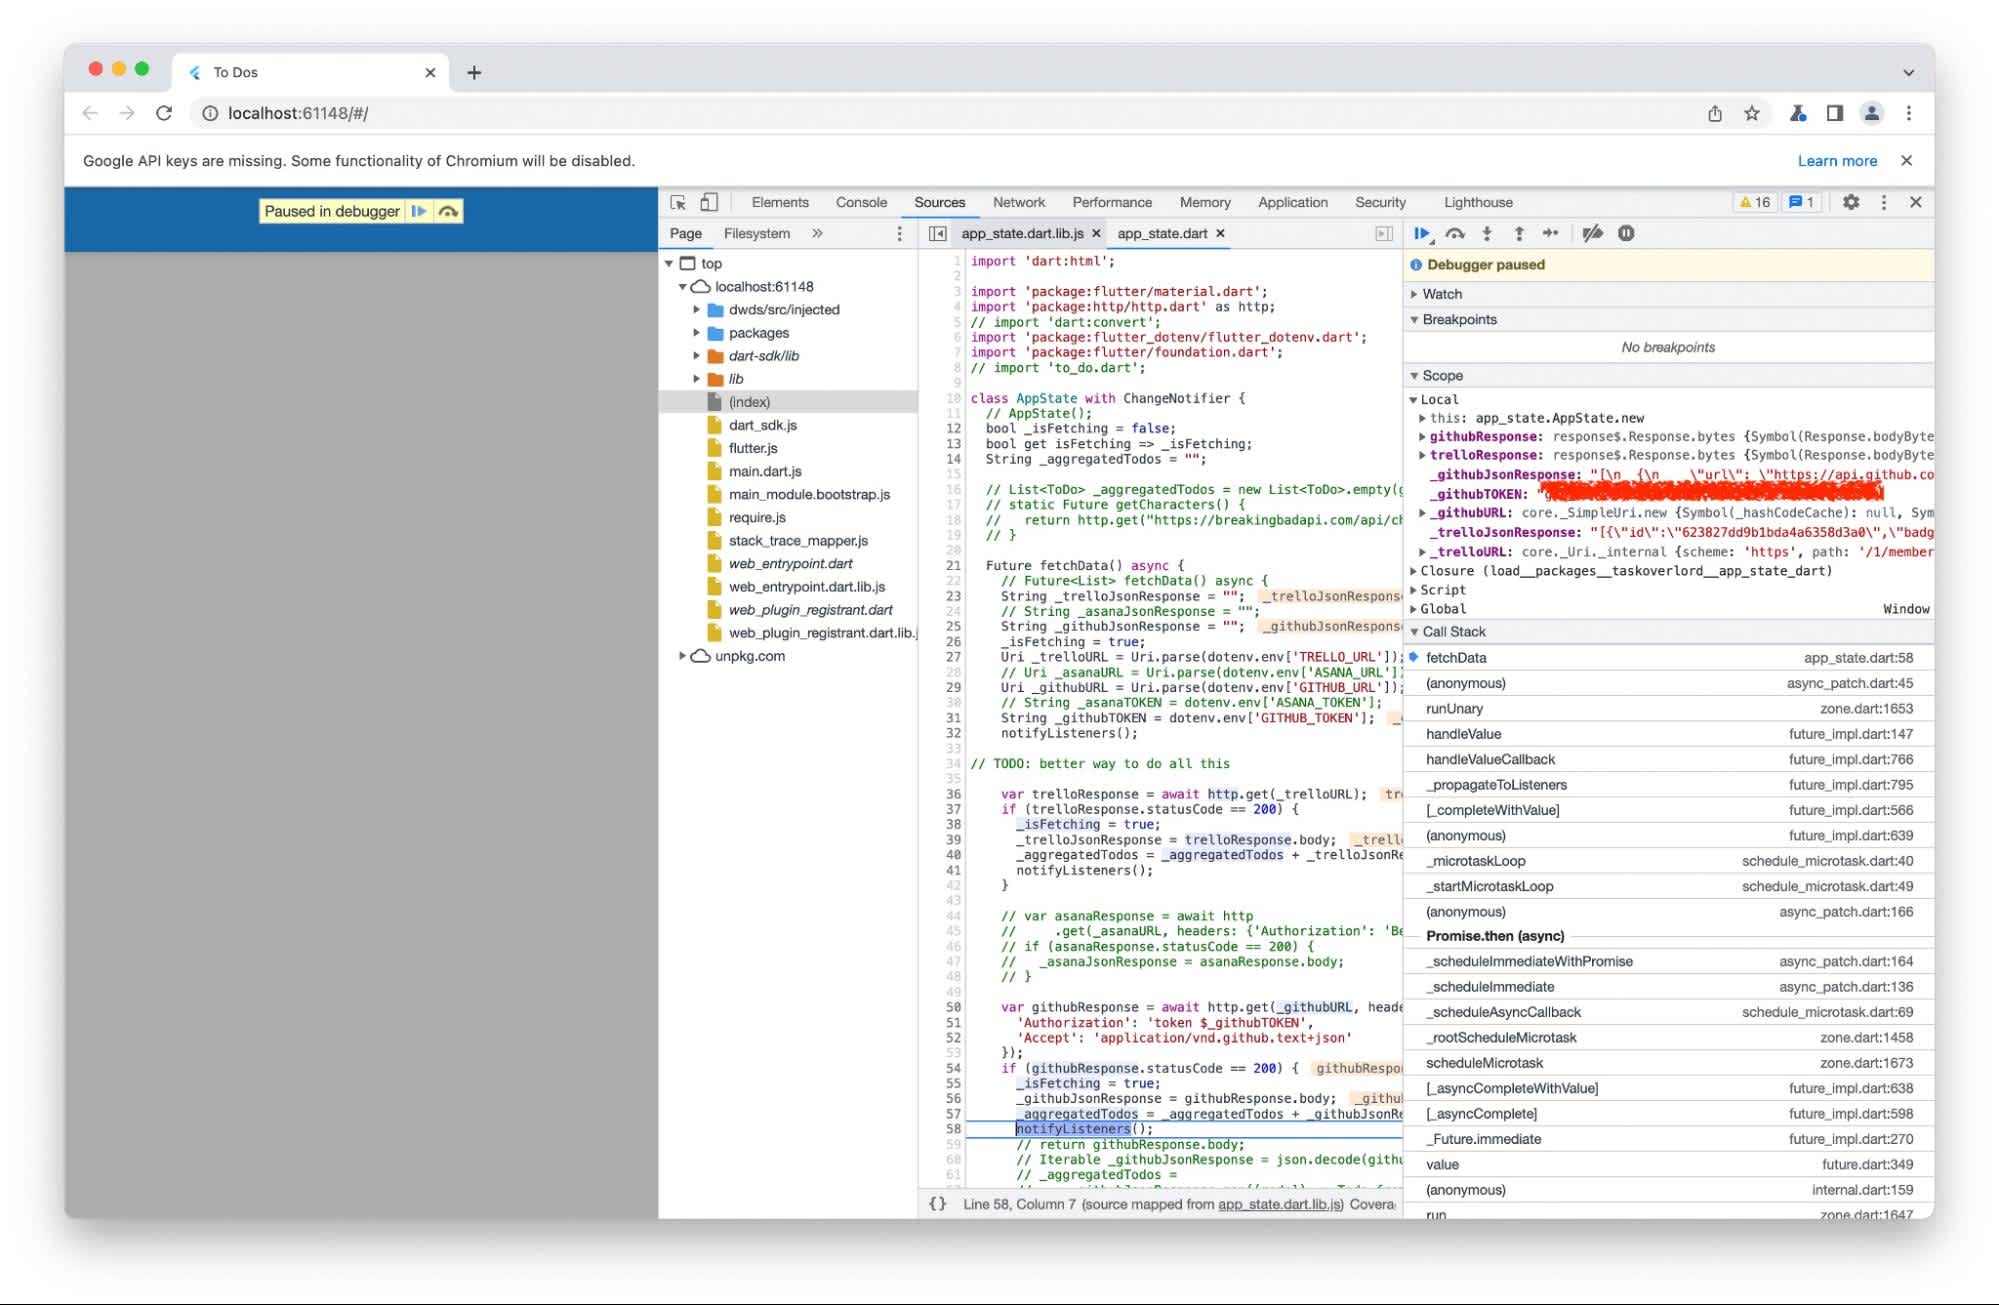
When you run an application in debug or profile mode, DevTools starts automatically and opens in either your editor or in a browser if run from the command line. DevTools shows a lot of information by default but sets breakpoints with an editor plugin to get the most from them.
You can use DevTools to debug a Flutter application across a wide range of environments, including both in-browser applications and those on physical devices. Whether you are running your Flutter app directly in a web browser or on a mobile device connected via a USB cable, DevTools provides a powerful suite of features to help identify and fix issues in your code. This flexibility allows developers to monitor performance, inspect widget trees, analyze rendering issues, and even check network requests in real-time, ensuring that you can maintain high-quality user experiences across all platforms. By seamlessly switching between different debugging scenarios, you can gain insights into your application’s behavior and make informed decisions to enhance its functionality and performance.
Editor plugins for debugging a Flutter application
The Android Studio, IntelliJ, and Visual Studio Code (VS Code) plugins incorporate DevTools directly into the Integrated Development Environment (IDE), enhancing the development experience by enabling developers to perform live inspections of various application components while the application is actively running. This seamless integration allows for a more efficient debugging process and real-time analysis of the application's behavior.
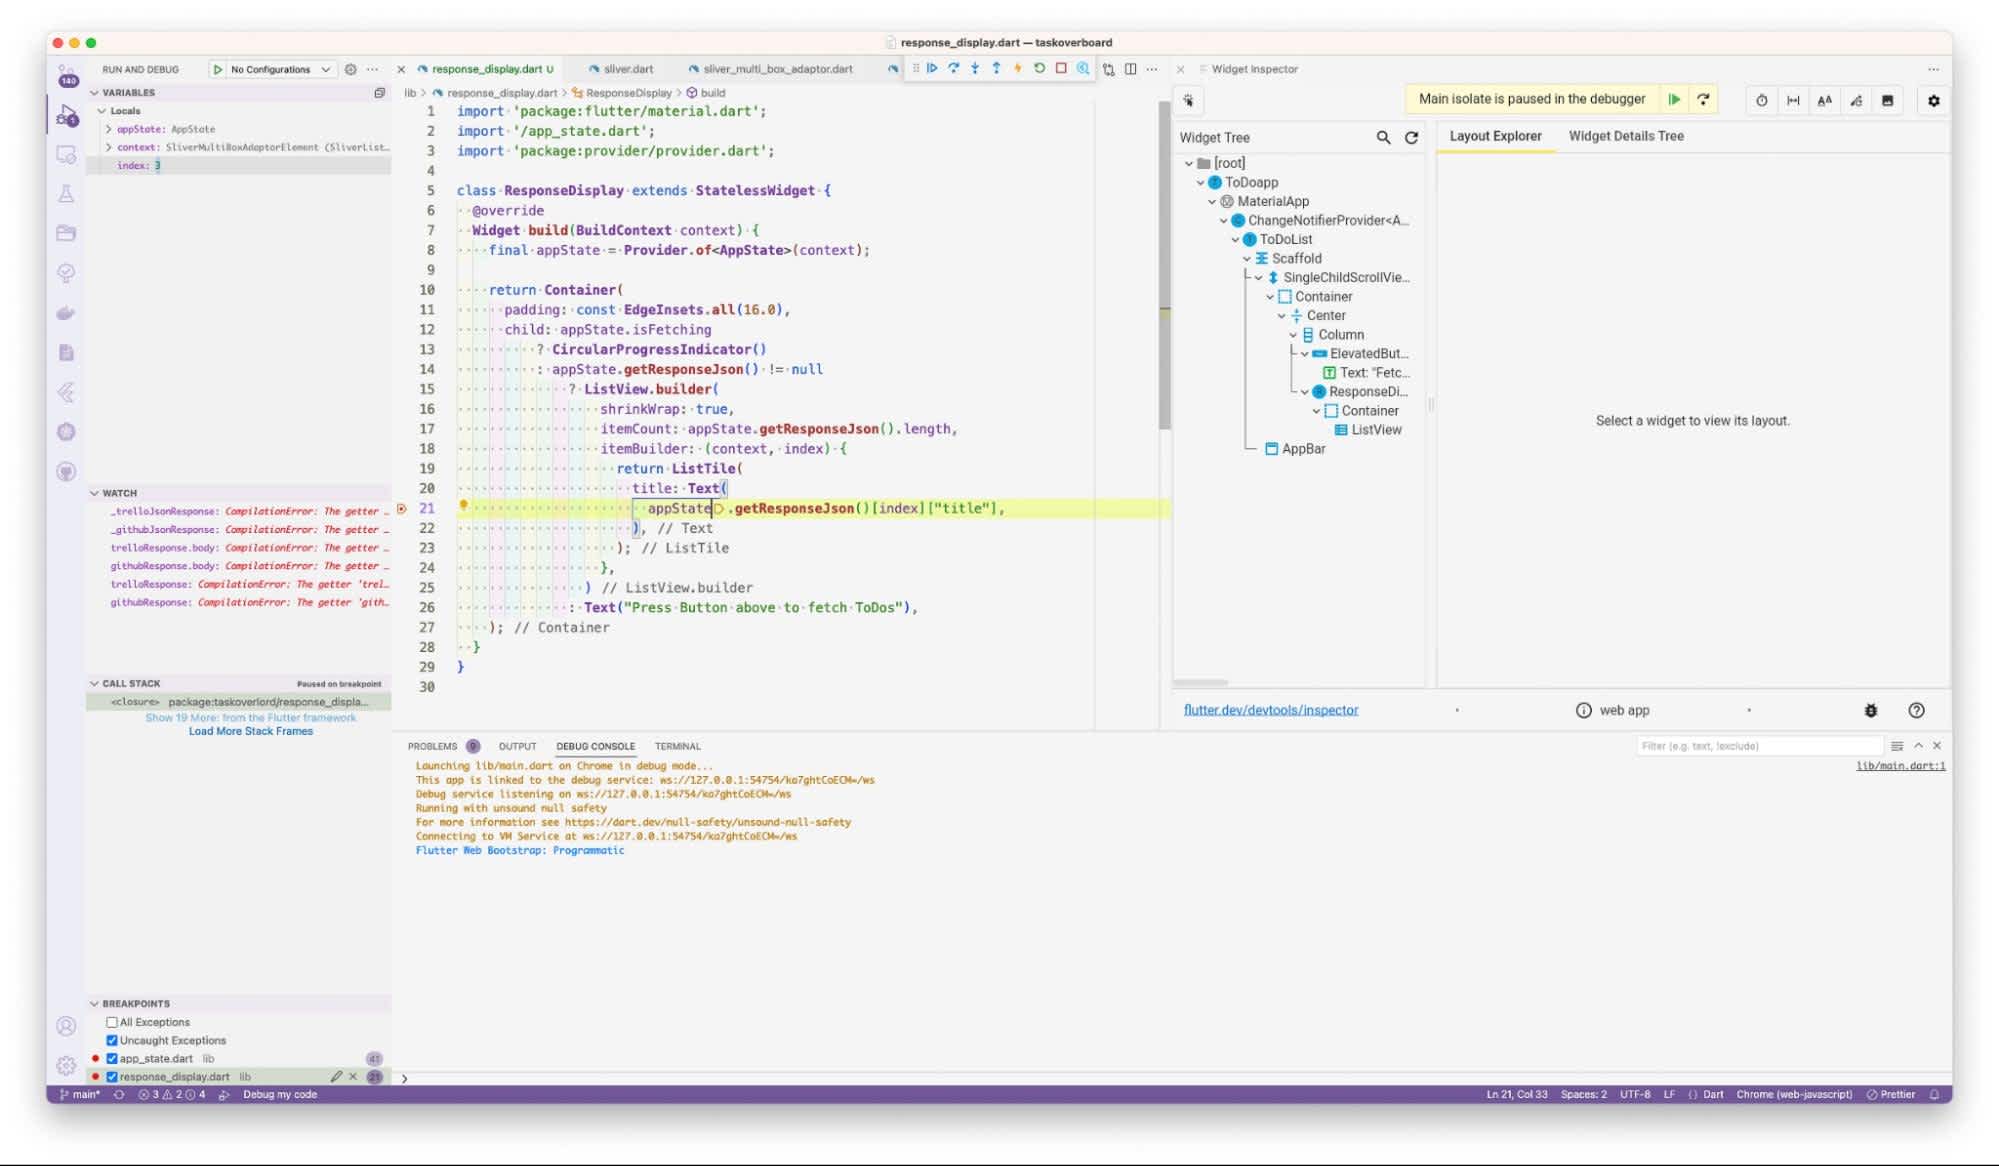
When you set breakpoints in your code, DevTools takes control by pausing the application execution at those designated points. At this moment, you can examine the current state of the application in detail. This includes a comprehensive view of all declared variables, allowing developers to monitor their values and understand how they influence the application’s flow.
Moreover, the DevTools user interface provides a variety of functionalities to facilitate inspection. You can easily navigate through the application state, explore different data structures, and evaluate the context in which the application is operating. This level of insight empowers developers to identify issues more quickly and effectively, analyze the behavior of specific components, and make informed decisions about how to proceed with debugging. Once you’ve gathered the necessary information, you can utilize the DevTools UI to continue the application's execution, either resuming it or stepping through the code line by line, thereby enhancing the overall development workflow.
Sentry Flutter plugin
While Flutter bundles a solid set of debugging tools, effectively tracking and monitoring errors in production is extremely important. This is where Sentry comes into play. Sentry enhances your Flutter applications by offering comprehensive error tracking and application performance monitoring. It enables developers to manually catch exceptions and enriches error reports with metadata and screenshots, ensuring a seamless user experience and quick issue resolution.
Debugging actual issues
How do these various tools help me debug my application? Here’s an example of some of the errors I encountered and which tool helped me resolve them. Of course, there were many more errors, but most of those were human-generated 😅. I use Visual Studio Code for my development. However, as I tested the application in the browser during development, I found that the same DevTools were available in my editor and the browser.
Some of the issues and problems I had were:
Calling an incorrect API endpoint for an external service
Calling a correct endpoint but with an incorrect argument
Calling a correct endpoint with the correct argument, but that returned a payload unsuitable to my use
Using an out-of-date dependency that causes incompatibility issues or failures
Using an out-of-date token
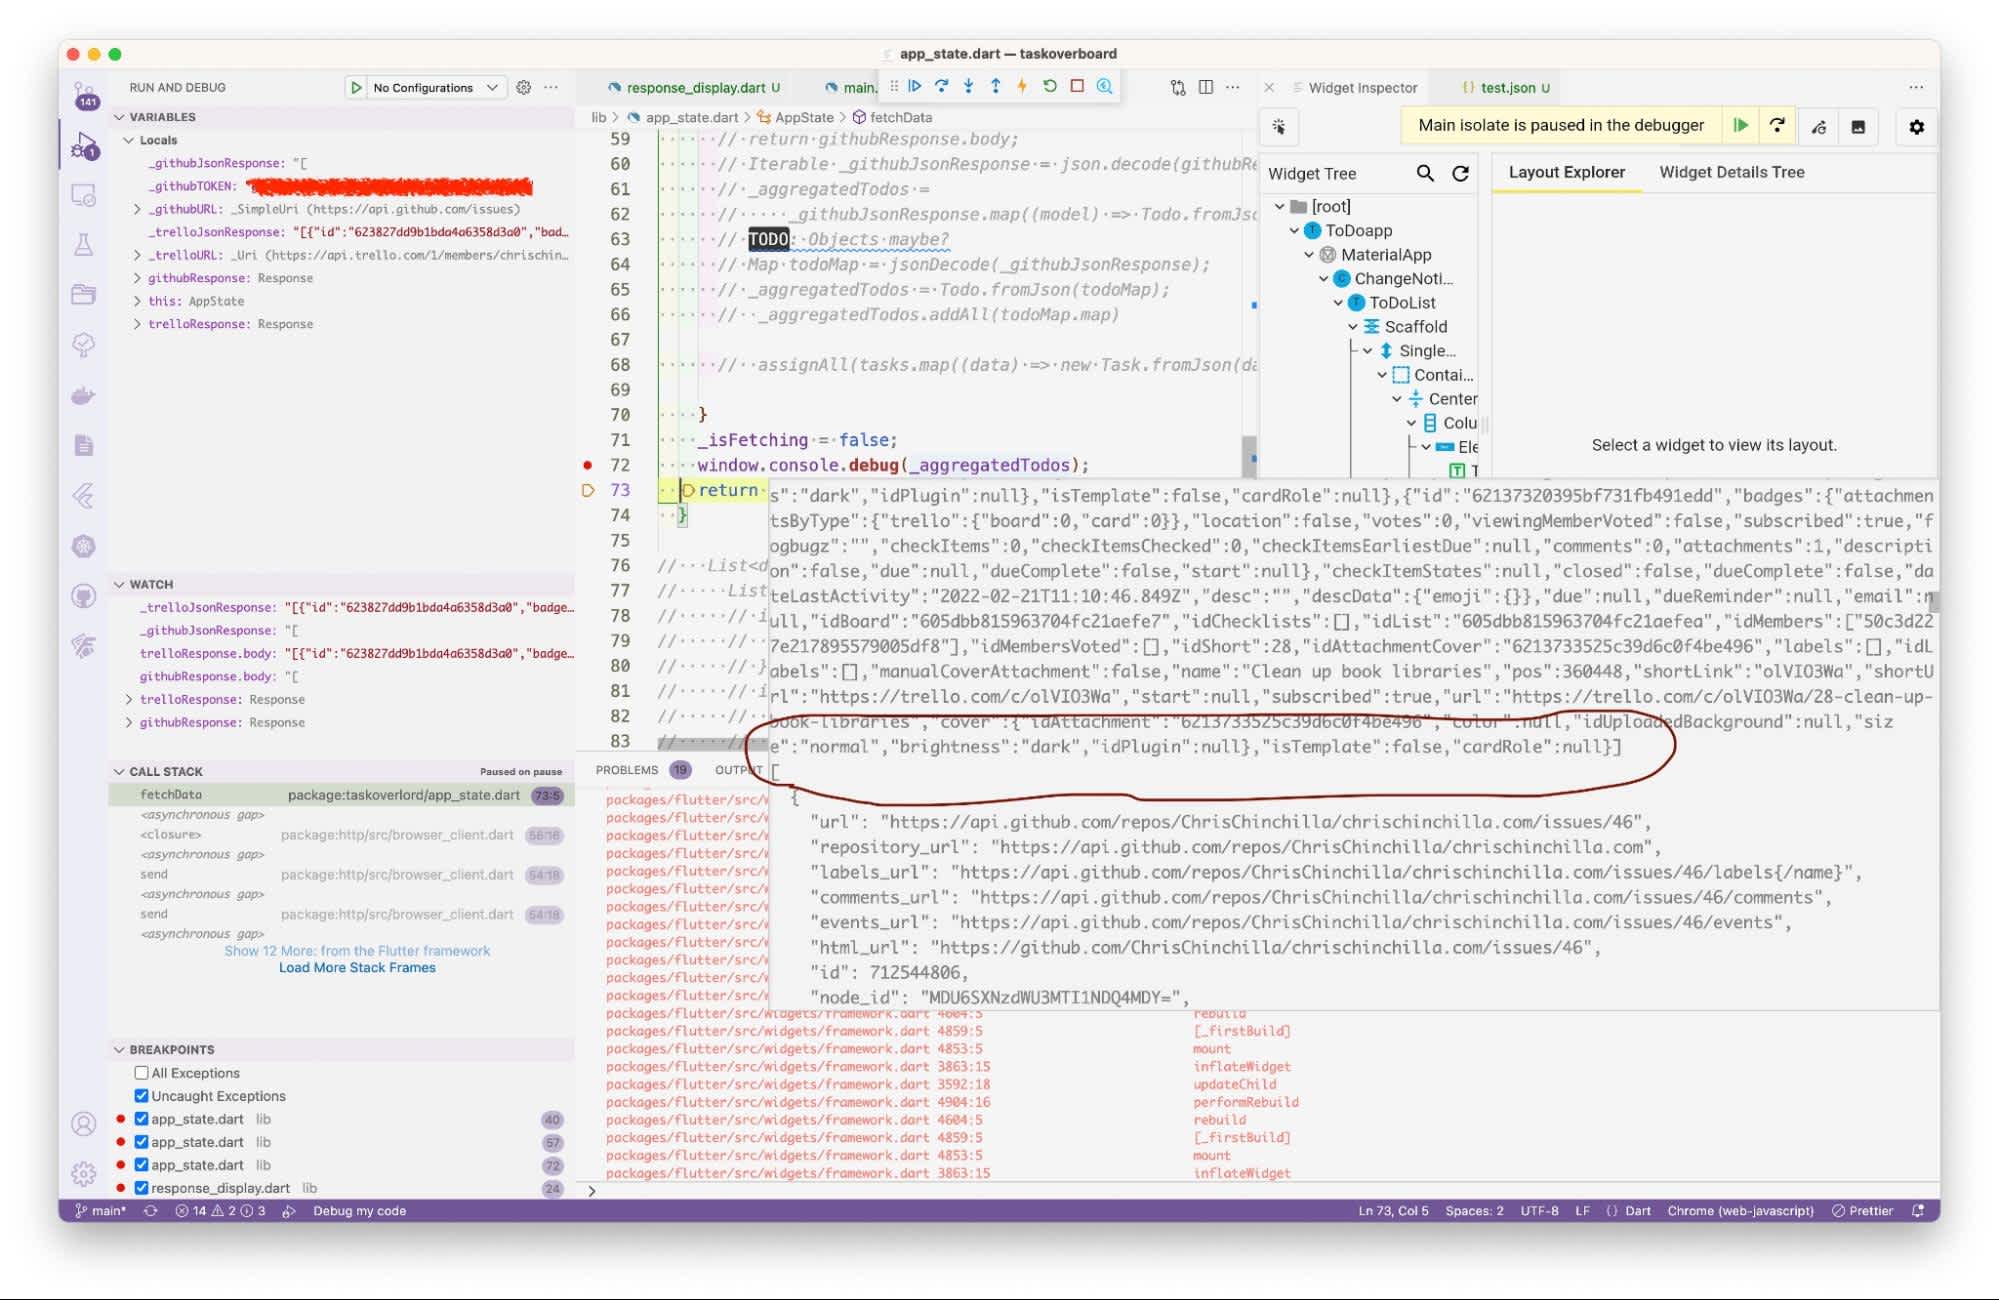
Inspecting payloads from an API call
One of the most significant issues I had with the application was that different API calls returned differently formatted payloads. It turns out that REST APIs aren’t always as standard as you may think. Fortunately, I could see the issue by hovering over watched variables to see the current value. In another example, I needed to merge the two JSON strings to create objects from them, and only by digging into the variable values could I see what sort of string manipulation I needed to get this to work. This manipulation involves removing the square brackets from the end of one string and the start of the other and concatenating the two strings with a comma.
I could have achieved the same with log statements, but watching variables is much tidier.
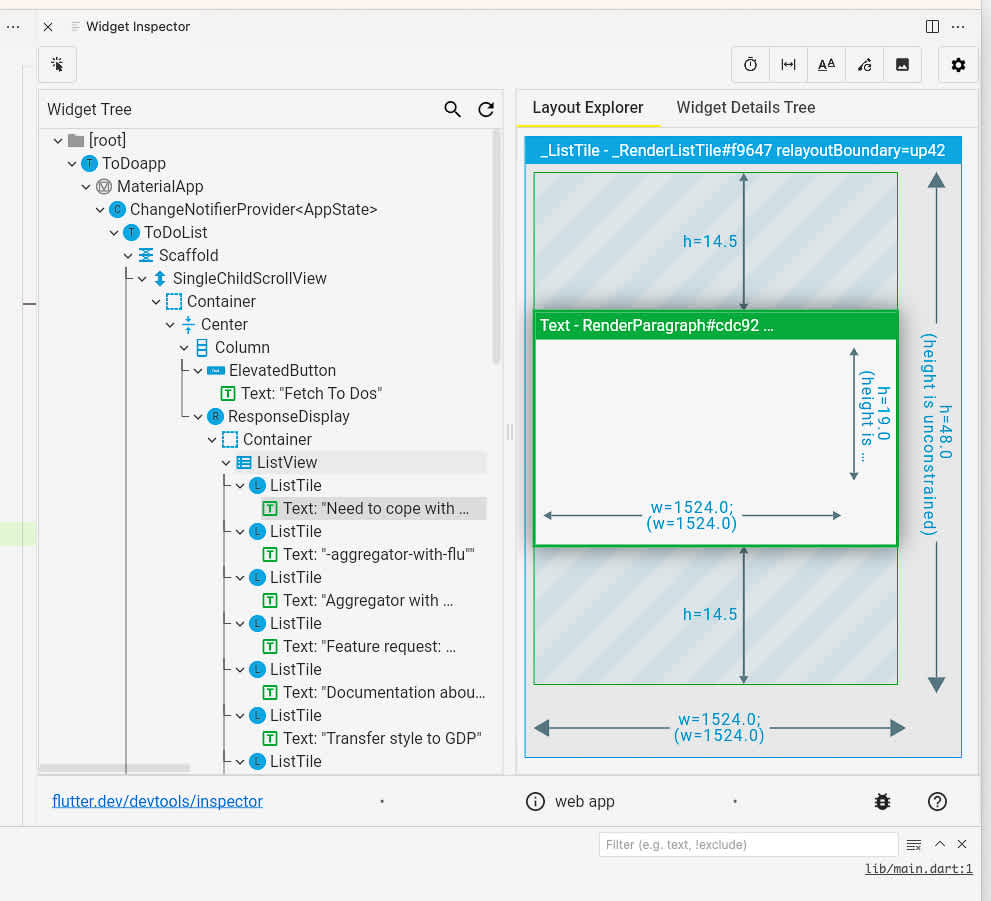
Currently, the application doesn’t have a complex UI, but it will eventually be a long list of nested widgets, each consisting of numerous properties that will be widgets. The widget tree inspector is essential to understanding how that widget tree fits together.
One of the main problems with calling numerous APIs is authenticating with them. In addition to generating and storing keys and tokens, they often expire, breaking applications in production.
While the inbuilt Flutter DevTools could help debug the source of the issue, they won’t alert you to an issue in production. An external application performance monitoring tool like Sentry can. The key is adding the instrumentation in the right place, around the call to the API, for example, or the error generated is meaningless.
try {
final trelloResponse = await http.get(_trelloURL);
…
} catch (exception, stackTrace) {
await Sentry.captureException(
exception,
stackTrace: stackTrace,
);
}You can simulate an incorrect credential by changing a token value in the .env file, which should generate an issue in Sentry, alerting team members.
You can also send Sentry debug information in the form of strings using:
await Sentry.captureMessage('Something went wrong');
Likewise, Sentry can help in a handful of ways for performance monitoring in production.
To help observe routing and widget performance, add navigatorObservers : [SentryNavigatorObserver()] to your main application widget, for example:
  Widget build(BuildContext context) {
    return MaterialApp(
        title: 'To Dos',
        navigatorObservers: [SentryNavigatorObserver()],
        home: ChangeNotifierProvider(
          create: (context) => AppState(),
          child: ToDoList(),
        ));
  }
This application calls lots of HTTP APIs. One of those responding slowly will degrade the performance of the application. Sentry can monitor HTTP requests using the SentryHttpClient class instead of the default. For example:
var client = SentryHttpClient(networkTracing: true);

try {
  final trelloResponse = await client.get(_trelloURL);
  …
} catch (exception, stackTrace) {
  await Sentry.captureException(
    exception,
    stackTrace: stackTrace,
  );
} finally {
  client.close();
}

await trelloTransaction.finish(status: SpanStatus.ok());
Over time this generates a performance report in Sentry, giving you an idea of what is “normal” performance and what is not. The performance page also shows failure rates, so it is an alternative way to detect errors with API calls.
Other useful features are adding screenshots of the UI state at the time of an error. This is particularly useful for a UI-heavy language such as Flutter. To do this, wrap your application in a SentryScreenshotWidget and make your application a child:
appRunner: () => runApp(
  SentryScreenshotWidget(
    child: ToDoapp(),
  ),
),
And add options.attachScreenshot = true; to your Sentry await SentryFlutter.init method.
Finally, reflecting the DevTools widget inspector tree view, you can also send the view hierarchy to Sentry as a JSON string which Sentry then renders on an issue. To do this, add options.attachViewHierarchy = true; to your Sentry await SentryFlutter.init method.
Next steps
My application is far from complete. I have yet to add essential services such as Jira integration, some middleware to handle the different services, a proper UI, or get the application working properly outside of the browser. But out of all the programming languages I have worked with, Dart and Flutter have the best integrated tooling I have used. It can take time to discover the full depths of features it offers, but it’s worth it for you and your application.


