How to monitor Lambda functions in your SST application

Jay V -

Jay V is one of the founders of Serverless Stack (SST), an open-source framework that makes it easy to build serverless apps. He spends his time trying to figure out what the future of the cloud will look like. And liking memes on Twitter.
Meet SST
SST (Serverless Stack) is an open-source serverless application platform that makes it easy to build full-stack apps. It features a local development environment that lets you set breakpoints and test your Lambda functions locally. It's also based on AWS CDK and allows you to use any AWS service in your app.
In an SST app, you can define a React frontend that connects to a GraphQL API, backed by a PostgreSQL database; all with a few lines of code. SST also makes it easy to share environment variables between your frontend and backend, so you can deploy your application to multiple environments with ease.
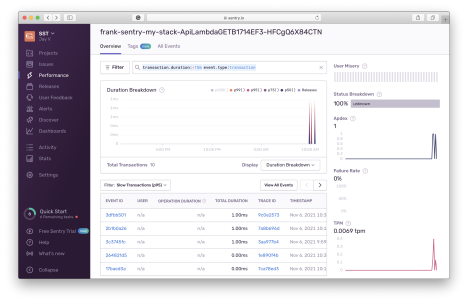
By integrating Sentry and the recently released Lambda monitoring, developers can now easily monitor their entire full-stack app. In addition to errors and issues in your Lambda functions, you can also see performance metrics; including the execution duration and transactions per minute.
Let's look at how to monitor your Lambda functions with Sentry in your SST apps.
Adding Sentry to an SST App
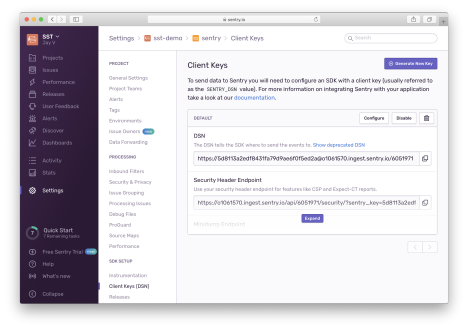
Start by grabbing your Sentry DSN.
Then, get the Lambda layer for your region.
Now you can set this for the functions in your SST app:
// Configure Sentry
if (!scope.local) {
const sentry = LayerVersion.fromLayerVersionArn(
this,
"SentryLayer",
`arn:aws:lambda:${scope.region}:943013980633:layer:SentryNodeServerlessSDK:35` );
this.addDefaultFunctionLayers([sentry]);
this.addDefaultFunctionEnv({
SENTRY_DSN: process.env.SENTRY_DSN,
SENTRY_TRACES_SAMPLE_RATE: "1.0",
NODE_OPTIONS: "-r @sentry/serverless/dist/awslambda-auto",
});
} We are using the addDefaultFunctionLayers and addDefaultFunctionEnv methods to apply this to all the functions in your stack.
And finally, wrap the Lambda functions with the Sentry Lambda handler:
import Sentry from "@sentry/serverless";

  export const handler = Sentry.AWSLambda.wrapHandler(async (event) => {
    return {
      statusCode: 200,
      headers: { "Content-Type": "text/plain" },
      body: `Hello, World! Your request was received at ${event.requestContext.time}.`, };
});
Now you should be able to see errors and performance metrics over on Sentry.
For more details, you can follow this step-by-step tutorial and check out the SST docs.
Wrapping up
The tutorial above helps you enable Lambda monitoring in your SST apps with Sentry. You can also monitor the frontend portion of your SST app; head over to Sentry’s Frontend Monitoring page for more details.
Being able to monitor your SST apps is a critical step before going into production and the Sentry integration helps with just that.


