Guest Post: Troubleshooting Feature Flags with Komodor and Sentry
Guest Post: Troubleshooting Feature Flags with Komodor and Sentry
Mickael Alliel is a DevOps Engineer who enjoys experimenting with new technologies and methodologies. Mickael is currently developing the next-gen K8s troubleshooting platform at Komodor, and doubling as a French cuisine connoisseur.
Meet Komodor
Komodor is a Kubernetes-native platform we’ve created to streamline troubleshooting. It was born out of frustrations we felt as developers, when we were required to waste hours of our time on troubleshooting, instead of focusing on what we really wanted to do - creating and innovating.
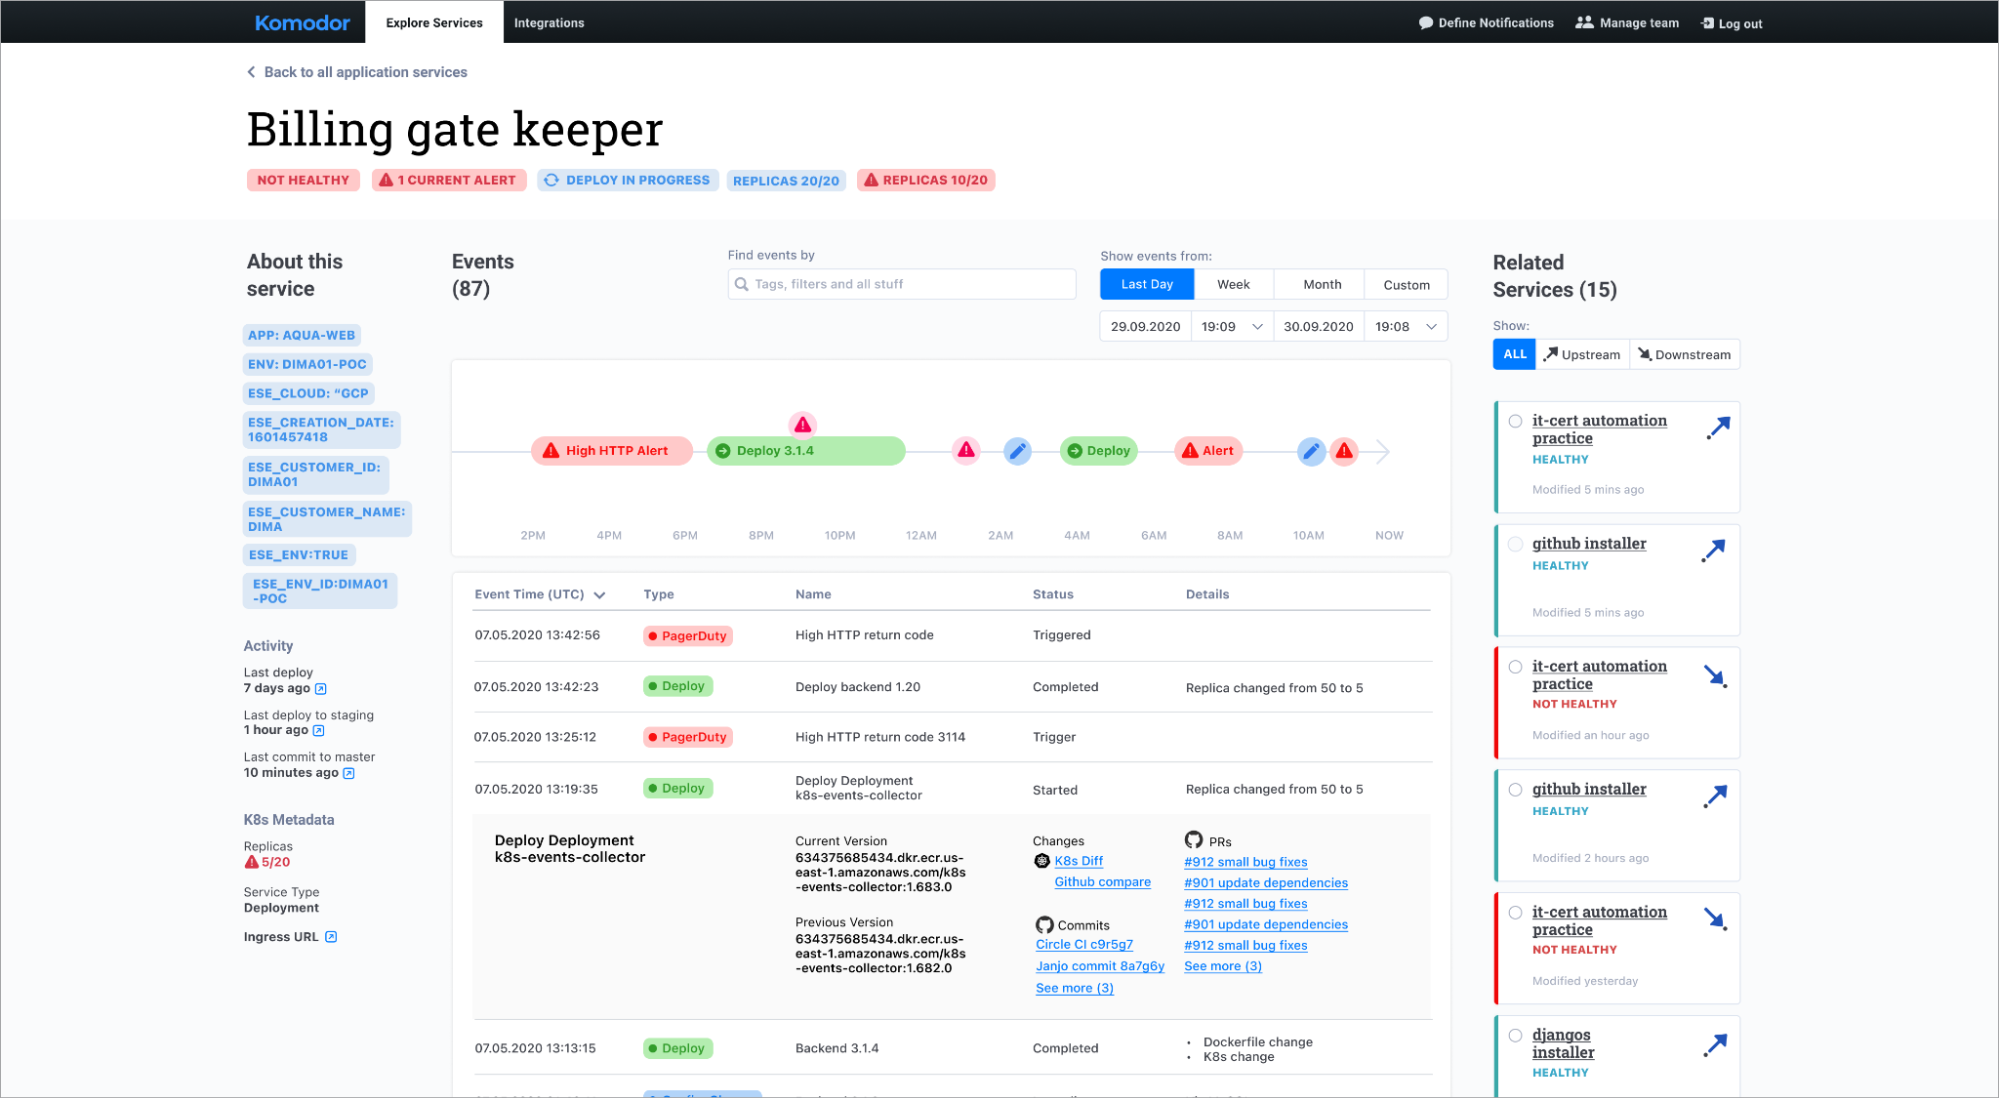
Komodor sits on top of your K8s cluster and integrates with every existing tool you have, be it CI/CD, repo, monitoring, alerting, or communication. All K8s changes and changes from every integration are consolidated into a single timeline view. Developers can also see how related services are impacted by changes in your K8s cluster by stacking timelines on top of each other.
With the help of these and many other features, Komodor and its Sentry integration help dev teams move fast and deploy with confidence, knowing that if something breaks they can always fix things quickly on their own, without skipping a beat.
Integrating Komodor with Sentry
It all starts with our Integrations tab - click Install on the Sentry tile.
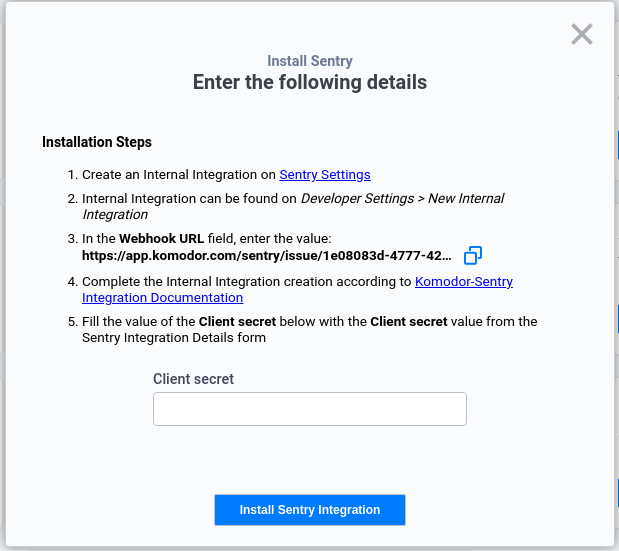
You will be prompted with step-by-step instructions on how to finish the installation properly on your Sentry account.
Go to the Sentry Settings in your account (you will be required to have admin permissions on that account).
In the Developer Settings, create a ‘New Internal Integration’ and paste the webhook found previously on Komodor’s Integrations tab, along with the required permission scope found in our documentation.
Once you save the settings, you will be able to copy your internal integration Client Secret and paste it into Komodor to finish the installation.
Sentry provides data on the exception or performance issue; how many times a given issue occured, stack trace, browser information, and more. Komodor adds the ability to tie it into the context of the service itself - when was it deployed, and what changed in this specific version by connecting all your cloud 3rd party service providers.
Common Use Case: Feature Flags
Toggling a feature flag might be the easiest way to break an application. It’s a click away from completely changing business logic, breaking something, and causing exceptions, LIVE in front of your end-users.
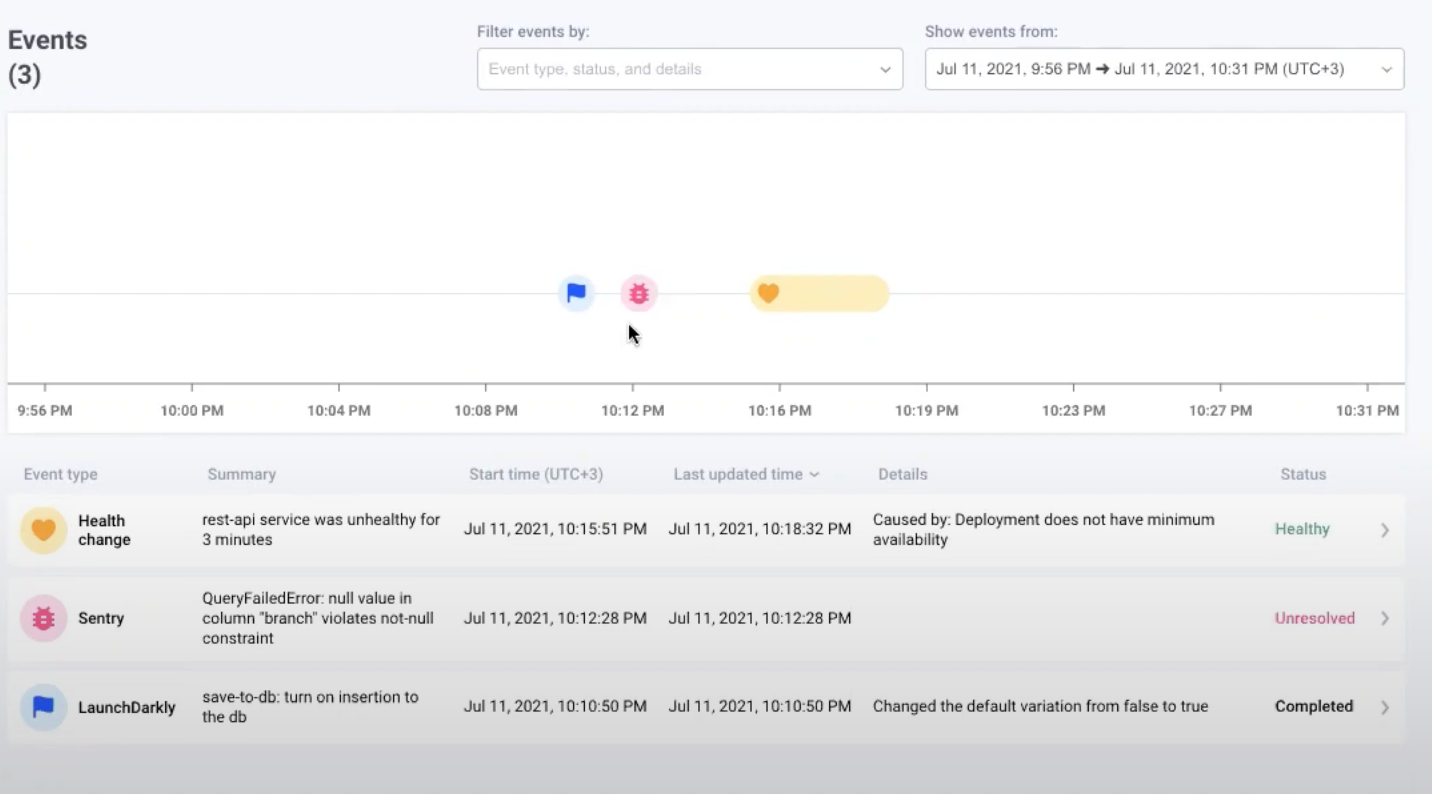
Luckily, by using Komodor and Sentry together you can easily triage any incident triggered by enabling or disabling a feature flag. For instance, Komodor’s Slackbot can notify the relevant team members that a ‘rest-API’ service was unhealthy for 3 minutes.
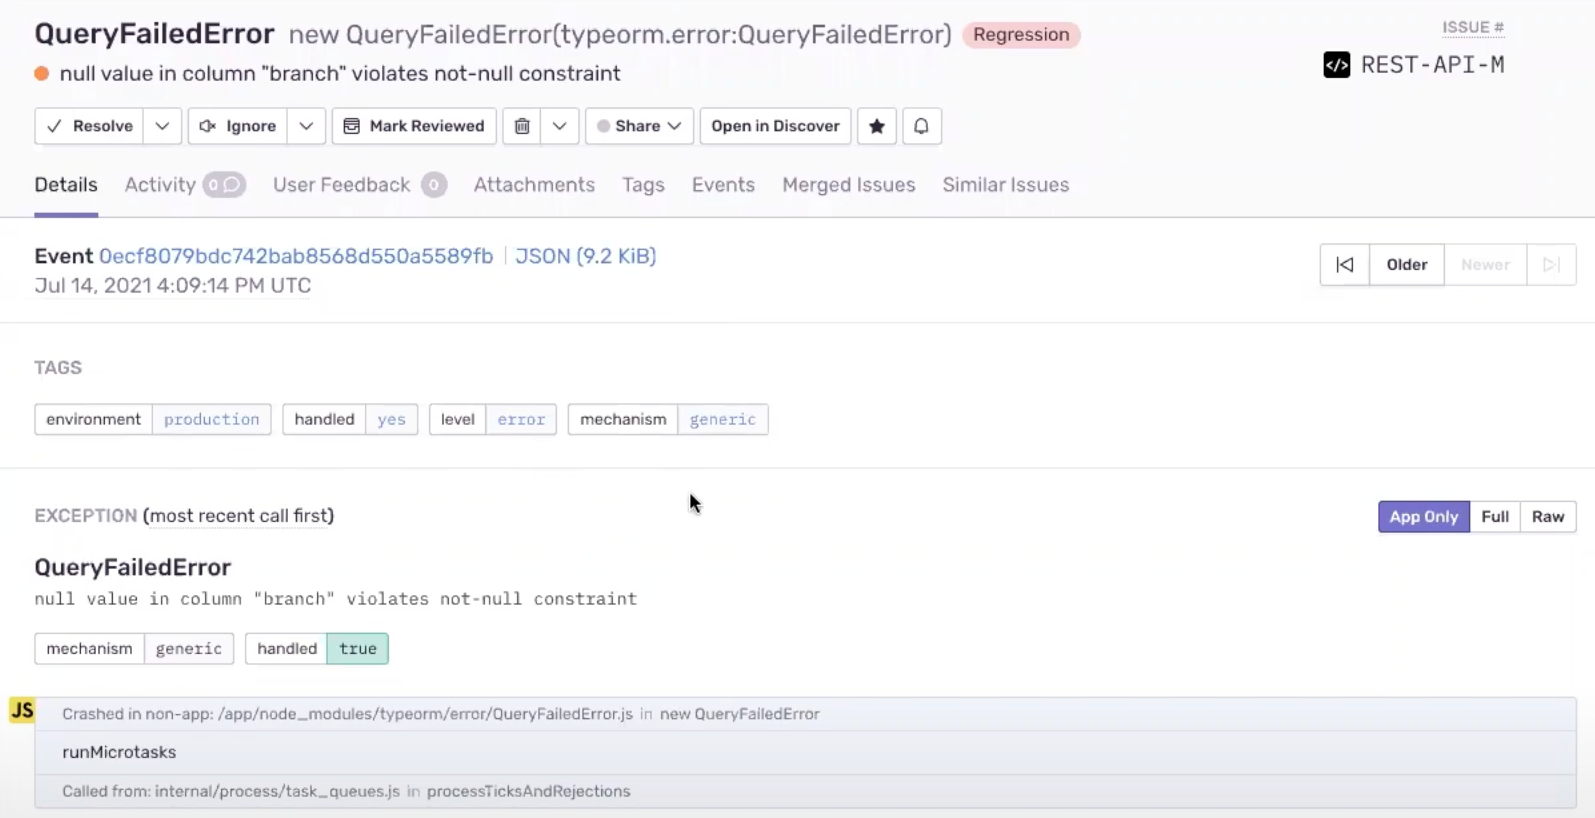
With just one click you can jump from Slack to Komodor’s troubleshooting platform, and see the full timeline of changes for that specific service. Here you can see that before the service turned unhealthy, a feature flag related to the DB was deployed, followed by a Sentry exception: ‘QueryFailedError: null value in column “branch” violates not-null constraint’.
Clicking on the exception provides you with extra details and the option to view the exception on Sentry’s platform, where you can see more data enriched with tags (environment, mechanism, feature flag, etc.) and a stack trace that allows you to follow the breadcrumbs all the way to the specific line of code that caused the exception. Now you can use all the time and energy you’ve saved to focus on actually debugging.
Check out the live demo or to learn more about komodor, visit komodor.com. And if you’re new to Sentry, you can try it for free today or write to sales@sentry.io to get started.

