How to debug, log, and monitor performance in Node.js
How to debug, log, and monitor performance in Node.js
You’re a good developer, that’s why when writing your Node.js application, you also wrote some unit tests to ensure your logic worked as expected. But what do you do when you get an unexplainable error at runtime? And how do you ensure that your app runs as efficiently as possible without memory leaks?
We’ve all used console.log() to debug errors but there are easier ways for Node.js debugging, logging, and performance monitoring. And that’s what you will learn in this guide.
Quality assurance in Node
Let’s start with the basics: how exceptions work in Node.
Exceptions and errors
An exception is any value thrown by a throw statement in Node. You could write the following:
throw "An error occurred";
But it’s more useful for error handlers to throw exceptions using an Error that contains a stack trace of where it was thrown:
try {
  throw Error("Low level error");
} catch (error) {
  throw Error("New error message", { cause: error });
}
An Error is a Node class. All system exceptions are of type Error or its subtypes like SyntaxError or RangeError. The Error.code property pinpoints the cause of an error, such as EEXIST or EACCES.
If you are using callback-style functions instead of await, check for errors that are returned instead of thrown:
fs.readFile("does not exist", (error, data) => {
  if (error) {
    console.error("There was an error reading the file!", error);
  }
});
For common errors and how to fix them, see our Sentry Node.js answers series.
How to detect & prevent errors in Node
In an ideal world, however, you’re not only reliant on errors showing up in the console. There are more active approaches to detecting and preventing errors from happening in the first place. This guide goes into details on these techniques:
Testing: Prevent errors before they occur. This is done by a developer or a program with either a unit test or an integration test. Node provides a native test package, so you rarely need an external framework.
Logging: Detect existing errors by writing to a log file to create an auditable history.
Monitoring: Detect errors and performance slowdowns through connected and contextualized dashboards.
Debugging: Leverage various tools to investigate the cause of an existing error and fix it.
Logging in Node.js
In this section, you’ll learn how and what to log.
Log Levels
Depending on whether the app is running in production or locally or whether you are trying to fix an error or improve performance, you can filter log messages by their level of importance.
Messages can be ranked into log levels from least to most severe:
debugis occasionally useful when working on a specific programming task. Examples are logging successful downloads or opening a file.infoorlogis used when things are working as expected and auditors might want to know about it in the future. Examples are user login or payment made.warnindicates something might cause an error or is a security risk. Users might need to see this. Examples are login password was wrong or RAM use is 90% of maximum.error— indicates that something has gone wrong. Users have to see this. Examples include a failure to connect to the server or a calculation result that’s not a number.fatalindicates something has gone wrong so badly the application will exit after logging this message. Examples include an out-of-memory error or failure to connect to a database.
Console Log Functions
Node has two ways of logging to the terminal with multiple function names that do the same thing.
To print to stdout, use these commands:
console.debug("File opened: %d", code);
console.log("File opened: %d", code);
console.info("File opened: %d", code);
To print to stderr, use these commands (they are synonyms):
console.error("File error: %d", code);
console.warn("File error: %d", code);
These functions take a string as the first parameter and an infinite number of additional parameters you can use as string substitutions in the first string.
Despite these console functions appearing to match the standard log-level groups discussed earlier, you cannot separate the output other than by stdout and stderr.
If you want to use basic console logging in your application rather than an external logging package, write a facade between the console functions and your own code. So, if you ever want to use a library in the future or disable or redirect a certain log level to a file, you can make the changes in one place and not everywhere you’ve made a log call. Below is a simple example of a log facade:
const log = {
  debug: function (msg, ...args) {
    console.log(msg, ...args);
  },
  info: function (msg, ...args) {
    console.log(msg, ...args);
  },
  error: function (msg, ...args) {
    console.error(msg, ...args);
  },
  warn: function (msg, ...args) {
    console.error(msg, ...args);
  },
  fatal: function (msg, ...args) {
    console.error(msg, ...args);
  }
};

log.warn("Cannot connect. Retrying...");
There are two more utility functions you need to know about. The first is trace, which will log a message and the stack trace of the current line to stderr. You could use trace in place of console.error in the facade above.
console.trace("File error: %d", code);
//  Trace: File error: 5198
//    at repl:2:9
//    at REPLServer.defaultEval (repl.js:248:27)
//    at bound (domain.js:287:14)
//    at REPLServer.runBound [as eval] (domain.js:300:12)
//    at REPLServer.<anonymous> (repl.js:412:12)
//    at emitOne (events.js:82:20)
//    at REPLServer.emit (events.js:169:7)
//    at REPLServer.Interface._onLine (readline.js:210:10)
//    at REPLServer.Interface._line (readline.js:549:8)
//    at REPLServer.Interface._ttyWrite (readline.js:826:14)
The second utility function is time, which works with timeEnd and writes the elapsed time to stdout.
console.time("computePi");
computePi();
console.timeEnd("computepi");
// Prints: computePi: 225.438ms
Logging to a File
To log console statements to a file, redirect your stdout and stdin to log files:
node app.js > out.log 2> err.log
#or log both outputs to the same file:
node app.js > logfile.txt  2>&1
Use >> to append to a file instead of > to overwrite a file.
Alternatively, you can add code to the log facade shown earlier to save log messages of error severity or higher to a file.
Log Objects, Not Strings
Rather log an object than a string or error code alone:
console.error({
  severity: "warning",
  area: "finance",
  user: "bob183",
  message: "Payment failed"
});
Logging objects enables your log file to be read as JSON by auditing tools so that they can filter errors into categories. This effectively turns your log file into a key-value database. Define a list of properties you want to log in advance to keep the number of keys in the log file to a known and understandable amount.
Use a Logging Package
If you want to log messages to different files, a database, and the console, as well as automatically format logs as JSON with dates and a stack trace, it is faster to use an external logging package than writing the logging functionality yourself. Winston is the most popular logging package on GitHub.
Here is how you create a logger with Winston:
```
import * as winston from "winston";
const logger = winston.createLogger({
  level: "info",
  format: winston.format.combine(
    winston.format.timestamp(),
    winston.format.json(),
  ),
  transports: [
    new winston.transports.File({ filename: "error.log", level: "warn" }),
    new winston.transports.File({ filename: "info.log" }),
  ],
});
if (process.env.NODE_ENV !== "production") {
  logger.add(
    new winston.transports.Console({
      format: winston.format.simple(),
    }),
  );
}
logger.error("winston error");
```
This code will write to error.log the line {"level":"error","message":"winston error","timestamp":"2024-05-24T09:46:05.534Z"}.
Winston’s log levels are:
const levels = {
  error: 0,
  warn: 1,
  info: 2,
  http: 3,
  verbose: 4,
  debug: 5,
  silly: 6
};
Log Errors in an External Tool
After your errors are logged to a file, you need to analyze the file or write code to analyze it to find problems, which takes time away from running your business or, better yet, working on new features.
A better approach is to use an external service to help you track errors. A tool like Sentry tracks errors in your Node server, client-side web app, and mobile app. Sentry also provides a dashboard that groups frequently occurring errors into issues to show your quality assurance team what needs attention.
Debugging in Node.js
Logging is a way to detect errors. By adding log statements to your code with the value of variables, you can investigate and debug errors. But logging generally isn’t the best debugging tool because:
Writing and later removing log statements is time-consuming.
You must repeatedly run your program and modify your statements during the investigation.
You can’t pause your app and modify variable values.
A better alternative is using the Node inspector, which addresses these limitations.
Debug in the Terminal
On rare occasions, you might want to debug your Node script directly in the terminal instead of using a Graphical User Interface (GUI). Debugging quickly in a shell session is useful when you have an error that occurs only on a production server.
To start debugging, run node inspect app.js in your terminal (replace app.js with the name of your app’s entry file). Type help to see all available commands. There are only a few commands you need. Here are the commands for navigation, breakpoints, and watchers:
Command and abbreviation | Effect |
| List 3 lines around the current line that is running. |
| Next line. |
| Step into. |
| Step out. |
| Continue execution. |
_ | _ |
| Set a breakpoint on line 3 in the current script, or a script you specify. |
| Clear the breakpoint. You have to specify the script by name, or you will get the error |
_ | _ |
| Add an object to a list of variables to watch. Note you must quote the object name, |
| List all variables you are watching and their values. |
| Execute a command. |
_ | _ |
| Exit the debugger. |
The Node documentation says you can start debugging with the command node debug app.js, but it does not work.
Debug in a Browser
If you run node --inspect app.js or node inspect app.js, Node allows a debugging client to attach to it. By default, a WebSocket is available on localhost port 9229, where each app has a UUID like Debugger listening on ws://127.0.0.1:9229/a90c83e7-a9c9-48b2-9e1e-394e1f02dabe.
You need an app that runs Node’s V8 JavaScript engine to connect to this WebSocket, like Chromium, Chrome, Brave, or VS Code. All these apps are built on Chromium, which uses the V8 engine. You cannot use Firefox or Safari to debug Node because they use different JavaScript engines.
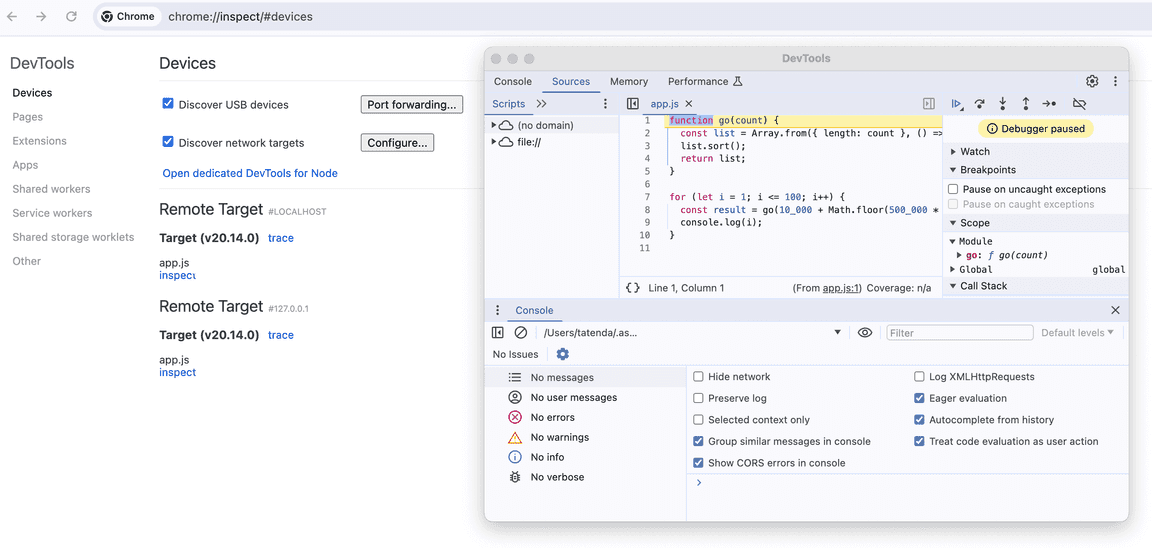
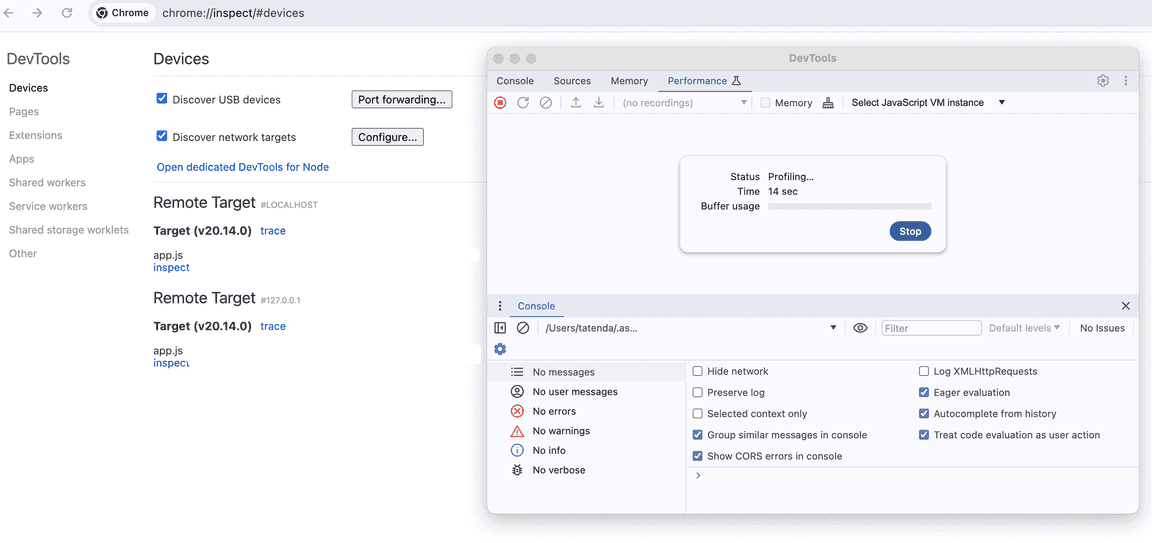
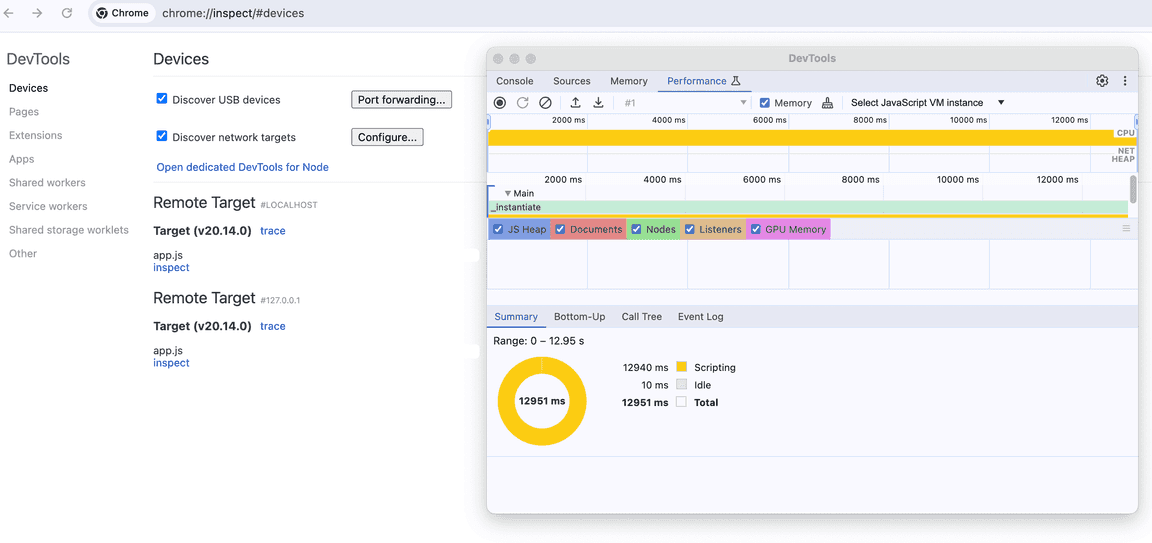
In your browser, browse to a URL like chrome://inspect/#devices and replace chrome with your Chromium-based browser name. Click inspect under your app filename on the page to start debugging.
Now you can use the debugger in the same way you use DevTools to debug a webpage.
Run Inspect Inside Docker
If your Node app runs inside Docker, take two steps to ensure connectivity:
Start the inspector inside Docker to listen on all addresses:
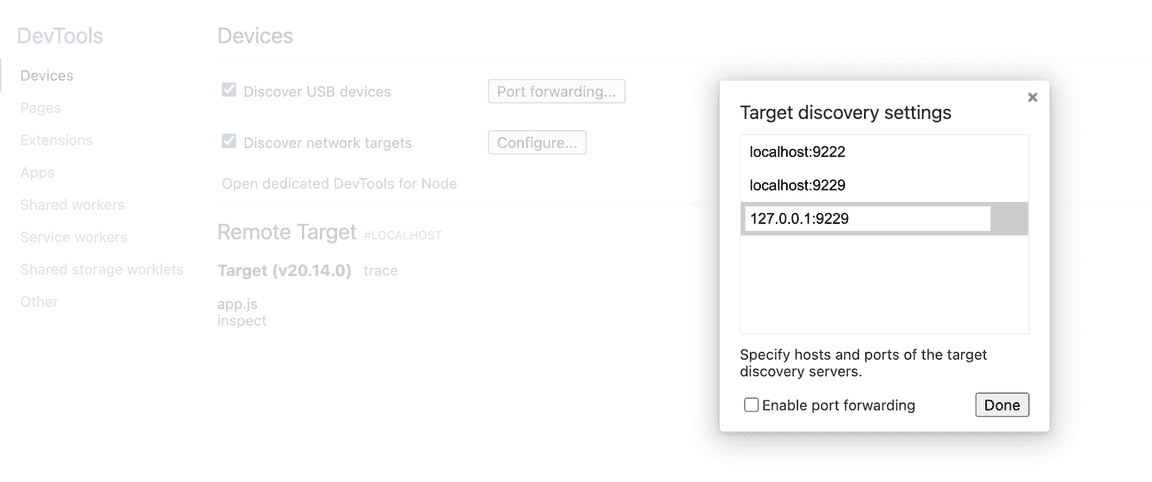
node --inspect=0.0.0.0:9229 app.js.On the Chromium page at
chrome://inspect/#devices, enableDiscover network targets, clickConfigure, and add127.0.0.1:9229.
Why are these steps needed?
By default, the Node inspector uses the
127.0.0.1loopback address that only listens for connections on the same computer. Using0.0.0.0causes the app to listen to connections on all IPs.By default, the Chromium debugger listens on
localhost, which might point to127.0.0.1or might point to an IPv6 address that Docker is not connected to.
Debug in Visual Studio (VS) Code
Visual Studio Code (VS Code) has many options for debugging JavaScript and TypeScript. This guide demonstrates only the most common. For more, see the official documentation.
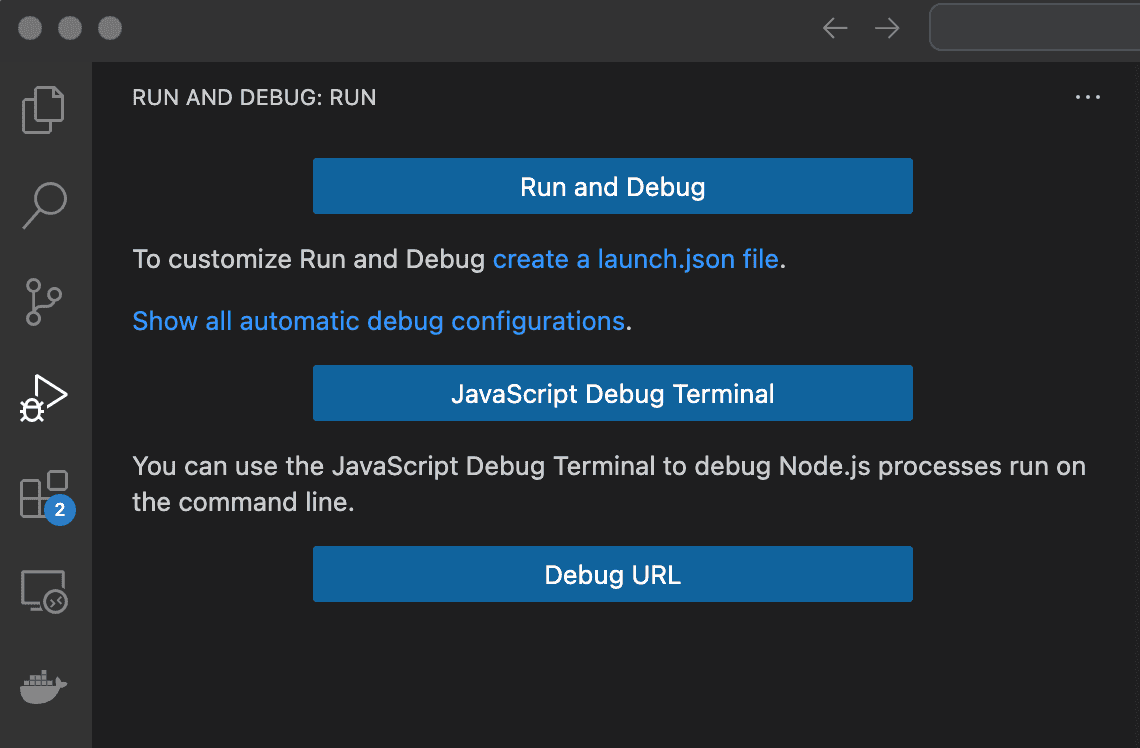
While you can attach a debugger to running Node processes or launch debuggers in the VS Code integrated terminal, the easiest way to debug your app is to use the Run and Debug side panel.
Open a JavaScript file, and in this panel (this won’t work for TypeScript, but there’s more detail about this below), click Run and Debug, and choose Node.js. For this to work, you must have Node installed on your computer.
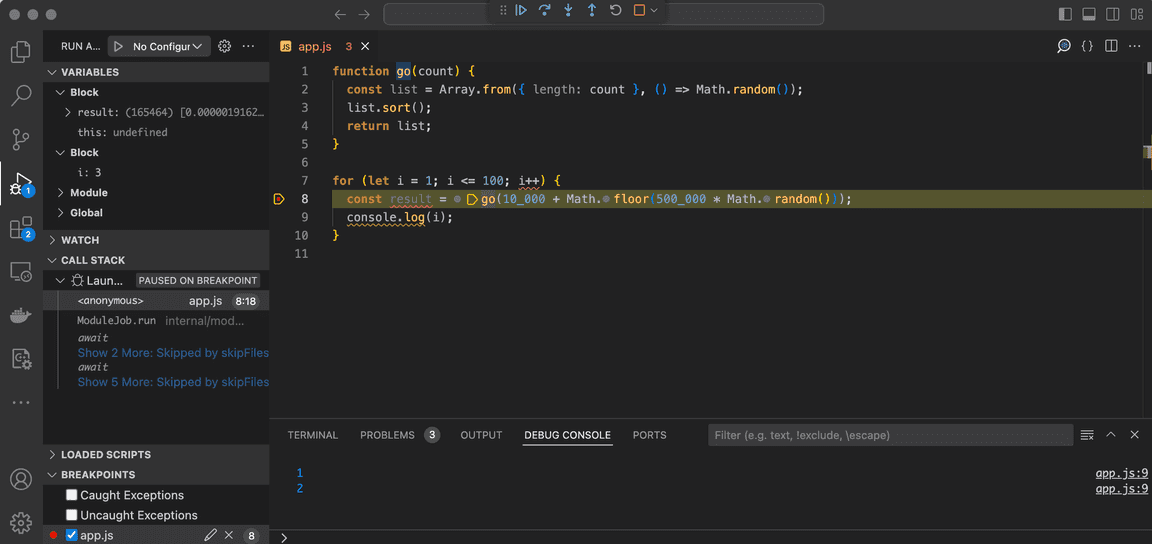
At the top of your screen are navigation commands identical to those in the terminal debugger but with different hotkeys. You can create breakpoints by clicking a line number in your source code. Right-click the breakpoint to set a condition that will pause the code execution. The DEBUG CONSOLE at the bottom lets you enter JavaScript commands when execution is paused. You can see the values of variables in the pane on the left side and enter expressions to watch their values as execution proceeds.
Launch Configuration Files
If you want to run your app through an npm script in your package.json file or set certain environment variables for the app, you need to create a launch configuration.
In the Run and Debug panel, click Create a launch.json file and choose Node. This action creates a hidden folder and file: .vscode/launch.json. See the documentation on how to set properties like env and runtimeExecutable.
Remote Node.js Debugging and Docker Dev Containers
If you run your Node app in a Docker container for security reasons or to have an identical runtime environment among all developers on your team, Node.js debugging is a little trickier. VS Code supports remote debugging by attaching to the Node inspector on a network port, but it’s less powerful than debugging on the same machine.
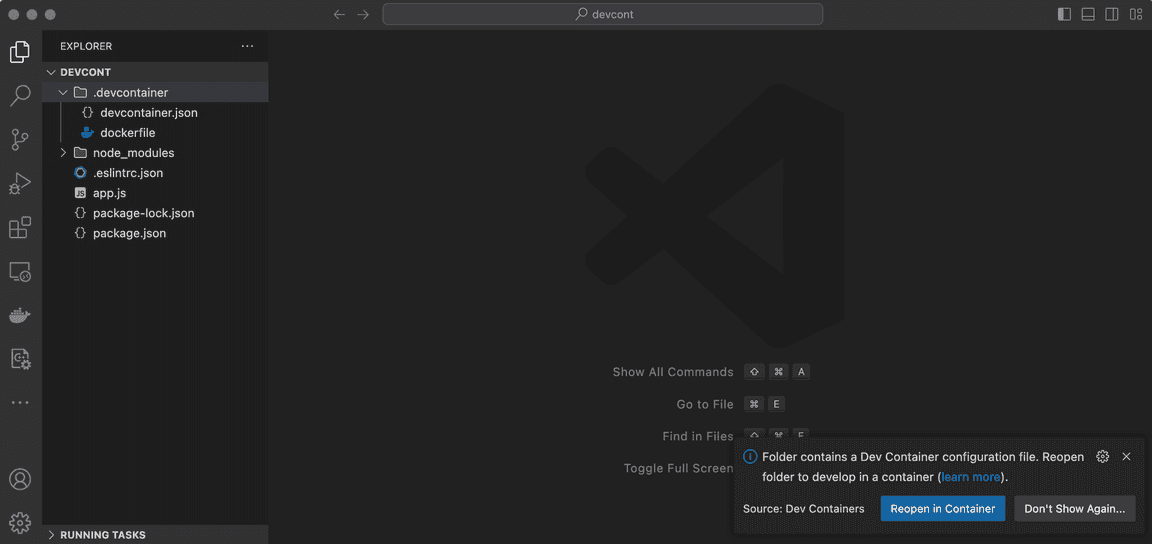
The best solution is to run VS Code and Node in the same Docker container by using the Dev Containers extension. See the official documentation here.
In the Extensions side panel, search for and install the “Remote Development” extension pack, which includes Dev Containers.
In your app repository folder, make a folder called .
devcontainer.Move your
dockerfilefile for the app into .devcontainer.Below is a simple Dockerfile example for Node:
FROM --platform=linux/amd64 ubuntu:24.04
ARG DEBIAN_FRONTEND=noninteractive
RUN apt update && apt install -y nodejs npm && rm -rf /var/lib/apt/lists/*
Make the file
.devcontainer/devcontainer.json. For example:
{ "name": "Node Development Container", "dockerFile": "dockerfile", "forwardPorts": [], "postCreateCommand": "", "remoteUser": "root", "customizations": { "vscode": { "settings": { � "terminal.integrated.shell.linux": "/bin/bash" }, "extensions": [ "adrianwilczynski.toggle-hidden" ] } } }
To find the names of your extensions to add to the configuration file, open your extension, and under the settings cog, click Copy Extension ID.
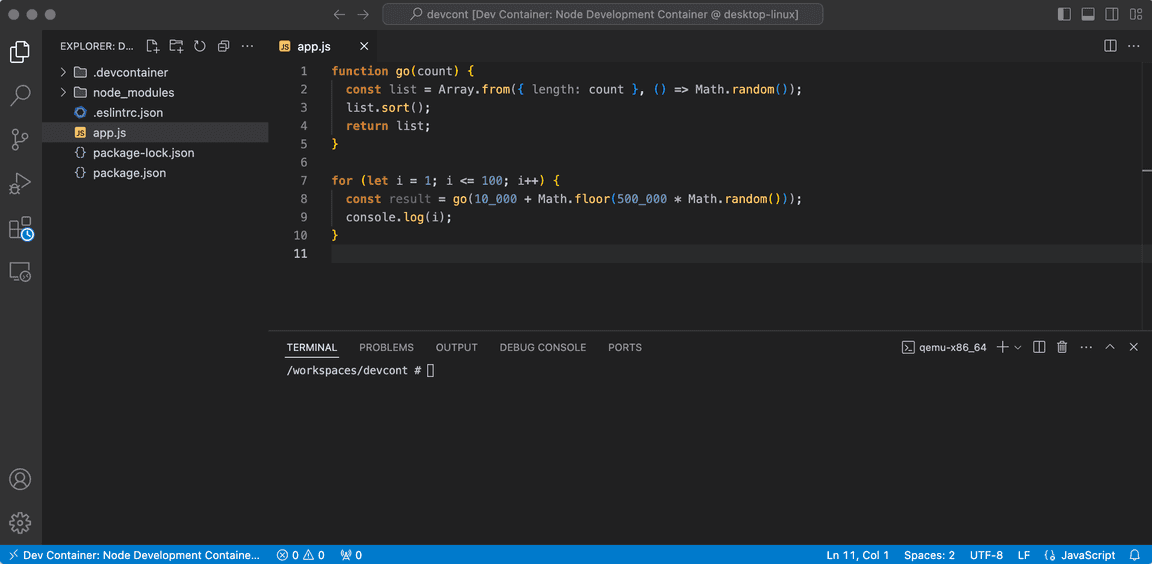
When you open this folder in VS Code, a notification should ask you to reopen in a container. Click the button to confirm.
When the container finishes building for the first time and opens, you can work in VS Code in the same way as on your physical machine. Your code folder will now be located in a subfolder of /workspaces.
How To Debug TypeScript in VS Code
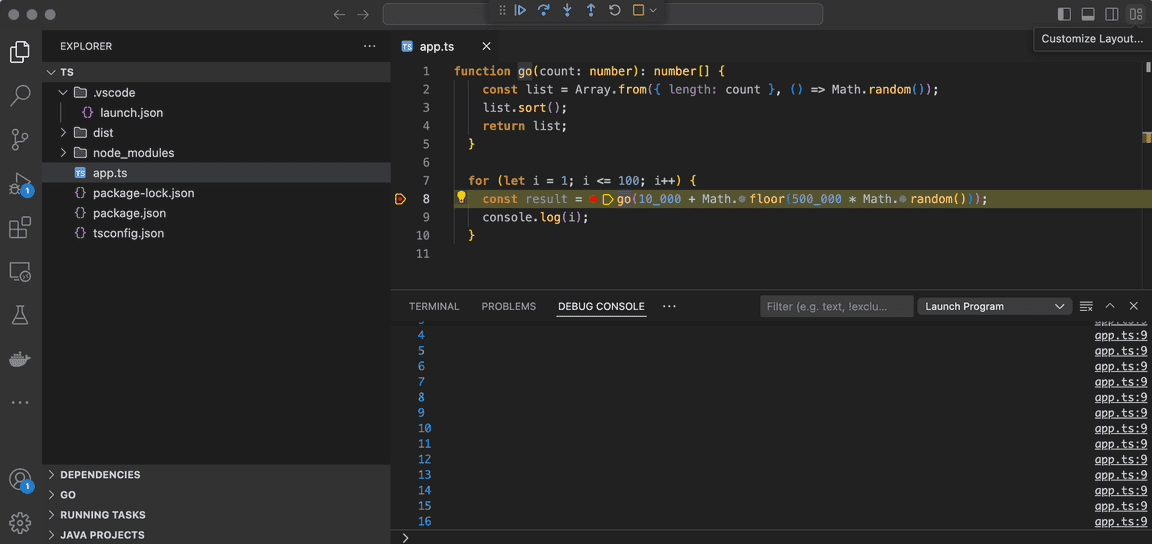
If you try to run and debug a TypeScript file in VS Code, you’ll immediately get a SyntaxError when Node encounters TypeScript type definitions. Take the following steps to allow TypeScript debugging in your repository folder:
Run
npm install typescriptto install the Typescript compiler (tsc).Create a
tsconfig.jsonfile. Use the following content to map the JavaScript output to thedistfolder and your source TypeScript:
{
  "compilerOptions": {
    "target": "ESNext",
    "module": "ESNext",
    "outDir": "dist",
    "sourceMap": true
  }
}
Create a
launch.jsonfile by going to the Run and Debug panel and clicking Create a launch.json file. Use a config similar to the following to compile to yourdistfolder before debugging:
{
  "version": "0.2.0",
  "configurations": [
    {
      "type": "node",
      "request": "launch",
      "name": "Launch Program",
      "skipFiles": [
        "<node_internals>/**"
      ],
      "program": "${workspaceFolder}/app.ts",
      "preLaunchTask": "tsc: build - tsconfig.json",
      "outFiles": [
        "${workspaceFolder}/dist/**/*.js"
      ]
    }
  ]
}
Now, you can run and debug TypeScript code using the same methods discussed earlier in this guide for JavaScript.
Node application security
The inspector has full access to Node and will run any dangerous code it’s given, including accessing your disk drive and sending information out to the internet. The inspector also accepts any debuggers that want to connect to it, with no authentication security.
To prevent malicious programs from accessing your Node debugger, only allow connections to localhost or a port without internet access.
It’s best to run Node applications in a Docker container on your development machine anyway, as a malicious npm package has full permission to do anything on your machine.
Besides the inspector, a Node app has many security vulnerabilities. Please read the guide on how to protect your server.
Profiling and Optimization in Node
When you’ve used logging and debugging to detect and fix errors, work on improving the speed of your app through profiling to detect functions that take too long to run.
Below are some of the most common Node performance problems:
Event loop blockage: Node is single-threaded and can handle millions of simultaneous requests because functions return control to the main event loop frequently. But if you write long-running synchronous code, you will block the event loop, causing massive delays in throughput.
Memory leaks: If you notice RAM usage increasing over time, either your code or a package you are using has a reference to an object in memory that isn’t being released when it should be.
Inefficient database queries: Although database calls are asynchronous and won’t slow Node itself, each request to your server will be unnecessarily slow if your SQL queries are inefficient. Check the speed of external resources like databases and API calls before assuming a problem is your Node code.
Improper use of buffers and streams: If there is a large difference between the speed at which data enters a stream and the speed at which your app processes it, problems like an increase in RAM use can occur. Generally, Node handles streaming well by default, but if you have issues, read the documentation.
Development and Production
By default, Node runs apps in development mode. To use production mode, start your app with an environment variable:
NODE_ENV=production node app.js
Node packages check the NODE_ENV value when running and behave differently in production and development. For example, using production means packages will cache return values for faster performance and reduce logging. You can use NODE_ENV in your code to determine how Node packages behave. For example, in Express.js:
if (process.env.NODE_ENV === "development") {
  app.use(express.errorHandler({ dumpExceptions: true, showStack: true }));
}
if (process.env.NODE_ENV === "production") {
  app.use(express.errorHandler());
}
Profile in the Terminal
To find out which functions your app is spending most of its time in, run node --prof app.js. Running the command will create a file named something like isolate-0x5f6d590b7320-9654-v8.log, which isn’t understandable by humans. The profiler takes a snapshot of the Node environment at regular intervals (ticks) and logs it to the file.
To summarize the log file, run node --prof-process isolate-0x5f6d590b7320-9654-v8.log > profile.txt.
Below is a snippet from the profile file section on function duration:
[Bottom up (heavy) profile]:
  Note: percentage shows a share of a particular caller in the total
  amount of its parent calls.
  Callers occupying less than 1.0% are not shown.
   ticks parent  name
   6735   88.6%  /usr/lib/x86_64-linux-gnu/libnode.so.109
   6542   97.1%    /usr/lib/x86_64-linux-gnu/libnode.so.109
   3196   48.9%      LazyCompile: ~go /app/app.js:1:12
   3196  100.0%        Function: ~<anonymous> /app/app.js:1:1
   3196  100.0%          LazyCompile: ~Module._compile node:internal/modules/cjs/loader:1310:37
   3196  100.0%            LazyCompile: ~Module._extensions..js node:internal/modules/cjs/loader:1369:37
In the above summary, we can see the app spent 88% of its time running in the main Node library, 48% of which was running a function called go on line 1 of the source code.
Profile in DevTools
You can also see your app profile in Chromium DevTools. After running node inspect app.js and connecting the debugger in Chromium to the inspector, click the Performance tab, then Record.
Once you stop recording, the profile will be displayed.
You’ll see the order of the function executions and the time spent in each function.
Monitor Node Application Performance in an External Tool
Constantly checking your application’s speed and RAM usage can be time-consuming for developers. An alternative is to let an external tool monitor performance for you, providing a dashboard to your team and alerting you by email or on Slack if performance degrades.
Sentry can do this for you. It has an SDK that hooks into your runtime environment and automatically reports errors, uncaught exceptions, unhandled rejections, and other error types.
Summary
Run your application in production with
NODE_ENV=productionto optimize packages that use it.Use
if (process.env.NODE_ENV === 'production')in your code to optimize it for production.Always check the error variable of a callback because some callback functions error without throwing exceptions.
Throw
Errorsin exceptions and not strings.Separate your logging into levels: debug, info, warn, and error.
Log errors to a file for auditing purposes. Have an automated policy in place to archive or delete older log files.
Log objects, not strings.
Use Winston for comprehensive logging functionality.
Debug in the terminal with
node inspect app.jsand thenhelpfor commands if you are not using an IDE. But it’s better to debug by running your app from VS Code.Always block your debugging port from the internet to avoid attackers connecting to your Node process.
See which of your functions are taking the most time by using the Performance tab of Chromium DevTools, after attaching it to the Node inspector.
Apply security best practices to your app.
Use Docker and the DevContainers extension in VS Code to debug securely in identical environments for every programmer on your team.
For applications where uptime and performance are important, use a real-time performance monitoring tool like Sentry

