How to identify fetch waterfalls in React
How to identify fetch waterfalls in React
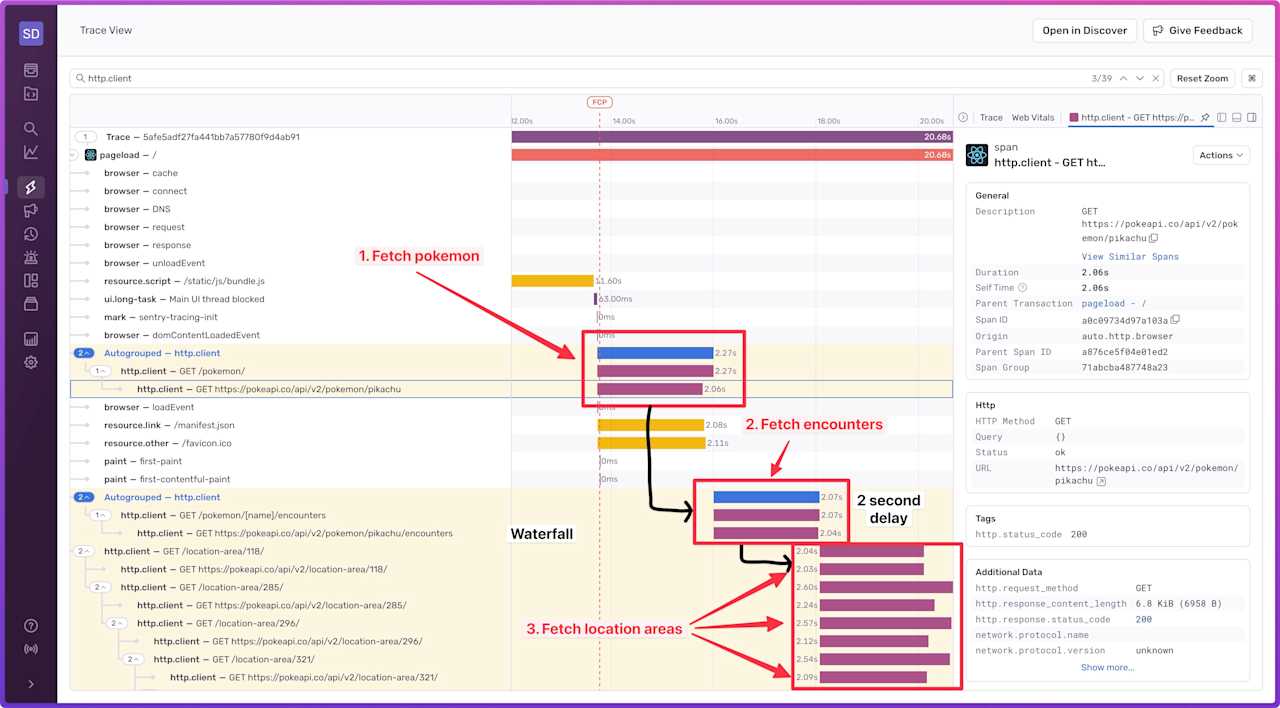
Fetch Waterfalls are scenarios where multiple fetch requests are invoked in a sequential manner, not in parallel. This leads to some serious performance degradation. Here’s how they look:
In this case, the second and third requests can be fetched in parallel, which will improve the page load and data display by 4.053 seconds. The negative performance impact with fetch waterfalls is also stacking - meaning the more requests there are, the worse the performance impact is going to be.
In this article, we’ll see how we can identify fetch waterfalls in our React applications using tracing.
A short Tracing 101
Tracing is a process of “instrumenting” your code in order to capture a trace - a debugging data set that consists of a hierarchy of spans, which describe the operations and logical groups of commands that define a certain process or flow. Let’s take a page load as an example.
If we try to describe the page load as a flow of operations, it should look something like this (roughly):
The browser requests the page from the server
The server responds with the HTML and the browser parses it
During parsing, the browser stumbles upon a linked JS file, so it makes another request for it, and then executes it. The JS file contains React and the page code, so the browser executes it.
The browser performs
fetches and renders the components as instructed by the page code.Additionally, the browser makes requests for resources like images, favicon, CSS files, etc…
All of these operations happen in a specific order, but their durations vary depending on factors like the processing power of the device, the speed of the internet connectivity, etc…
The screenshot at the top of this article shows three http.client spans that send HTTP requests to the API. Each of them have a specific start time, a specific end time, and also miscellaneous data attached to them. Looking at the trace view from the screenshot above, we can clearly see that the three HTTP requests get executed one after the other - or, in a waterfall fashion.
Setting up your project
First, we need Sentry set up in our React project. To get started, we need to install the Sentry React SDK:
npm install @sentry/reactAt this point, you should already be signed up. Let’s create a new React project:
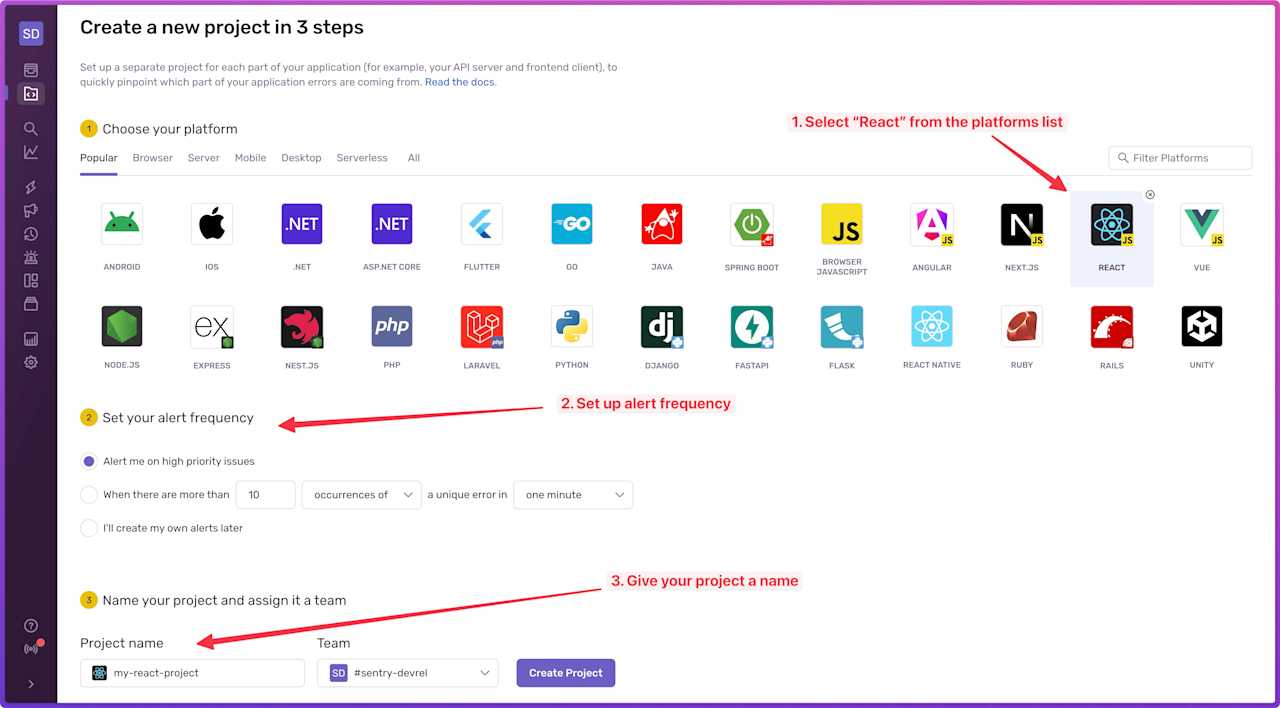
After you hit the “Create Project” button you’ll see instructions on how to install the React SDK and how to initialize it. The initialization configuration should look something like this:
import * as Sentry from "@sentry/react";
import App from "./App";

Sentry.init({
  dsn: "[NEW_PROJECT_DSN]",
  integrations: [
    // Enable tracing
    Sentry.browserTracingIntegration(),
  ],
  // Configure tracing
  tracesSampleRate: 1.0, //  Capture 100% of the transactions
});

const container = document.getElementById(“app”);
const root = createRoot(container);
root.render(<App />);
The best part about the Sentry SDK is that it automatically instruments the majority of your codebase for you. It automatically wraps known operations like fetch with spans and sends them to your Sentry instance so you can immediately start inspecting the data.
With this in place, we can deploy our app so we can get actual performance data measured while our users are using the app. Once we have some data, we can start looking into identifying performance issues like fetch waterfalls.
How to identify fetch waterfalls in React?
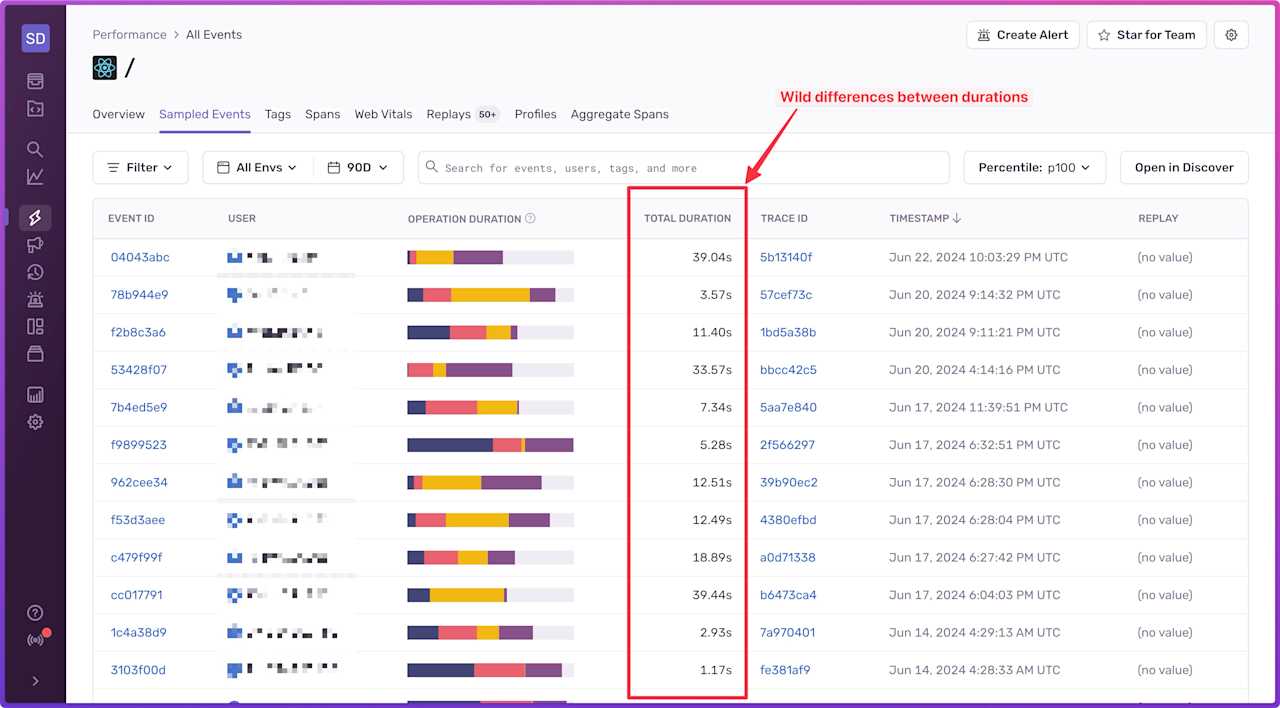
The “fetch waterfall” symptoms include a significantly slower page load, so we should be on the lookout for suspiciously slow page loads. Using the Performance page, we can easily pick out suspiciously slow page loads and inspect them. Here’s a screenshot of the Performance page for the index page of our app that shows transactions captured while users were visiting our page:
We can clearly see which ones are suspiciously slow. Clicking on one of them will show us the Trace View screen where we can see all of the spans. If we zoom in and look closely to the http.client spans, we can see a waterfall:
In this case, the third request group does not need to wait for the second request to finish, because it does not depend on any of the results. That means that we’re looking at a 2-second improvement, if we break down the fetch waterfall.
Fixing fetch waterfalls involves looking into how they’re being caused. Fetch waterfalls can also be on the server. If you’re interested to learn more about how to fix common cases of fetch waterfalls, check out my “Fetch Waterfall in React” article.
Looking at this, you might think that you can solve other types of issues using tracing. And you’d be right! Tracing is a really common debugging technique that helps us identify, debug, and fix other issues as well, like bad Web Vitals, network latency, cold starts in serverless applications, cache missing or issues in caching mechanisms, and a number of different issues and bugs. Tracing can be used to debug and fix anything that involves following a “trace”, looking at what happened when, or how long it took.
Conclusion
So that’s how Tracing can help us identify fetch waterfalls. A quick recap:
Tracing is a debugging technique that involves capturing debugging data that makes it easy for us to visualize operation flows, like a page load.
A trace is a collection of spans that relate to each other, have a start and end time, and also have arbitrary data attached to them.
To get started with capturing traces in your application, we installed Sentry’s React SDK, initialized it at the top of our app, and simply deployed our changes. The SDK automatically instrumented our app, so we could see tracing data straight away.
We listed all of the captured traces, and based on their durations we could see which ones were suspiciously slow.
Inspecting the slower page loads revealed a fetch waterfall that, when optimized, could improve the page load in terms of seconds.
Hope this article helps you understand what tracing is and how to get started. Happy tracing!


