How we decreased P99s on our backend API requests by 3 seconds
How we decreased P99s on our backend API requests by 3 seconds
At Sentry, we don't just build debugging tools for developers—we use them ourselves. This story demonstrates how we leveraged our own platform to solve a mysterious performance issue that was causing significant latency spikes in our critical infrastructure which is used in nearly every backend request.
The setup: growing pains and EU data residency
As Sentry has grown, we've added features that have increased our system's complexity. One significant addition was EU Data Residency, where we store customer data in EU data centers. For administrative data like subscriptions, we maintain a central "RPC Control Silo" service that coordinates across all regions.
Over time, we noticed these cross-region calls were becoming increasingly sluggish. What started as a minor inconvenience evolved into a serious issue, with our 99th percentile (P99) response times exceeding 2 seconds. The problem finally demanded our attention when users started reporting consistently slow page loads.
The investigation: peeling back the layers
Armed with Sentry's performance monitoring, we began investigating these slow service calls. Our initial trace views pointed to our Django rate limit middleware as the culprit. However, when we added more detailed spans for investigation, we discovered something puzzling: the rate limiter wasn't even active for these calls. The latency was coming from somewhere else.
While our tracing gave us a starting point, we needed deeper insights to get to the root cause. That's where profiling came in.
The root cause: a classic cold start problem
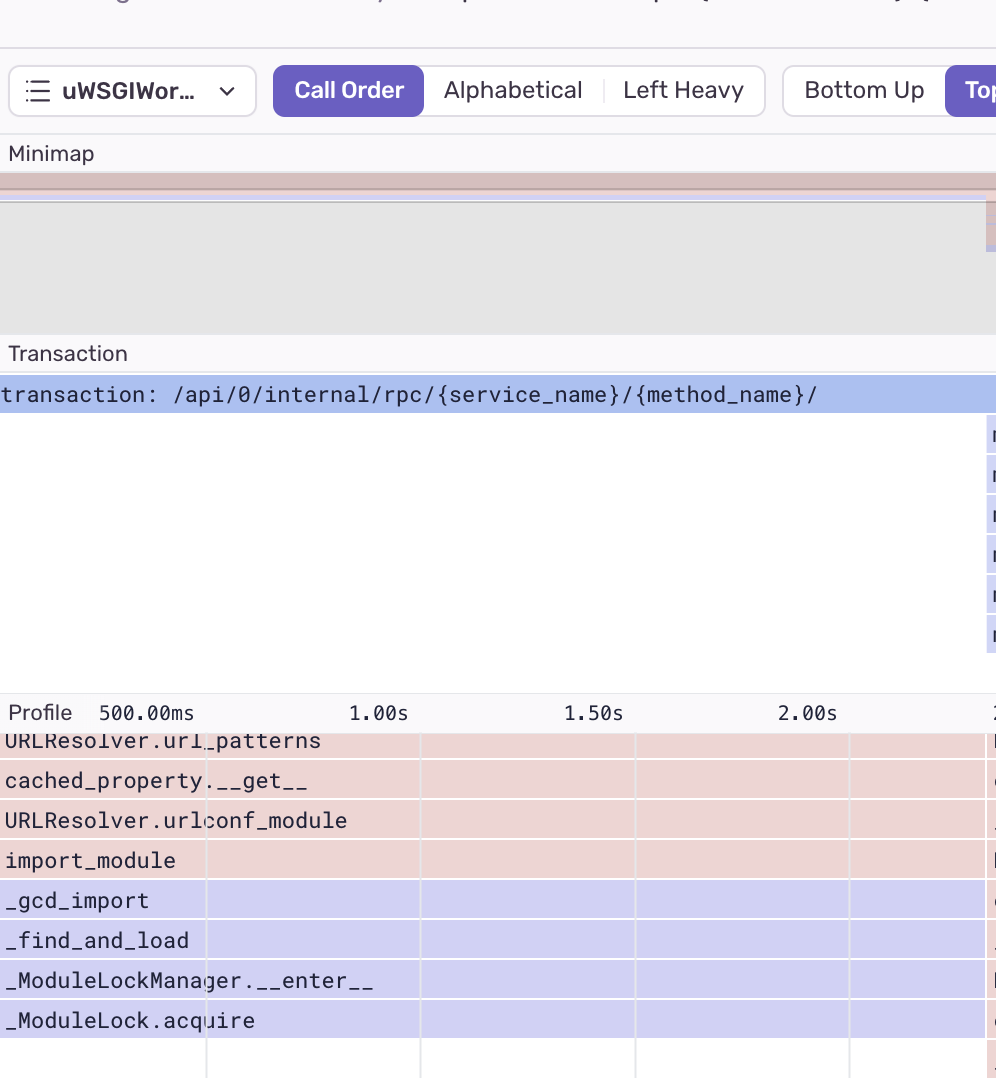
With profiling enabled, the issue became glaringly obvious. During middleware execution, we were triggering an import cycle—a classic "cold start" problem. For those unfamiliar, a cold start occurs when an application's first request takes longer to process than subsequent ones, typically due to Python's lazy import system.
Our setup uses multiple uWSGI threads to handle requests. When these threads were starting up, they were blocking all other threads during the import process. In production, our threads were recycling frequently, meaning roughly 5% of requests were hitting a thread in this startup state.
The solution: warming up our uWSGI workers
Ironically, we had already implemented a solution for this exact problem—a warm-start process for our uWSGI workers. However, during our investigation, we discovered that this feature wasn't active in production due to a conflicting configuration value.
The fix was straightforward: we corrected the configuration to ensure workers properly warmed up before serving requests. This meant hitting a simple health check endpoint to load necessary imports before processing actual user requests.
The results: reduced endpoint response times by over 2 seconds
The impact was dramatic:
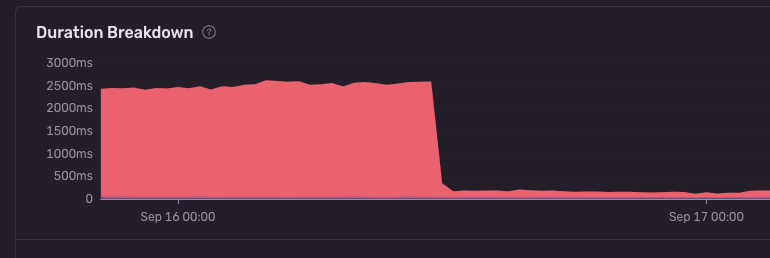
Our P99 response times for RPC endpoints dropped from 2.4 seconds to 176 milliseconds—a reduction of over 2 seconds. The P99 graph from the transaction summary:
Complex operations like our alert rule setup, which previously took 10+ seconds due to multiple RPC calls, saw significant performance improvements
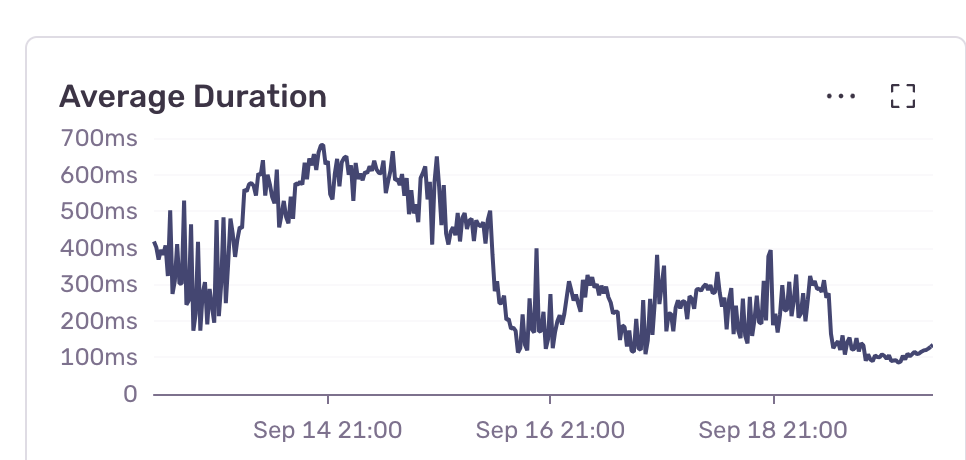
Overall system responsiveness improved as these performance gains rippled through our infrastructure. Using the insights request module, we saw the average duration of requests improve significantly after the change.
What’s next?
While the warm start process is working well, there’s still room for further optimization, like preloading additional modules or initializing more connections upfront. But even with this small change, we’re seeing fewer cold starts, faster response times, and a little less frustration for both us and our users.
Try it for yourself. To set up tracing, just follow the instructions in our docs to start sending spans. For Profiling, follow this link and you’ll be good to go.
If you have any feedback please feel free to reach out on our Discord server, on X @getsentry, or by joining the discussion in GitHub.


