How We Made JavaScript Stack Traces Awesome
How We Made JavaScript Stack Traces Awesome
Sentry helps every developer diagnose, fix, and optimize the performance of their code, and we need to deliver high quality stack traces in order to do so.
You might have noticed a significant improvement in Sentry JavaScript stack traces recently. In this blog post, we want to explain why source maps are insufficient for solving this problem, the challenges we faced, and how we eventually pulled it off by parsing JavaScript.
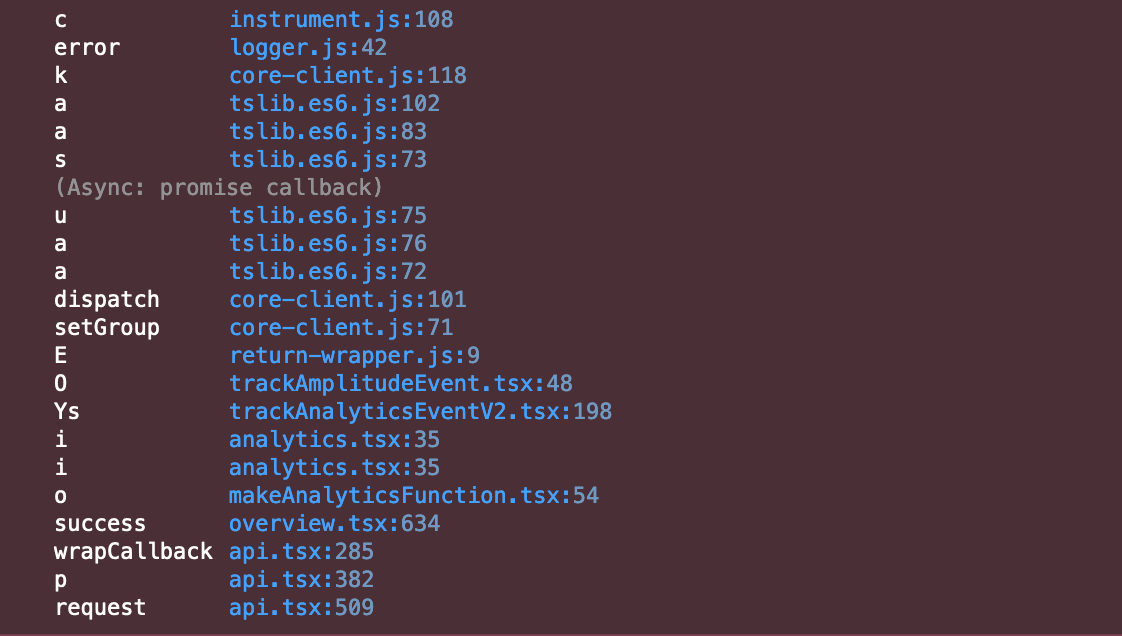
As a JavaScript developer, you are probably all too familiar with minified stack traces. Even with source maps present, browsers are typically unable to show you something readable in the console:
You would think that showing the correct function names in a stack trace would be the primary use case of source maps. Ironically source maps are almost entirely useless for this purpose.
In the past, you might have seen some Sentry stack traces, even with source maps in use, where the function name was a misleading apply, call, fn, or some completely random unexpected function name. We long wanted to improve this.
Say hello to JavaScript Source Scopes.
Setting the Stage
When working with a JavaScript engine, Sentry is mainly concerned with stack traces, most of which are typically minified, which means the line, column, or displayed function name must be corrected. It will also be highly unstable between different releases and transpiler runs. That’s no fun, and so for many years, we have supported source maps to deobfuscate stack traces. If you want to go deep into the gnarly issues with source maps and the troubles we faced with them you might also want to read this post.
Old Implementation
For years, our solution to the problem relied solely on rust-sourcemap, a Rust crate we wrote to speed up the processing of source maps, which works great in most cases.
We use source maps to ask three questions: where is this in the original file? What's the original function name? What's the surrounding function?
The first and third questions are easy to answer, source maps are quite good at that. But the function names are incorrect. That’s because when we ask a source map about location information (say line 1337, column 42), it points at some token, but not the one that declares the function. Remember the questionable stack trace from the browser console earlier? That's because modern browser stack trace rendering does not try to answer that question at all. Source maps are really just a way to map token to token, and what we care about is understanding the surrounding scope information, which is frustratingly missing in source maps. Another way to think about this is that we don't need to know what token is called when the function call happened, but the name of the function the token is contained in.
Take this trivial example:
function thisLovesToCrash() {
callTheCrashingThing();
}
function callTheCrashingThing() {
throw new Error("kaputt");
}After minification, it turns into an absolute mess. For simplicity reasons, let’s assume the compiler renames the first function, thisLovesToCrash, to a and the second function, callTheCrashingThing, to b.
function a(){b()}
function b(){throw new Error("kaputt")}
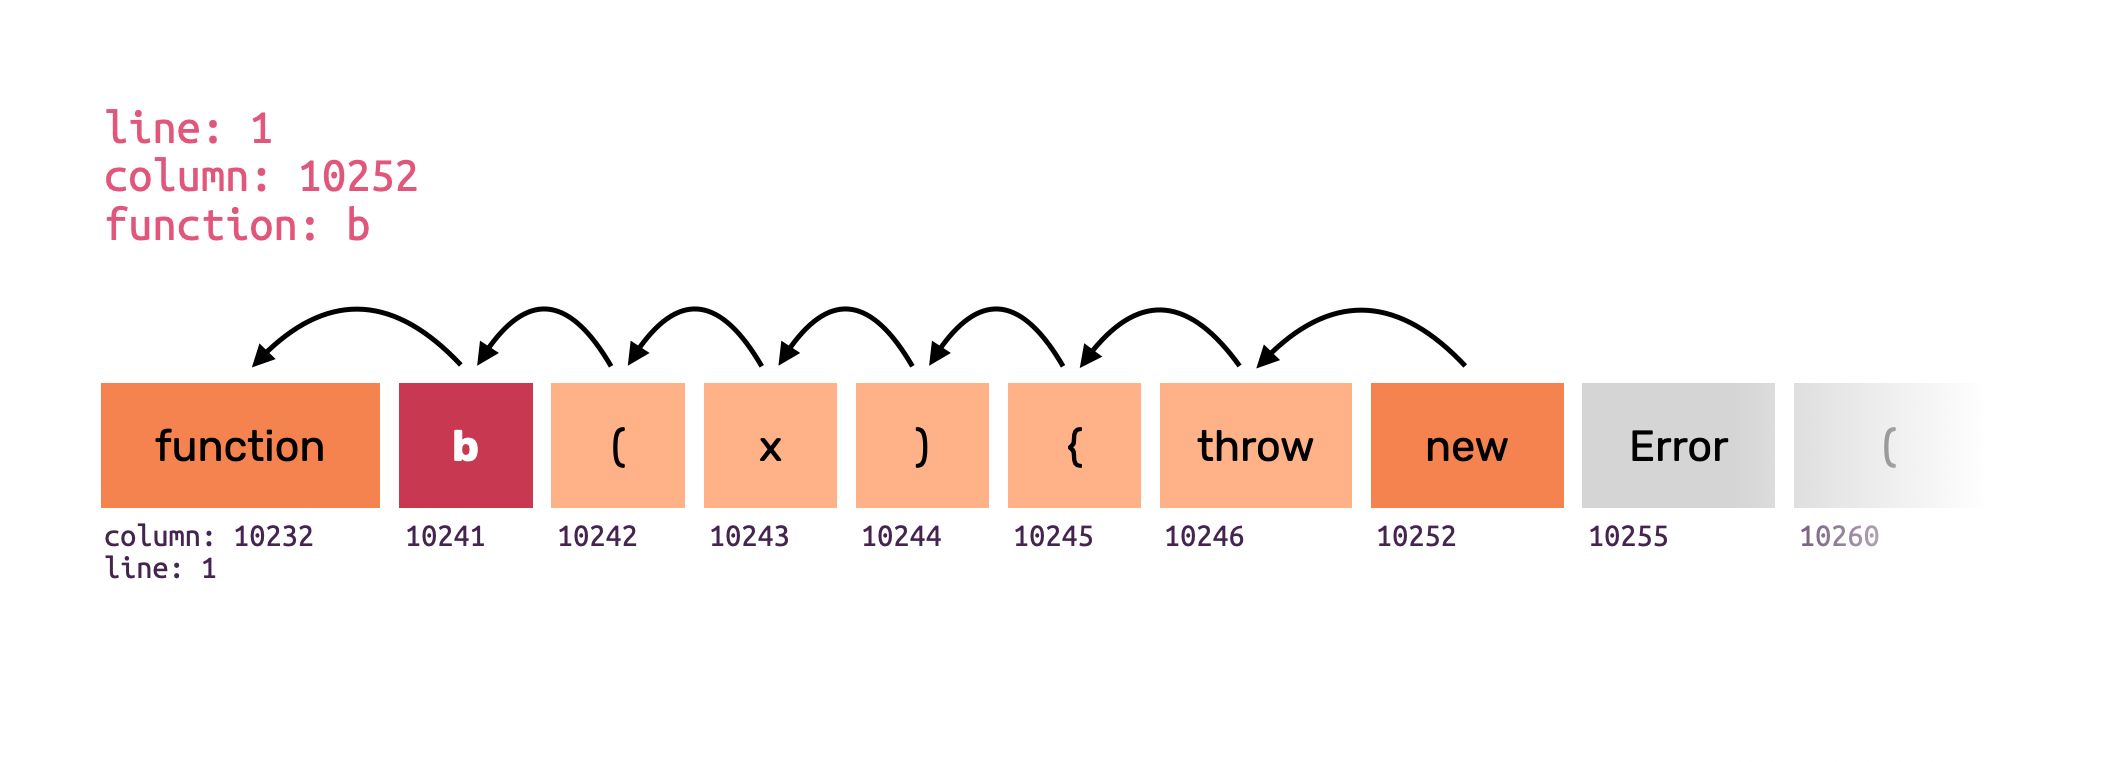
The line and column information will point to neither of those functions when we look at the stack trace. Instead, in the first case, it will point to the token that calls into the function (b aka callTheCrashingThing), and in the second case, it might point to the new keyword, for instance, or maybe the constructor invocation of Error. If we were to consult the source map, we would not be able to retrieve the function name.
We had various heuristics about this, but it always fell short. In the past, we applied two heuristics: backward scanning for function declarations and caller naming.
Backwards scanning meant that when we were, for instance, placed on the throw keyword, we would take the minified function name that was sent to us from the stack trace (b), and then scan backwards until we find the minified function name preceded by a token called function. That way, we can sometimes find the correct function name.
Obviously, this does not work for ES6 method declarations of anonymous functions, class methods, or object property methods.
Caller naming is an approach where we take a gamble that the caller of our function refers to us by the same function name. In that case, we go one frame up, land in the function a, and then look at the current token information (b) and translate that token back to callTheCrashingThing. As with backwards scanning, this won’t work for reassigned function names. Many times the function would just be called apply, call or something like fn.
Things like anonymous callbacks, class methods, and object literal properties are notoriously wrong. It can give you some information sometimes, but usually, it's not enough for the system to correctly classify and group exceptions that contain such information together.
On top of that, it sometimes takes effort to tell where the call comes from without looking at the source code itself.
Our Improved Approach: JavaScript Parsing
In recent months, we worked hard to bring new ideas and solutions to the table. The idea is not entirely new, we have considered doing this in the past. The idea was to parse the original code to reconstruct source scopes, but actually getting a parsable source for all the languages transpiling to JavaScript was always considered a problem with a very large scope.
We did, however, reconsider this approach recently, and this work became something we call SourceMapCache. It lives as a part of our Rust symbolic crate, which handles all sorts of debugging formats.
It is built on top of our js-source-scopes crate, where the nitty gritty bits and pieces live, providing the functionality for extracting and processing scope information from JavaScript source files and resolving that scope via source maps. The change in approach is that, rather than reconstructing the scopes from the source files, we are consulting the transplied minified JavaScript files instead.
We have always encouraged developers to upload their minified files as build artifacts and not just their source files. In fact, even if you do not upload them, we always try to fetch the minified files in addition, as there is vital information in them, such as the location of the correct source map. As a result, the minified source is usually available to us. We now parse the minified JavaScript sources to reconstruct scope information. This means that we can not only ask about the name of a specific thing living on a line/column pair, but also understand all its surroundings. That allows us to make better decisions on what the function should be called and what information to present to the end user.
How Does That Work in Detail?
The short answer is that we are parsing JS files and know what functions they contain and their names. We detect all scopes in the minified file, scan associate a name and then map it back to the original names via the source maps. For the example above this is what this looks like:
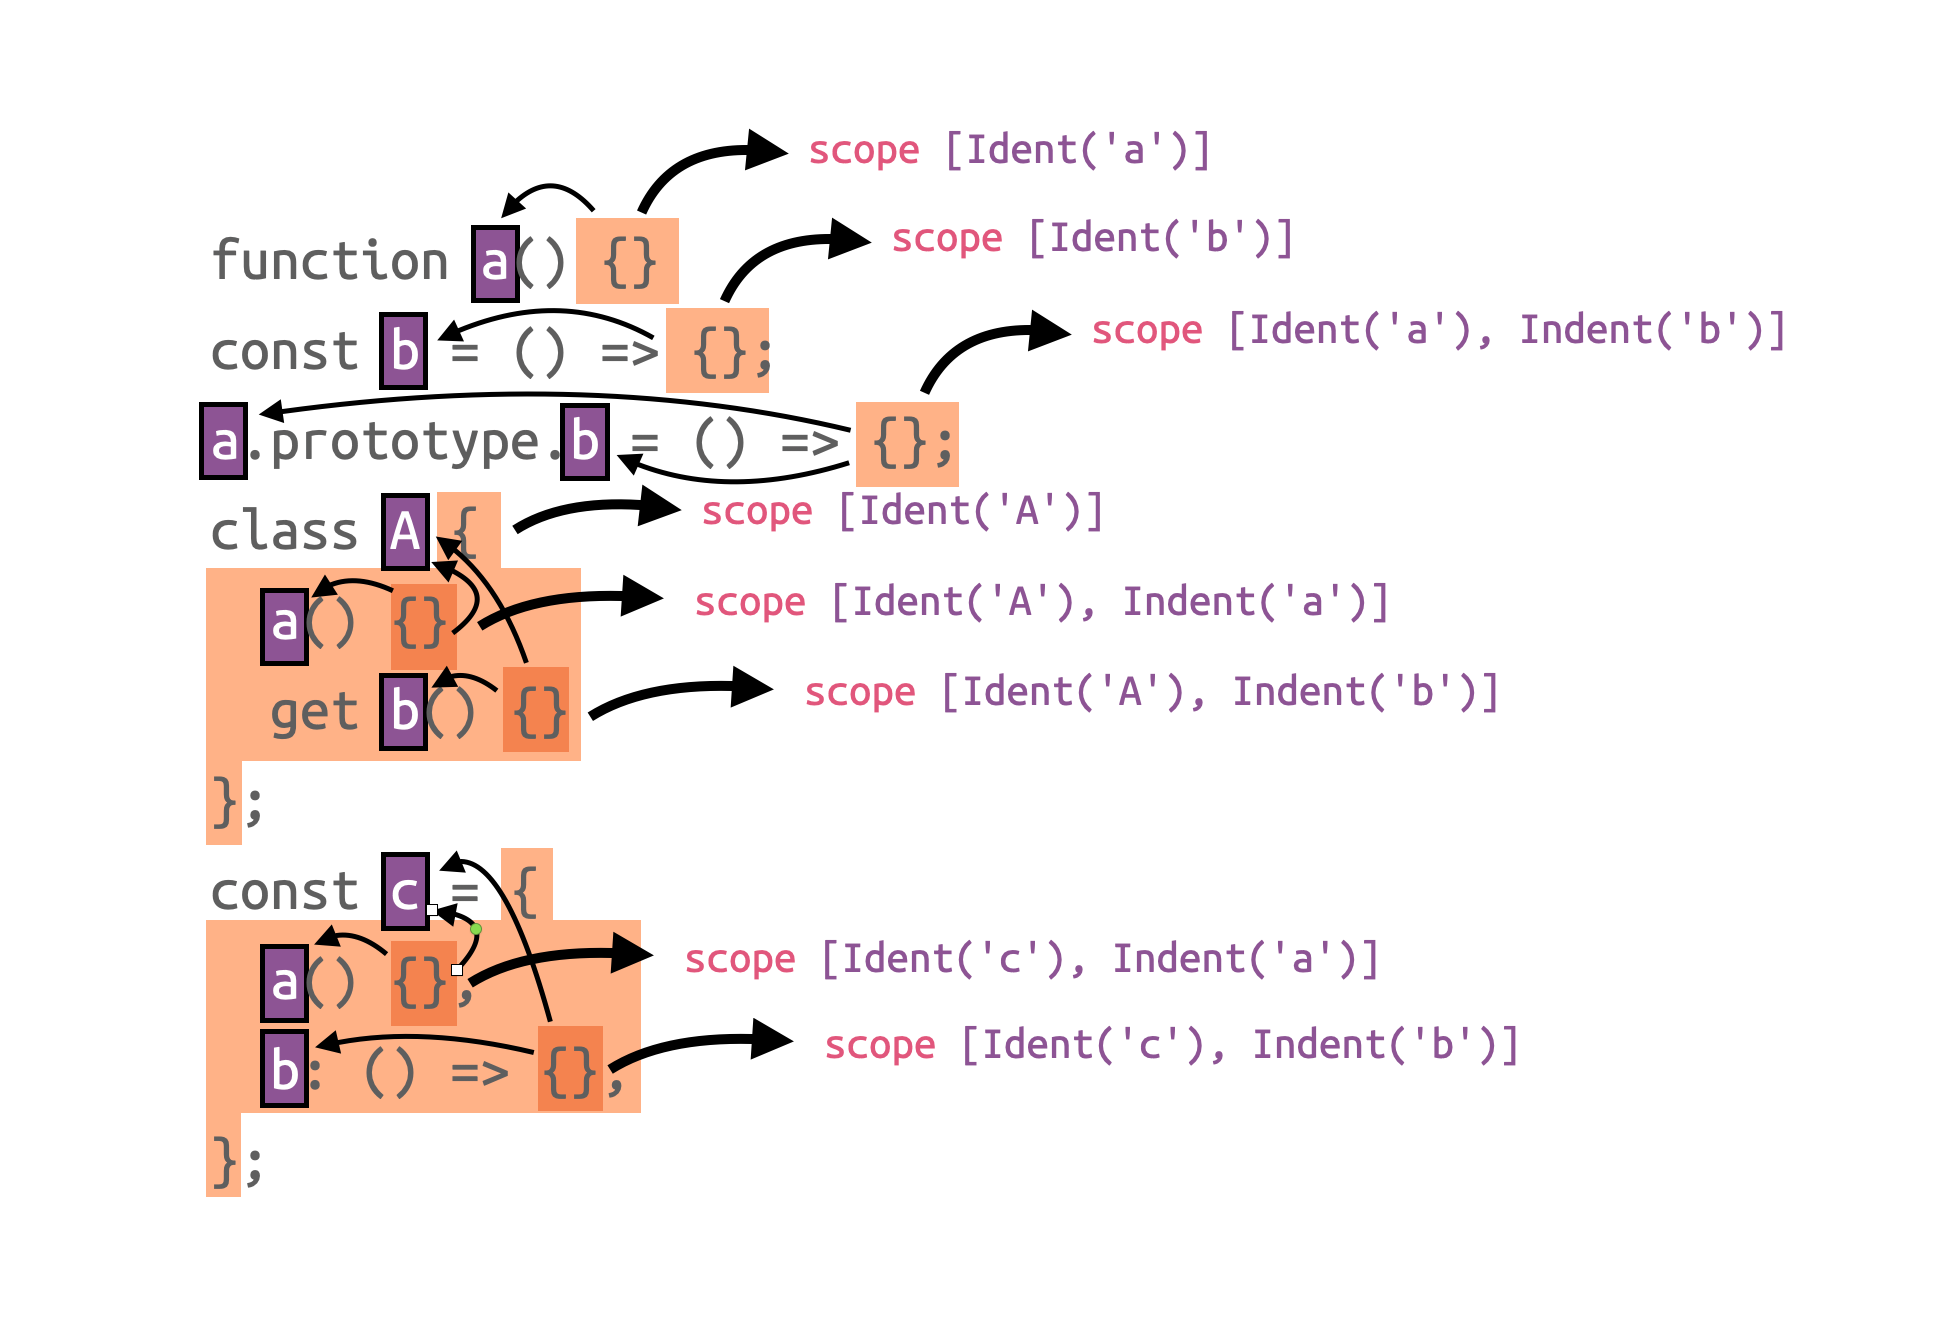
But this gets a lot more complex with multiple scopes. Let's look at a snipped of (minified, but pretty-printed) JS with a couple of functions in it:
function a() {}
const b = () => {};
a.prototype.b = () => {};
class A {
  a() {}
  get b() {}
};
const c = {
  a() {},
  b: () => {},
};
In this example, only the function a has an explicit name. However, we can also infer the names of the other functions from the context in which they are defined. For example, the function in const b = () => {}; does not have an explicit name itself. But it is assigned to a variable named b, so we will use that.
We do similar things if a function is assigned to a.prototype.b, for example. For functions that are members of classes or object expressions, we also consider the name of the “parent”. A similar pattern arises there, as class expressions do not have to have an explicit name either. In which case, we infer that from its context, and so on.
Now that we have collected all the functions and their names from the minified JavaScript source we again can go back and map these tokens to original names.
a.prototype.b can be deconstructed into a and b individually. The same also applies to the name prototype, but we ignore that, for now. For each of these individual components, we do a lookup in the provided source map. And if the source map is properly constructed, we will get a name back. With this, we can map a to MyClass and b to myMethod, or MyClass.prototype.myMethod, putting all the components back together again.
But What if Functions truly Have no Name?
In some contexts, it is not obvious how to name functions. For example, for anonymous callback functions.
doStuff(() => {});Couldn’t we just infer doStuff as the name in this case? Well, it’s not that easy, unfortunately. What if we had a lot more of these?
doMoreStuff(() => {}, () => {}, () => {});Because of these ambiguities, we decided not to infer a name for functions being passed as parameters to other function calls.
However, we do have another trick up our sleeves. When the function itself does not have a name, we can still look at the complete stack trace.
const a = b(() => {});

const result = a();
//             ^ we call the function here
While the function itself does not have a name, we consider the place it is called from. The a() in this case, which is the caller frame.
In this case, we will look up the a in the source map, similar to how we looked up the individual name components above.
And the source map will tell us that the function being called was named setMyState.
This example highlights how this heuristic is a good fit for React Hooks.
Sometimes though, a function may be called as someFn.apply(...). In which case, we would infer apply.
Not great, not terrible.
There can also be situations where neither the function itself, nor the way it is being called, reveals anything about its name. That might be the case for IIFEs (immediately invoked function expressions).
And What Are the Improvements?
So let’s look at some of the improvements in practice. Here is a piece of code (in a class called Activity) that previously, after minification, would produce a completely incorrect function name:
get imageWidth(): number | undefined {
  return this.controller.getCurrentImage()?.width;
}
Sentry in the past would most likely report a completely nonsensical function name here. The reason is that these (either if transpiled / minified to ES6 or ES5) would not match our “search backwards to function declaration” heuristic since it does not really define a function. Also, the fallback to the caller often results in incorrect names because, in this particular case, it’s an attribute access and not a function call on the caller side. With the new changes, Sentry will report get Activity.imageWidth here as function name, which tells you not only the class and property name, but also that it’s a property!
Generally, the ability to see class names in addition to method names makes reading stack traces a much nicer experience. Have a look at the before and after from one of our errors in our own frontend project:

Old Stack Trace: notice the incorrect function apply and missing function name information for the bottom frame.
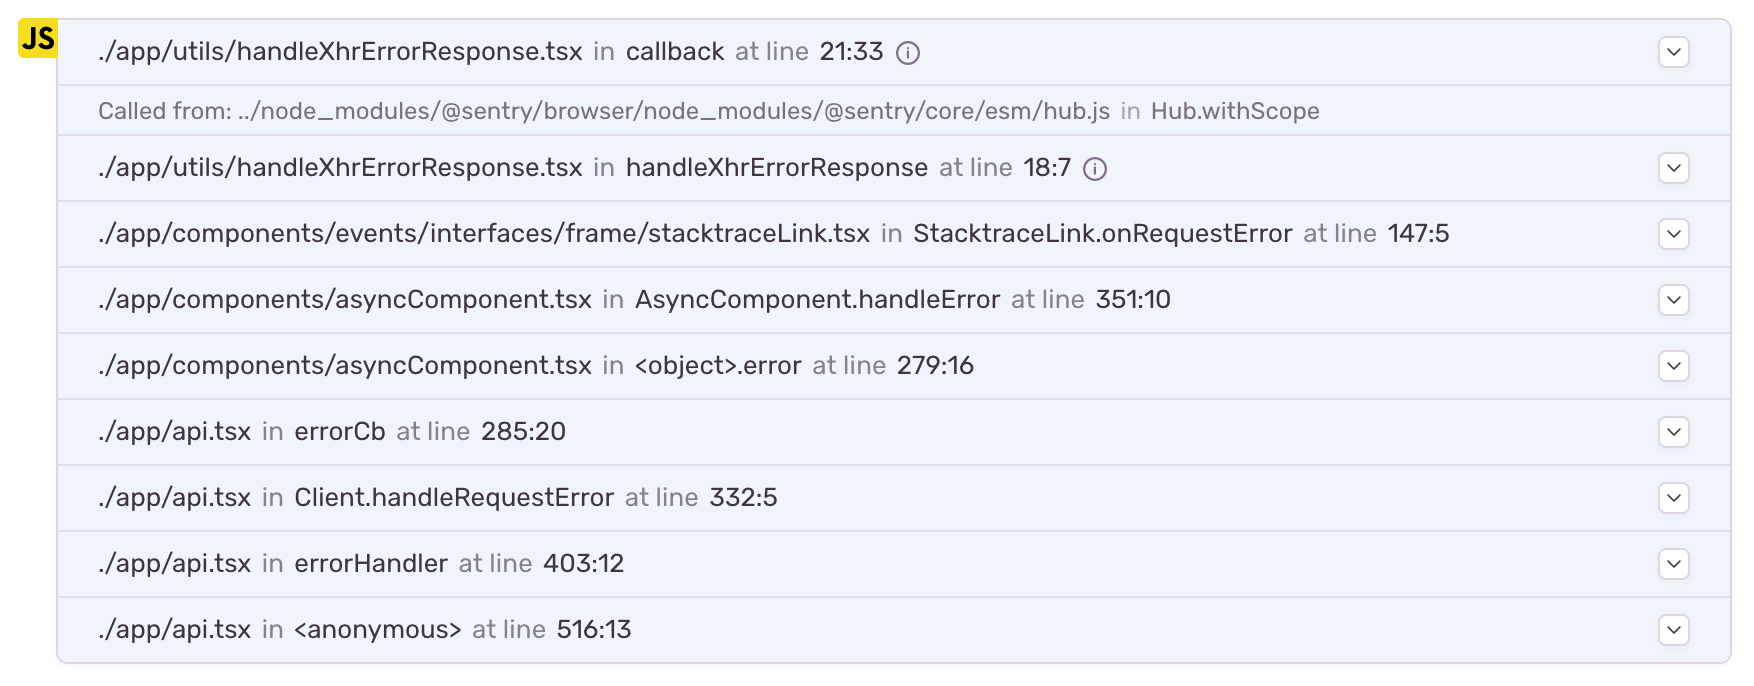
Improved Stack Trace: all methods now also show their method class names and apply now has the correct method name. The anonymous function now also is clearly visible.
Not only did completely incorrect function names such as “apply” disappear, but we can now quickly see the class's name. While in our own code, you could in many cases guess the name of the class, as we try to have only one class per file, it is still much easier to read with the additional contextual information. It also makes it easier to spot standalone functions such as the “errorHandler” or “callback” in this example now that they can be clearly distinguished from methods.
The following stack trace shows this even better. Notice how “apply” turned into “unlisten.current”, and the “_legacyStoreHookUpdate” now tells us that it’s bound to “window”. React components here also show an interesting effect. When callbacks are bound to complex structures, we would end up with things like <object>.children.children.children.onSubmit quickly. As a result, we detect duplicates and render them as {children#3}.
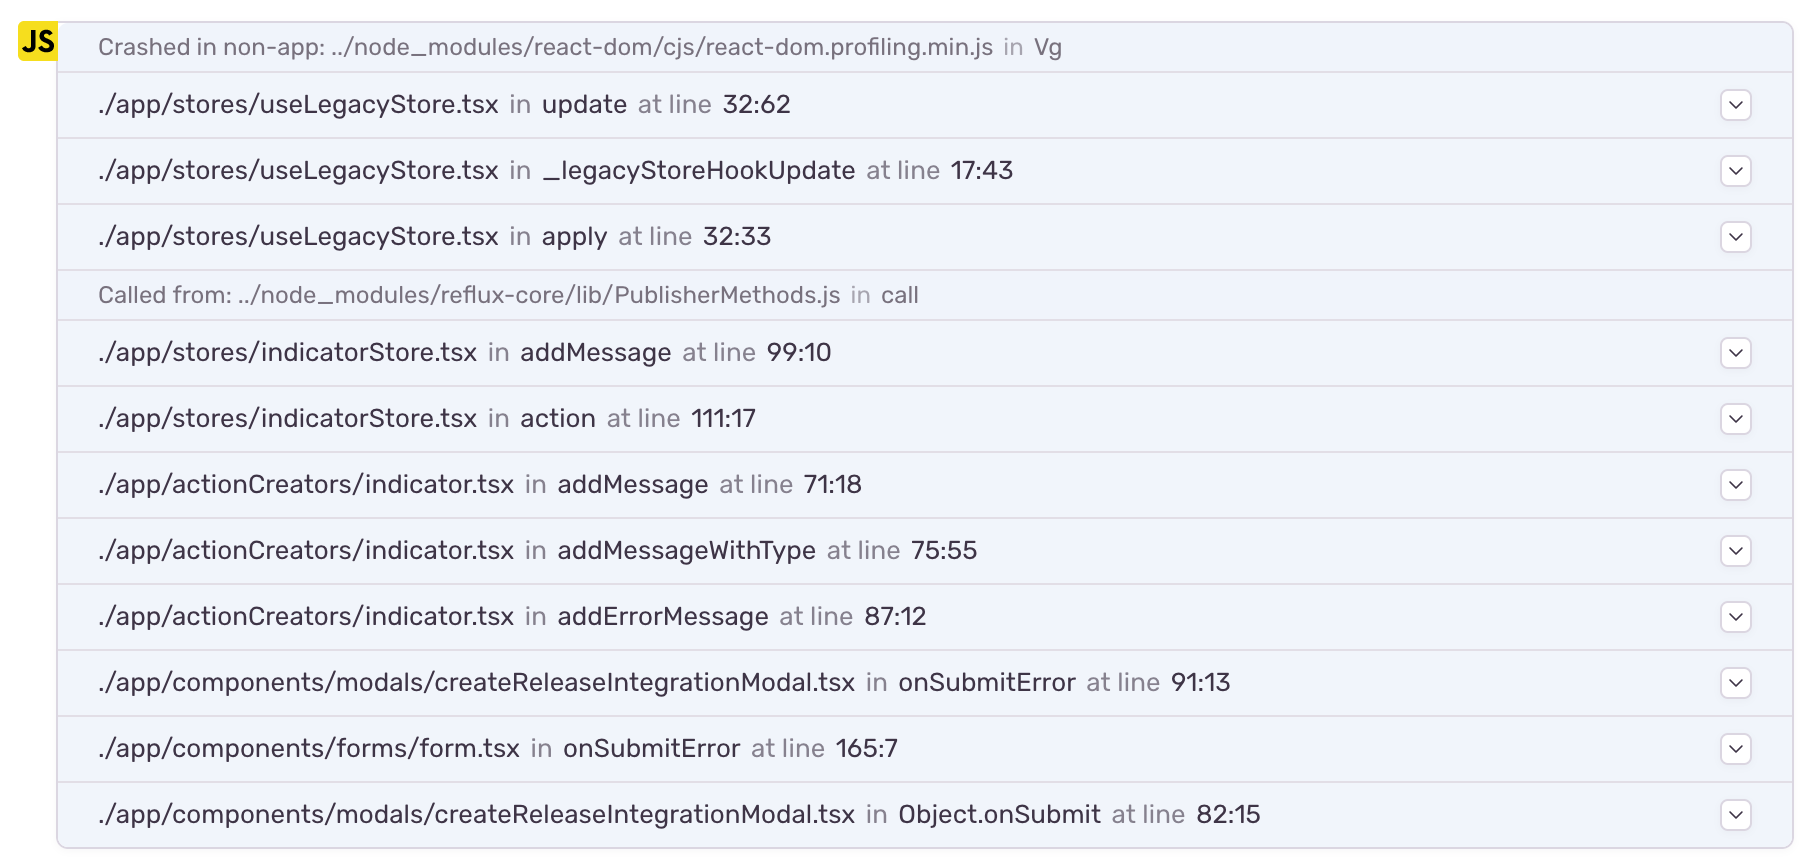
Old Stack Trace: apply and action are incorrect function names.
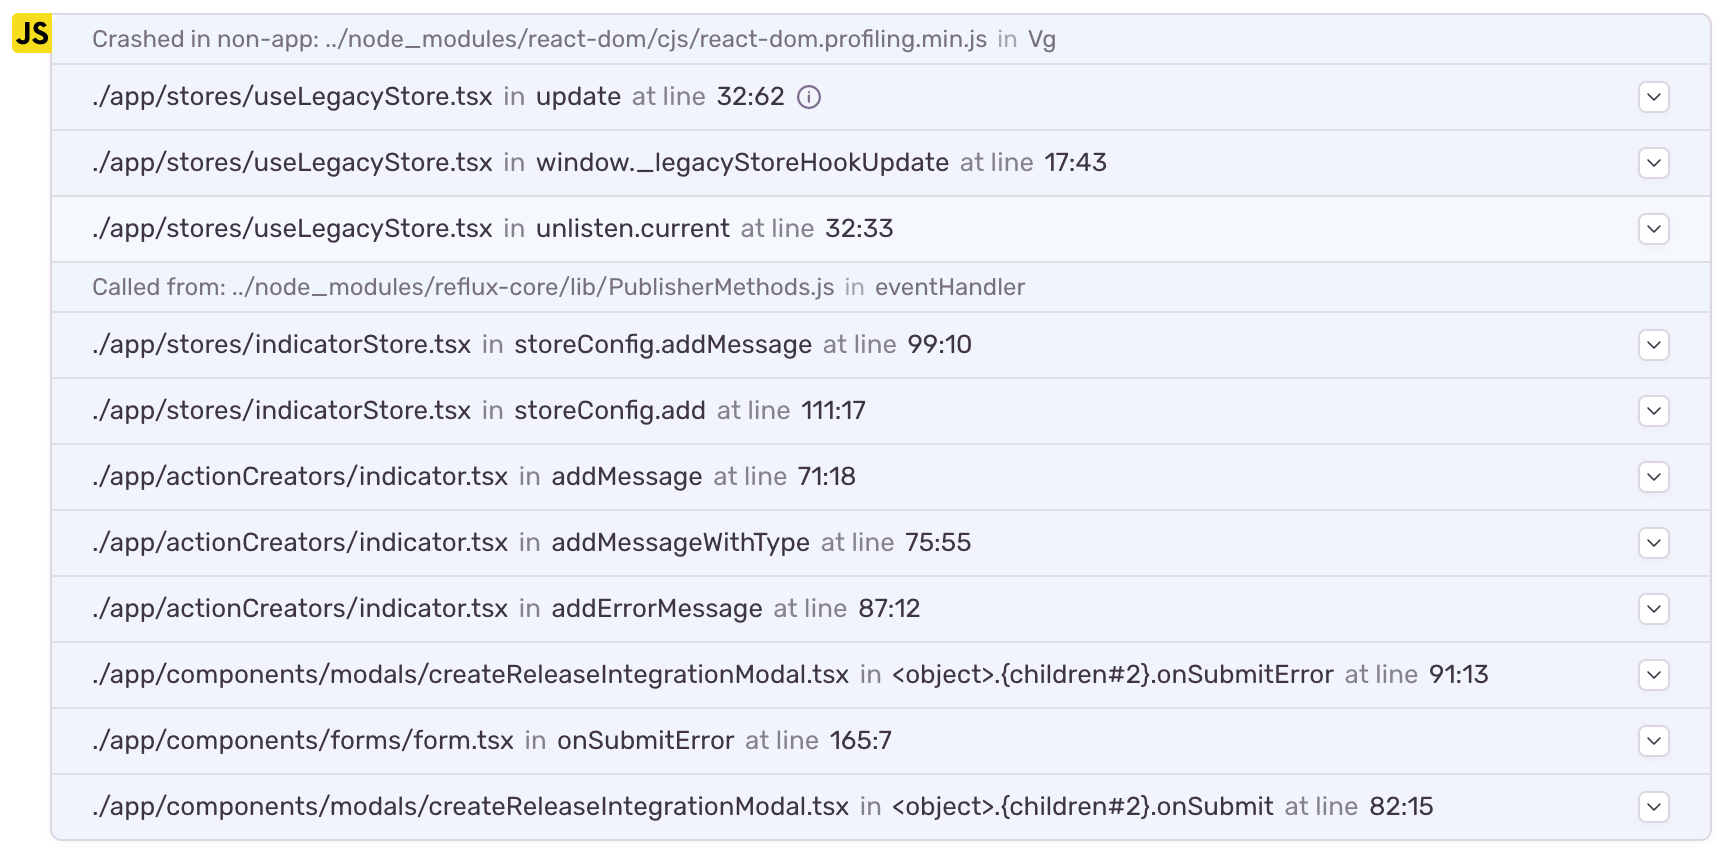
Improved Stack Trace: you can now see unlisten.current and configStore.add as correct method names. As before all methods show their class name and JSX embedded callbacks can now also be easily spotted.
Where To Go From Here
The cost of producing a single SourceMapCache is greater than simply reading a source map file. It is, however, an easily serializable and deserializable format that is highly optimized for fast access. This will allow us to reuse the very same "cache" for an arbitrary number of events, making it a very performant solution.
This is something, however, that ideally a source map would already contain out of the box. We have proposed in the past that, rather than using source maps, we would welcome the JavaScript community to embrace the DWARF standard instead, which has solved many of these issues years ago. In the absence of this, finding a way to encode scope information into source maps would be a welcome change.
Check out our JavaScript debugging hub for tips on resolving future JavaScript issues that come up.


