Introducing Session Replay from Sentry: Bridge the Gap between Code and UX
Introducing Session Replay from Sentry: Bridge the Gap between Code and UX
You know that annoying bug? The one that doesn’t show up locally? And no matter how many times you try to recreate the environment you can’t reproduce it? You’ve gone through the breadcrumbs, read through the stack trace, and are now playing detective to piece together support tickets to make sure it’s real.
To get to the root cause faster - without rolling your head on your keyboard - we built Session Replay, now generally available for all web-based platforms.
Session Replay provides video-like reproductions of user sessions on your web application so you can see exactly what the user experienced leading up to an error or performance issue, helping you triage and resolve difficult-to-reproduce problems faster.
Ready to get started with Session Replay? A base allotment of replays are included in every Sentry plan and additional replays start at $29 USD/month for 10k replays - check out our pricing page for details.
Going beyond breadcrumbs and the stack trace
With Sentry Error Monitoring, Sentry records exception data and surfaces context to help developers troubleshoot issues – including breadcrumbs, stack traces, and broken lines of code – but there are some types of problems that are still hard to understand and reproduce. By being able to visualize the user journey with Session Replay, you can bridge the gap between code and user experience to understand how issues manifest in the UI. We also added additional debugging context such as DOM events, network data, console logs, and breadcrumbs to the Replay product so you have everything you need to troubleshoot even the most frustrating bugs and performance issues.
Record the data that matters
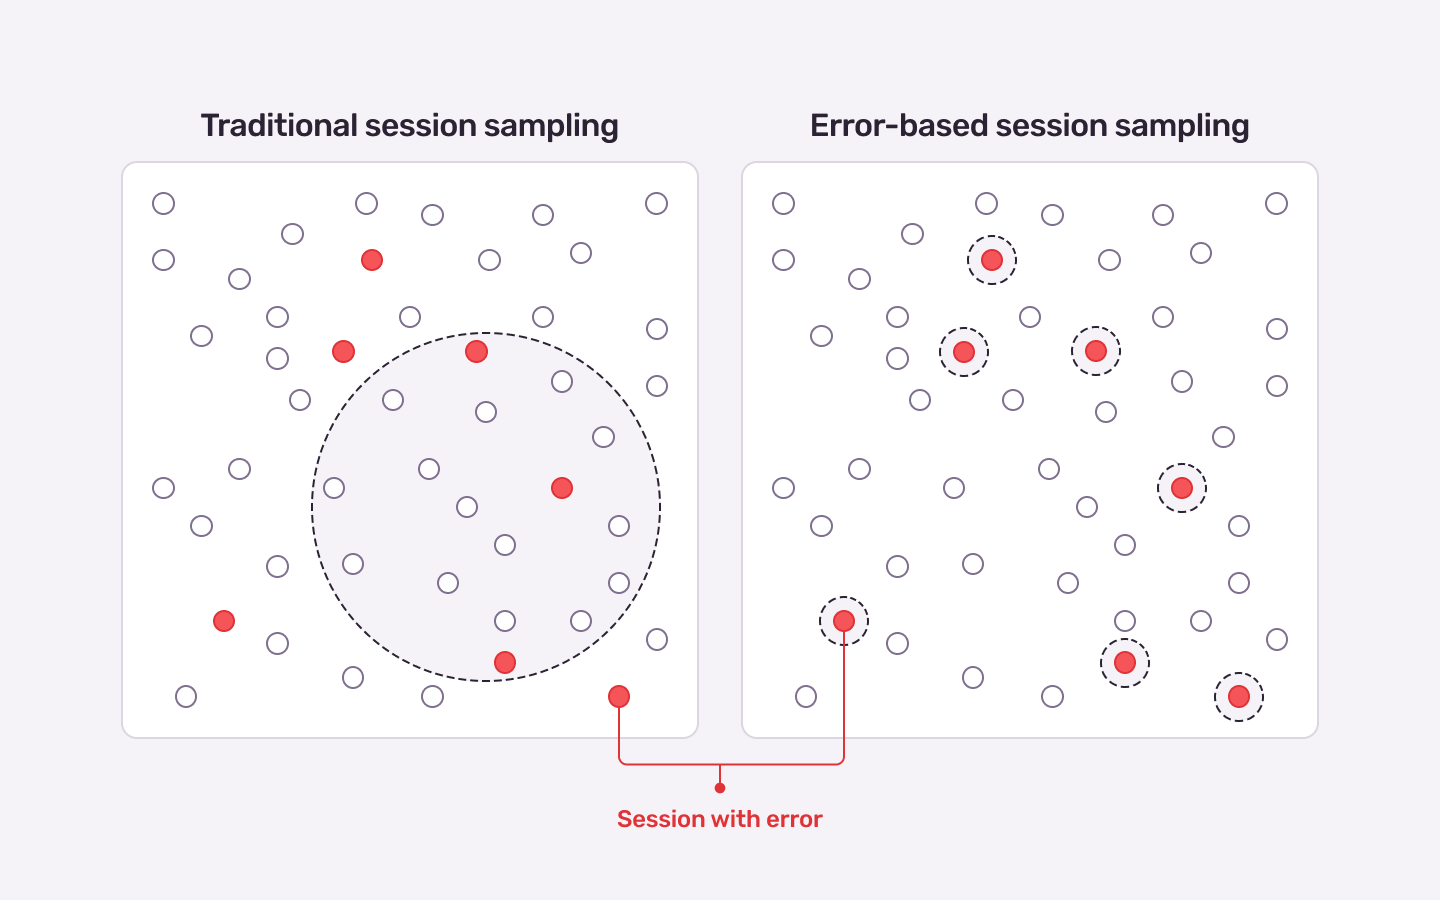
Most session replay products work by recording a percentage of random user sessions interacting with your product. This makes sense when you’re interested in understanding user analytics or product funnels, but not so much if you’re primarily focused on debugging software problems. It could mean having to record 1,000s of random sessions before you get to a replay that exemplifies that tricky problem you’ve been trying to recreate. This hurts both your time and your wallet.
Session Replay from Sentry works differently. We offer the option to sample generically, but we also provide the option to prioritize sampling sessions when your users encounter errors. This means when a tricky bug happens, we have the matching replay ready to go, conveniently linked to the matching Sentry issue on the issues details page. You’ll spend less time waiting for the data you need, and less anxiety monitoring your event quota. For more information on sampling and customizations, check out our docs.
Because Session Replay allows me to zero in on replays corresponding to errors, I can quickly see the issue, review the replay, and solve it in 15 minutes - whereas before, the same issue might have taken me a day to resolve.
Software Engineer, Resistbot
Our privacy-first approach
Session replay products have a challenging problem: they have to strike the right balance of providing valuable debugging context without accidentally revealing sensitive user data in the recorded HTML. Strip too much and it’s hard to decipher how exactly the user triggered that tricky bug. Strip too little and you risk sensitive data leaving the user’s browser.
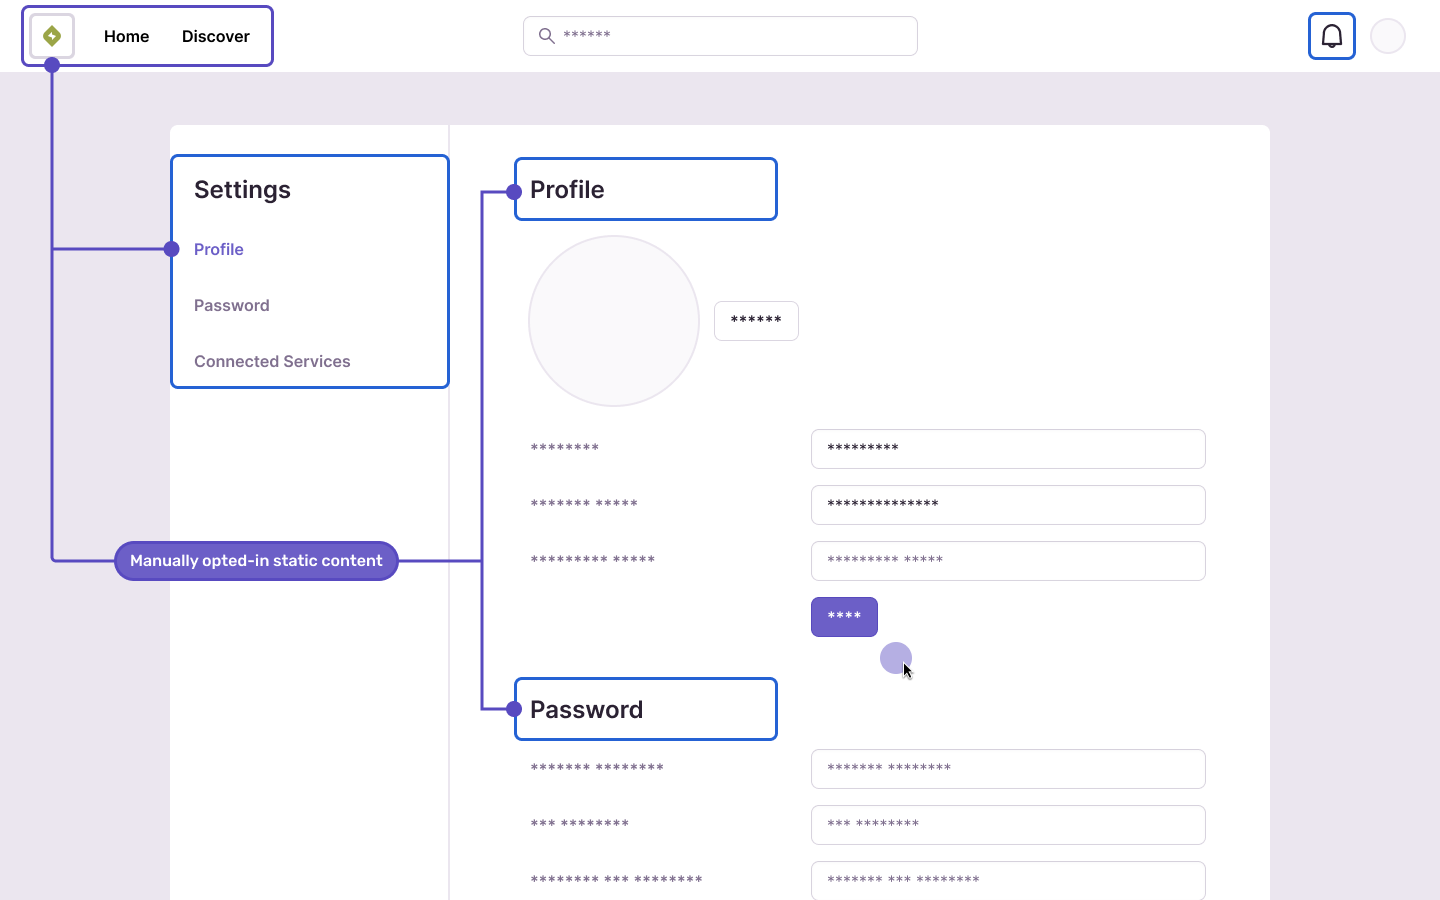
Sentry’s Session Replay biases in favor of user privacy by treating content as default unsafe. Out-of-the-box we mask all HTML text, image content, and user input before it leaves the user’s browser, and instead ask developers to opt-in any known safe HTML content you want during playback (like static navigation and header links). The tradeoff is slightly lower recording fidelity – more content will be masked – but stronger confidence that only known, safe content leaves the user’s browser.
As an additional layer of defense, Session Replay applies the same project-level privacy settings as our other products, including PII scrubbing and IP redacting, which removes sensitive content at our edge ingestion service before data is stored. With strong out-of-the-box privacy protections in place, we’re helping you augment the debugging experience while preserving user trust.
As a healthcare company, handling PII/PHI properly is really important to us and our members - Sentry made it really easy to avoid exposing this sensitive data in Replays
Dave Cridland, Staff Engineer, Peppy
Reproduce and resolve faster: How Replay helps with troubleshooting errors
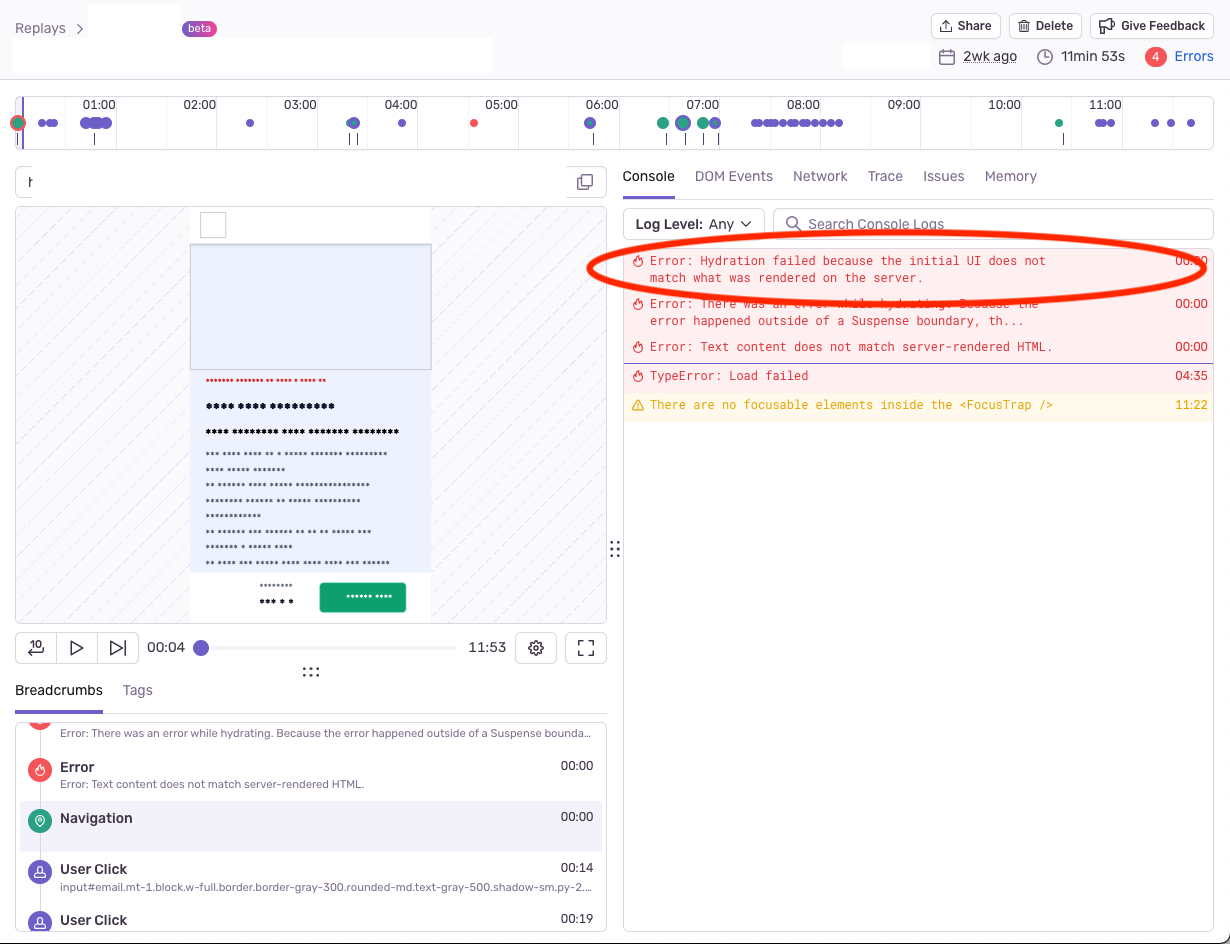
To highlight how Session Replay assists developers in practice, let’s look at one class of errors that are challenging to troubleshoot: hydration errors. This class of problem is common to hybrid-rendering frameworks like Next.js, and occurs when server generated HTML does not match what the JavaScript on the client-side is expecting. This can result in mismatched content in the UI, and necessitates otherwise-unnecessary content refetches and re-renders.
When Laszlo from lablab.ai encountered a hydration error on his Next.js project, he initially found it difficult to debug as there were hundreds of components on the page where the server generated HTML didn't match the client HTML, and it was hard to understand the user impact of the issue. This is where Session Replay came in. By watching a single replay, Laszlo could see that the user was erroneously faced with a duplicate image on the screen as the hydration error was being surfaced in the console log and breadcrumbs of the replay.
Session Replay has been instrumental in helping us resolve these types of hydration errors. With Replay, we can visually see the jankiness of the page and pinpoint which components were impacted, saving us hours of manual debugging.
Laszlo Gaal, lablab.ai
Fix slow faster: How Replay helps to resolve performance-related problems
Latency is the new outage - slow transition states, infinite spinners, and janky experiences don’t build trust with your end-user. But it’s not easy to maintain a performant app, especially when the performance-related issue can be difficult to reproduce and troubleshoot.
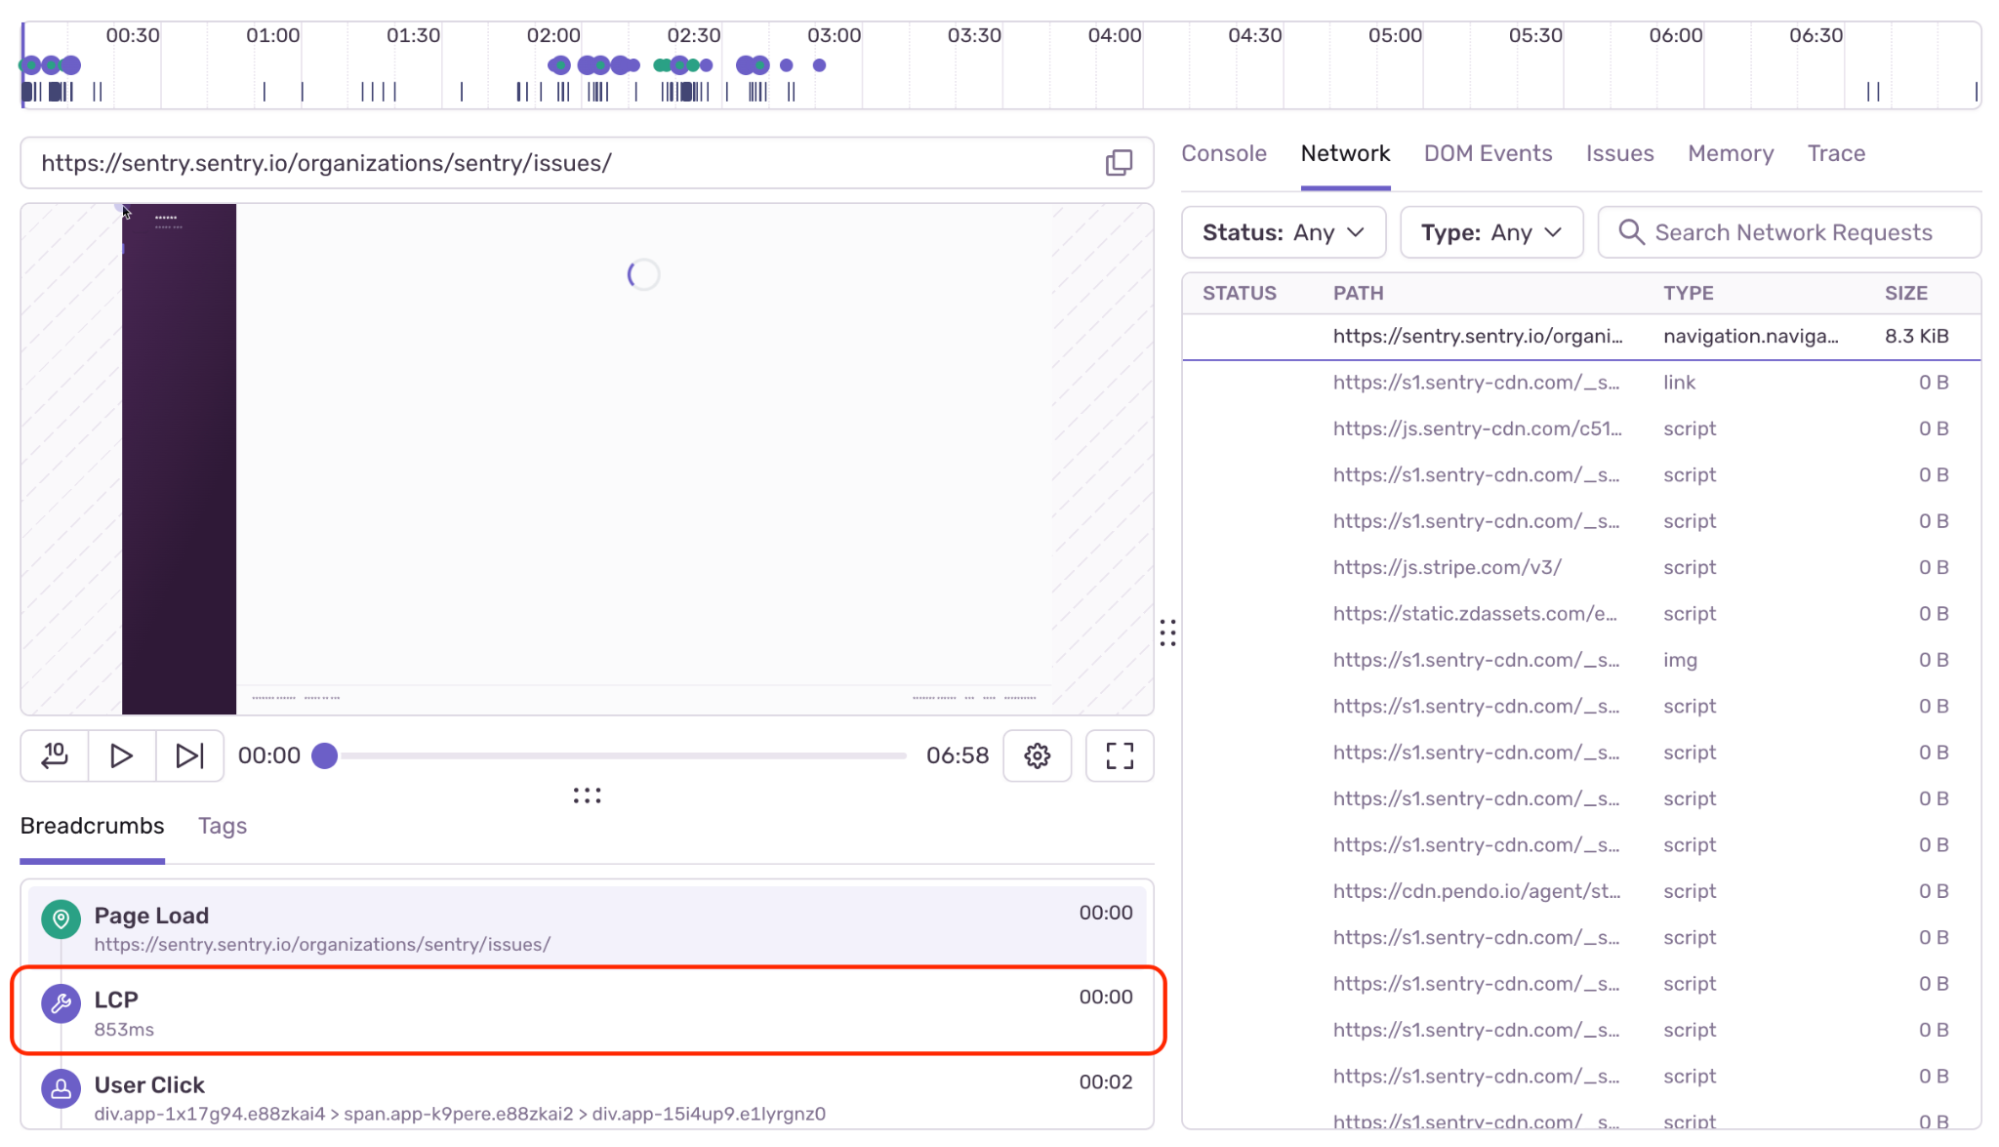
A common performance-related issue is poor Largest Content Paint (LCP), a major contributor to a site’s page load speed. Typically, when a developer sees a front-end transaction event with a poor LCP, it is unclear what the LCP element is on the transaction, and reproducing it in their local environment takes time and guesswork. With Session Replay, a developer can see the slowdown visually in the replay, with the specific LCP element highlighted, so they can immediately identify the poorly performing LCP element in order to resolve the performance issue.
Issue triage: Using Session Replay to confirm user impact
While Sentry makes it easier to triage issues with features like code owners and the “For Review” tab, it can still be a very manual process. When faced with an overwhelming number of errors (we’ve all been there), engineering teams need a quick way to assess the severity of each error and prioritize accordingly.
At SaRA Health, founder & CEO Steven often takes on the responsibility of triaging issues for his nimble team of five. Through watching replays that are embedded on the issue details page of each error surfaced by Sentry, Steven is able to better understand how each error impacts the user experience, and how critical it is for that issue to be resolved.
Session Replay helps me quickly see how an error impacts the customer experience and prioritize it based on severity. As a small team, we need to move fast. With Session Replay, I can triage effectively and more confidently allocate engineering resources - saving us time, the user experience, and ultimately money. Anyone who’s business model is tied to users being able to seamlessly use the UI is definitely going to need Session Replay.
Steven Coen, SaRA Health
Session Replay can be an incredibly useful tool for triaging and root causing those difficult-to-reproduce error and transaction issues. Now available for all web-based platforms, you can begin to capture replays in just a few minutes. If you’re ready to get started, make sure you are on the latest Sentry plan, review the pricing page to determine how many replays you’ll need, then head to your subscription settings to adjust your replay quota. There will also be a base allotment of replay events included in the Developer, Team, and Business plans.
Want to learn more first? Check out our website and this demo. You can also drop us a line on GitHub, Twitter, or Discord. And if you’re new to Sentry, you can try it for free today or request a demo to get started.


