Investigating an ‘[Object] not found’ error in Next.js with Tracing in Sentry

David Y. -
![Investigating an ‘[Object] not found’ error in Next.js with Tracing in Sentry](https://images.ctfassets.net/em6l9zw4tzag/2kz01q4FsyexWVMcIdkrDx/6160bf248d05de8931cc81f5bcedbd03/0824_DTSD-961-tracing-robot-bug-hero.jpg?w=2520&h=945&fl=progressive&q=50&fm=jpg)
Breakpoints and console.log statements might save your sanity during local dev, but production issues are another story. In prod, your errors might be distributed across different microservices, or hidden in minified code. Good luck hunting those down.
That’s where Sentry’s traces and spans come in, offering you easy visibility into every network request, API call, DB fetch and more in a full-stack, distributed environment.
Sentry’s distributed tracing gives you clear, actionable visibility into. every network request, API call, or database query as they flow through your Next.js app. Rather than playing guesswork, you get a direct map of exactly where performance bottlenecks or complex failures occur.
With distributed tracing, you can quickly isolate the root cause of an error—maybe a missing record in the database, or an endpoint sending an unexpected payload—and see precisely how that error impacts the overall user experience. Even better, you can debug production traffic without rummaging through other people’s code or waiting on repository permissions. The moment Sentry flags a new error or you see an unexpected spike in Insights, you’re able to hone in on the specific trace ID, pinpoint each request made, and figure out exactly where the call stack started to fall apart.
Distributed tracing makes it easy to debug even when:
You don’t have R/W access to the source code
Deploying additional debug code isn’t an option
Error messages are vague or unclear
Multiple microservices obscure the exact origin of the issue
In this guide, we’ll show you how to leverage Sentry’s tracing capabilities to debug production issues effectively without needing to look at your source code.
We’ve prepared an example course management app , which you can set up and follow along with on your machine.
Set Up the Example Application
Our course management application is written in TypeScript and uses Next.js for its React framework, tRPC for type safety, and PostgreSQL for data persistence. It’s available on GitHub.
To follow along with this guide:
Create a new Next.js project on Sentry and take note of its data source name (DSN). You can find this in the project settings.
Ensure you have Node.js, npm, and PostgreSQL installed on the system you’ll use to run the application.
Finally, download, build, and run the course management application:
Clone the GitHub repository:
Click to Copygit clone https://github.com/getsentry/courses-app-sentry-nextjs courses-app cd courses-appInstall the dependencies:
Click to Copynpm config set legacy-peer-deps true npm installCopy
env.exampleto.envto configure the environment variables.Update the following variables:
-DATABASE_URL: Your PostgreSQL connection string (the default should work fine).
-NEXTAUTH_SECRET: A random string for NextAuth.js
-NEXTAUTH_URL: Your application URL (http://localhost:3000 for development).
-NEXT_PUBLIC_SENTRY_DSN: The DSN for the Sentry project you created earlier.Create the database, set its schema, and import the sample data:
Click to Copycreatedb courses_db npx prisma migrate dev npx prisma db seedBuild the application:
Click to Copynpm run buildRun the built application:
Click to Copynpm run start
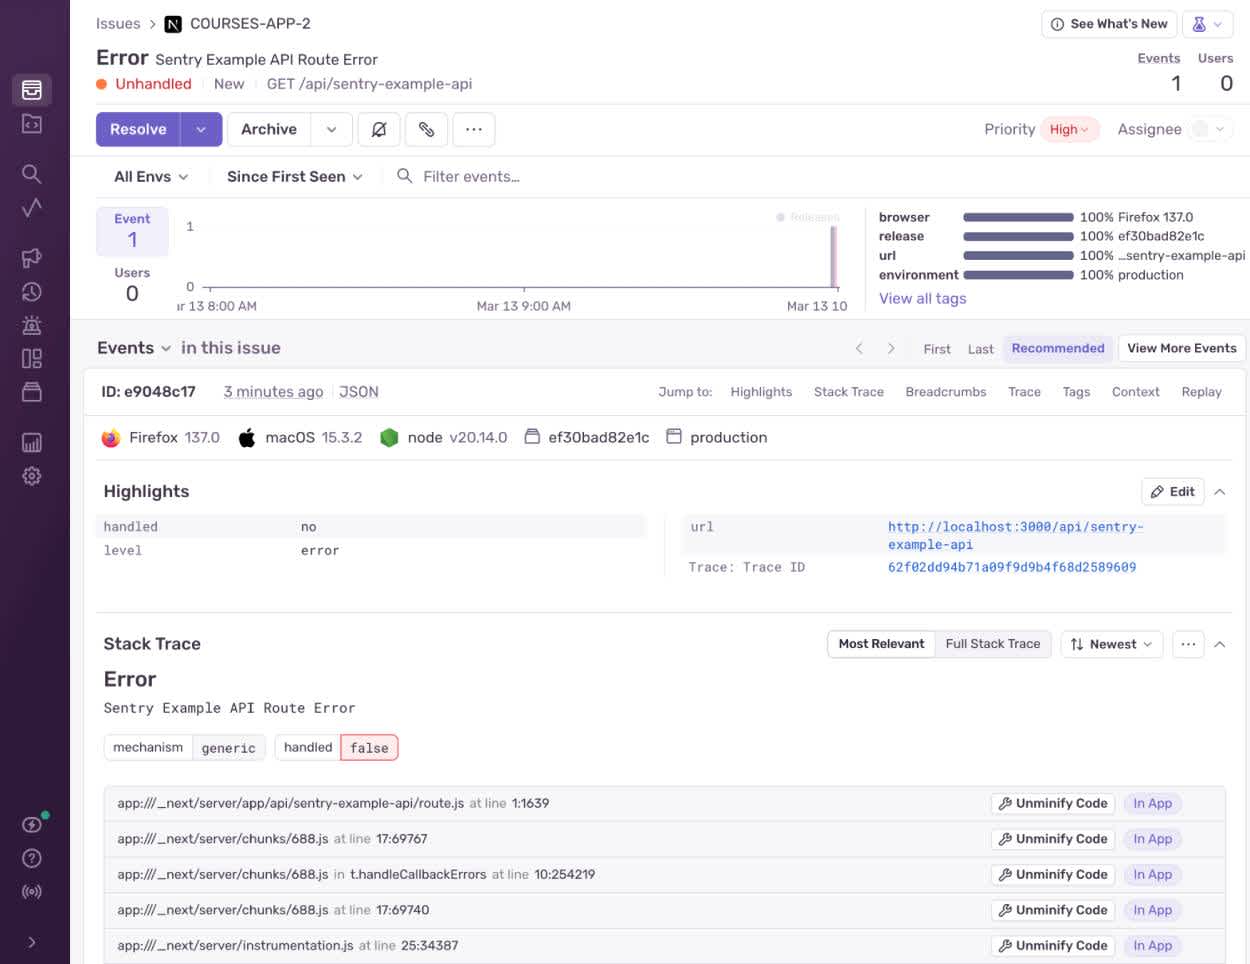
You can test whether your Sentry project is set up correctly by visiting http://localhost:3000/sentry-example-page and clicking the button to trigger an error. If everything is working, you should quickly see a new issue (resembling the image below) on your project homepage. If not, wait a few seconds and refresh.
Sentry example error
Reproduce the Error
Once the application is running, it’s time to reproduce the error so that it is displayed on the Sentry issues stream or project homepage.
You can achieve this by doing the following:
Visit
http://localhost:3000. You’ll be redirected to a sign-in page.Sign in as one of the example users:
- Email:alice@example.com
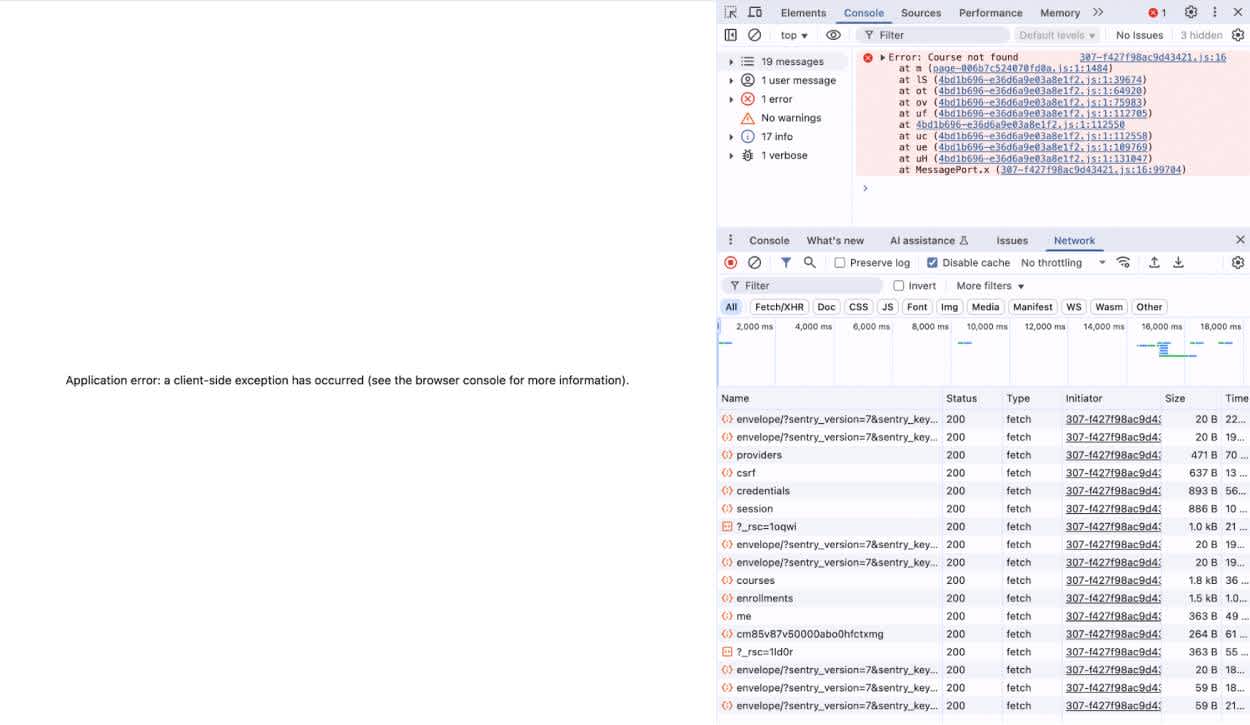
- Password:password123Then, open the browser Console. You should see an error notice resembling the following:
Application error
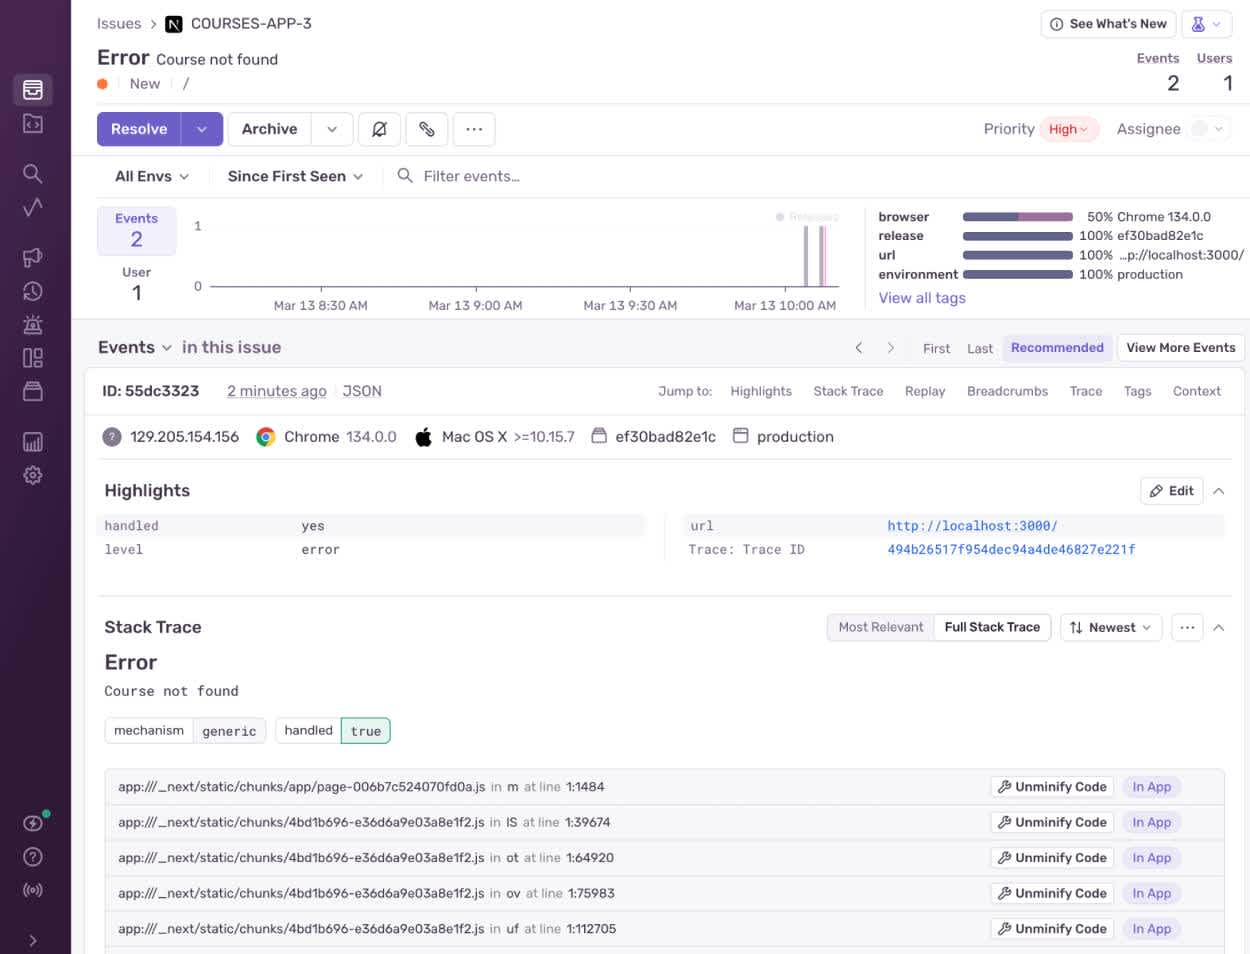
Navigate to your Sentry Issues page, where the issue (a collection of similar issues and relevant events) should soon appear. When you open the issue, it will look something like this:
Issue in Sentry
Investigate the Error
So far, we don’t have much to go on. We know that the homepage is failing to render because one of the courses it’s trying to load can’t be found, but the error doesn’t tell us any more than that. If we were running the application in development mode, we could consult a stack trace, but this error occurred in production, with minified code that we don’t really want to wade into.
Luckily, Sentry provides us with the Trace View page, which allows us to see the request flow that triggered the error.
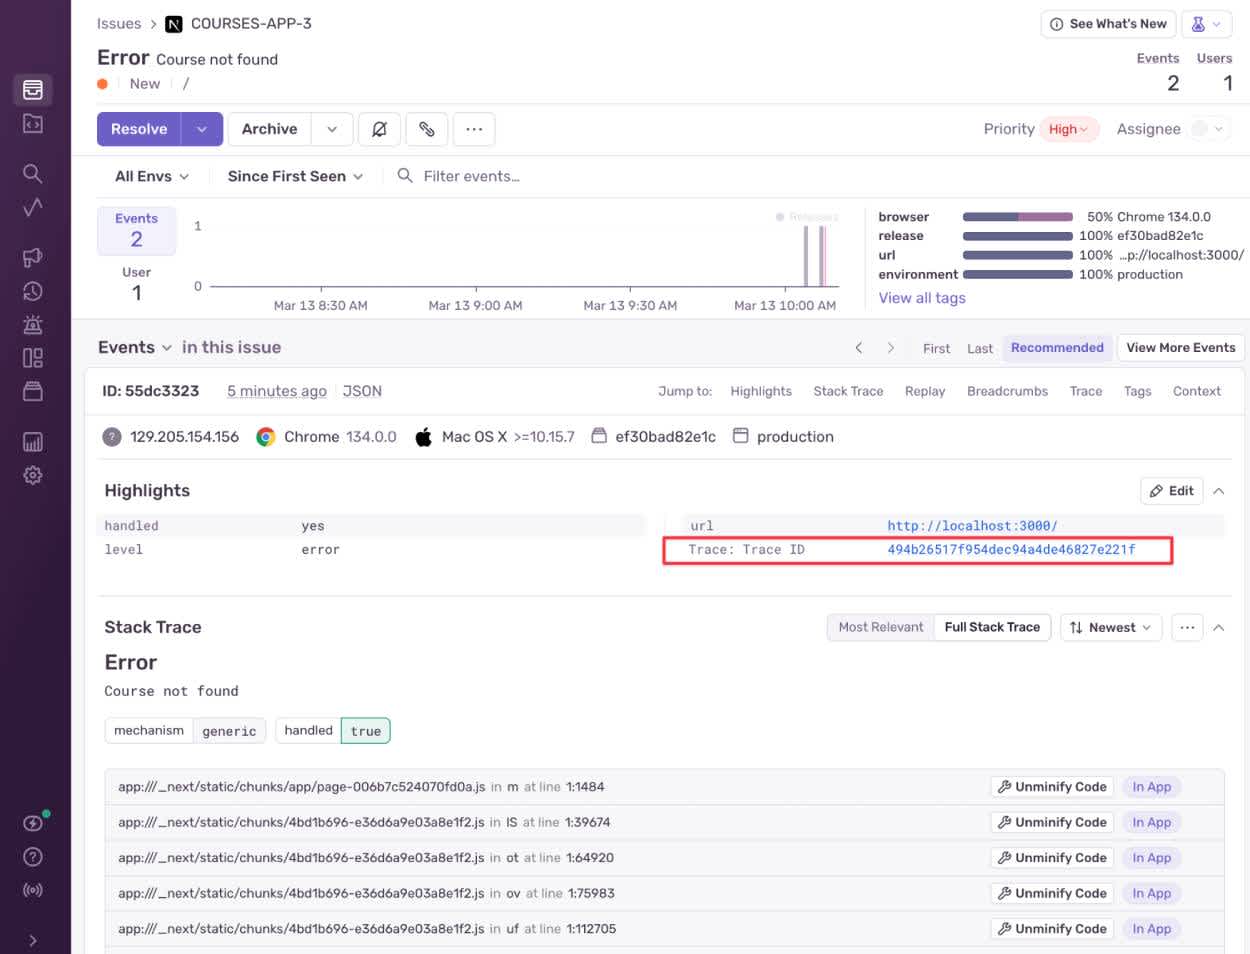
Under the Events section of the issue, find the Trace ID link, which is highlighted below:
Trace ID
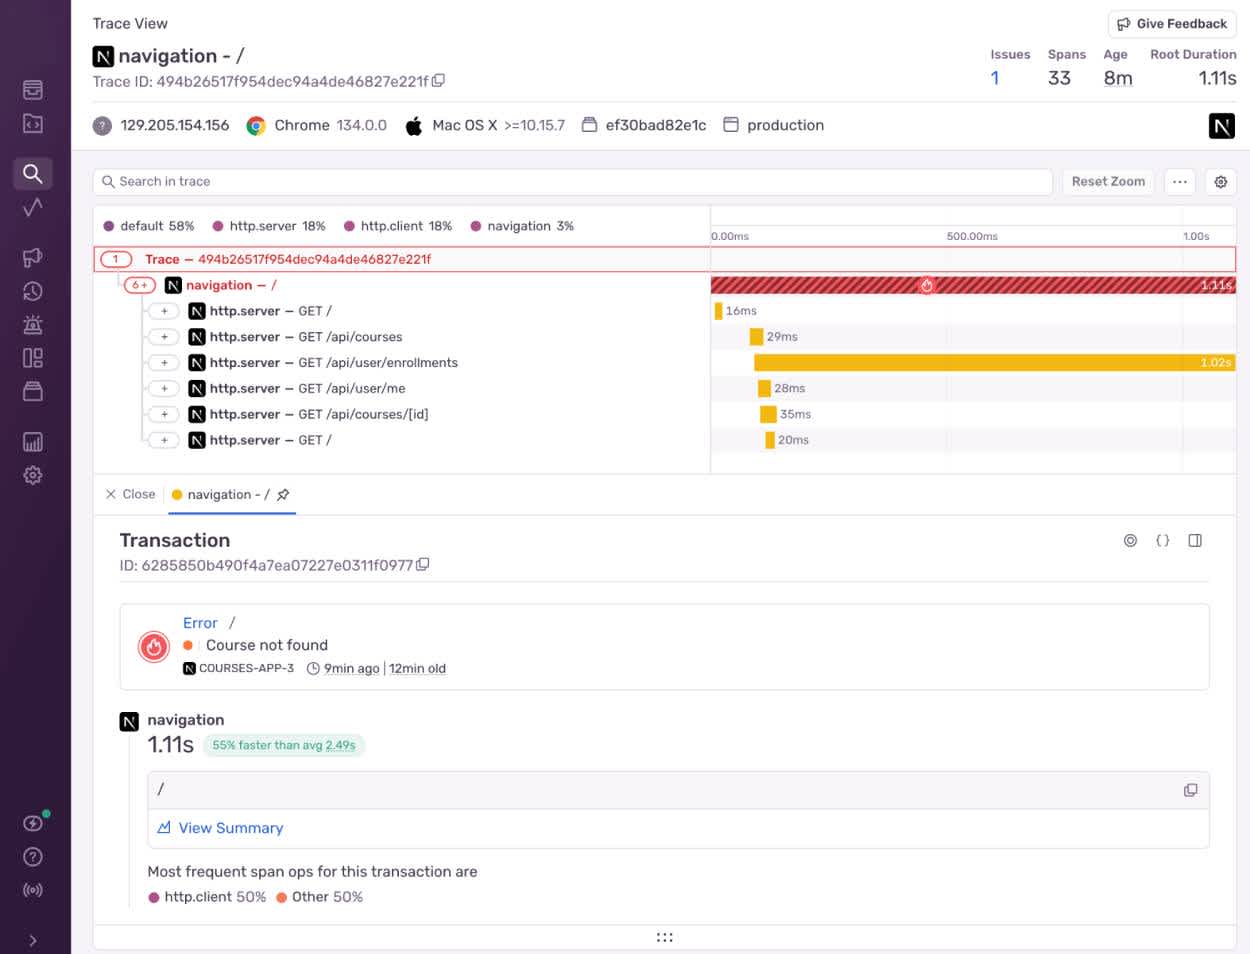
Click on the Trace ID link to open the Trace View page, which should look like this:
Trace view
The Trace View displays the initial page load that triggered the error, along with each of the requests that this page made. In our example, we can see that our attempt to load the homepage involved calls to the following API endpoints:
/api/courses: The endpoint for fetching courses./api/user/enrollments: The endpoint for fetching the logged-in user’s course enrollments./api/user/me: The endpoint for fetching the logged-in user’s details./api/courses/[id]: The endpoint for fetching a single course by ID.
Based on the error message and the above information, we can infer that a request to either the /api/courses or /api/courses/[id] endpoint was responsible for the error. Because the Course not found error message references a single unfound course, we’ll investigate /api/courses/[id].
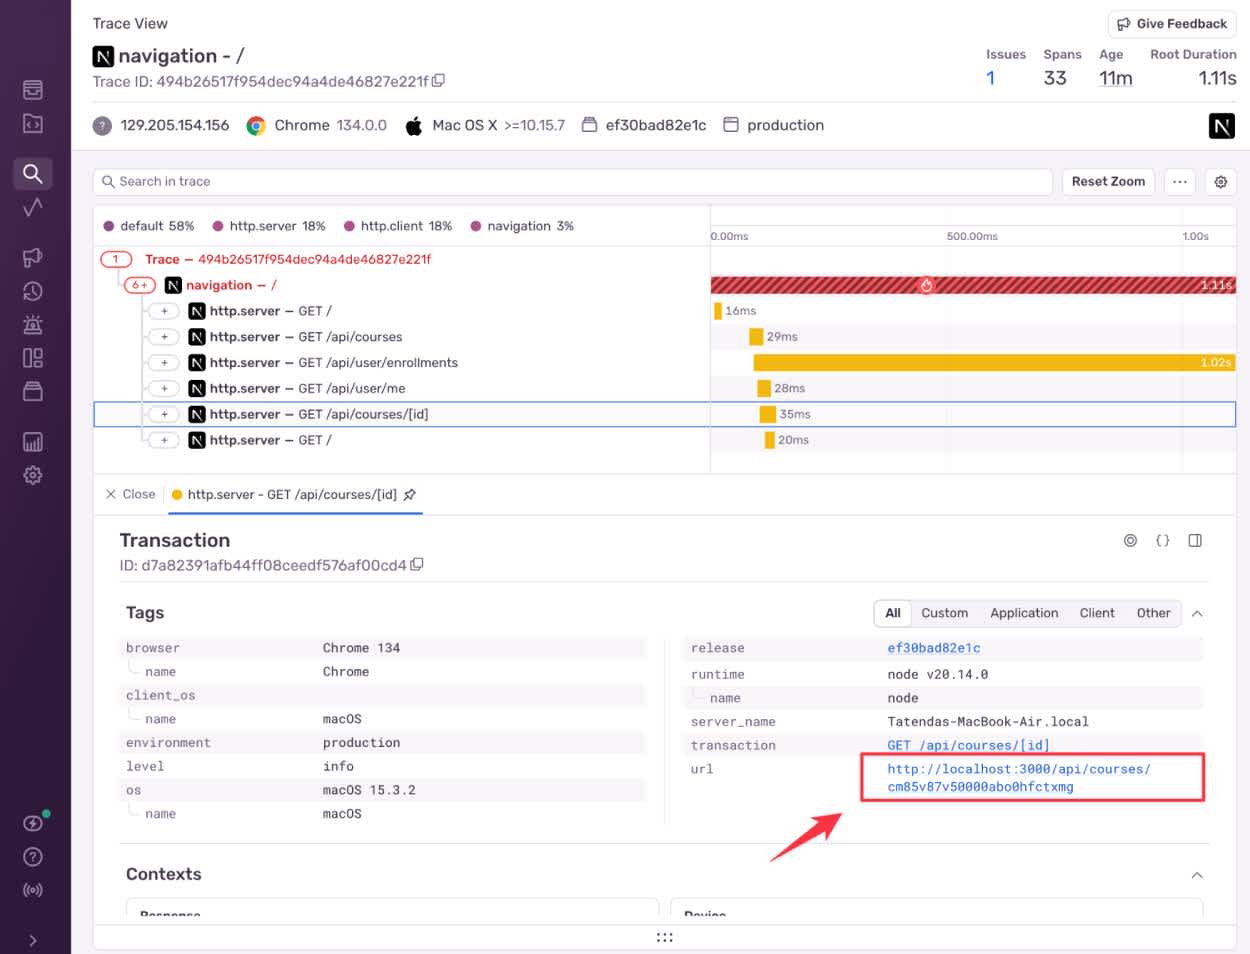
Click on the endpoint to see the request made to it, complete with a course ID:
Course ID
Let’s look up that course ID in the database using the PostgreSQL command-line client, psql.
Open a new terminal and execute the following command:
psql courses_db
You should see the following output:
psql (17.2)
Type "help" for help.

courses_db=#
At the courses_db=# prompt, use the following command to list existing tables:
\dt
You should see the following output:
               List of relations
 Schema |        Name        | Type  |  Owner
--------+--------------------+-------+----------
 public | Course             | table | postgres
 public | CourseEnrollment   | table | postgres
 public | Syllabus           | table | postgres
 public | User               | table | postgres
 public | _prisma_migrations | table | postgres
Now, check whether the course with ID cm85v87v50000abo0hfctxmg is present in the Course table by running the following SQL command:
SELECT * FROM "Course" WHERE id = 'cm85v87v50000abo0hfctxmg';
You should see the following output:
 id | title | description | duration | instructorId | createdAt | updatedAt
----+-------+-------------+----------+--------------+-----------+-----------
(0 rows)
This confirms that there is no course with the ID cm85v87v50000abo0hfctxmg in the database.
Without even looking at the code, we’ve used Sentry’s Trace View and a few database queries to identify that our error was caused by the application attempting to fetch a nonexistent course.
Fix the Error
To fix the error, let’s take a look at the code for our homepage view in src/app/page.tsx file.
Locate the try block that starts on line 25:
try {
  const [coursesData, enrollmentsData, userData, featuredCourseData] = await Promise.all([
    api.getAllCourses(),
    api.getUserEnrollments(),
    api.getCurrentUser(),
    api.getCourse("cm85v87v50000abo0hfctxmg")
  ]);
Here, you can find the offending line of code, which starts with api.getCourse and tries to load a course with a hard-coded ID.
Then, in the if block on lines 72-74, you can locate the code that produces the error:
if (!featuredCourse) {
    throw new Error('Course not found');
}
How we fix this issue depends on our needs for the application:
If we don’t need the featured course functionality, we can remove it from the homepage entirely.
If we decide to keep the functionality, we can make it fail more gracefully by removing or handling the error case. Alternatively, we can develop a more robust in-app mechanism for setting and getting the featured course, rather than hard-coding a database ID in the frontend code.
Configure Sentry Tracing to Find Errors in Next.js Applications
In this example, the Sentry Trace View was key to tracking down the bug. We could access the Trace View page because we used the Sentry installation wizard (npx @sentry/wizard@latest -i nextjs) to set up the Sentry integration for our application and configured it with tracing enabled. We also disabled Turbopack to allow Sentry to operate on the application frontend.
Tracing is also a powerful tool for performance profiling and monitoring, as individual requests are timed. To demonstrate this, we included an artificial delay in one of the course management application’s API calls. The delay is clearly visible on the Trace View page:
Trace view
Tracing and other advanced features such as Session Replay require applications to send more data to Sentry, which can impact performance and bandwidth usage. As such, you should configure your sample rates in line with your application load and organizational capacity.
What else can you do with Sentry tracing?
In this guide, we showed you a realistic but still fairly small and self-contained example to demonstrate the basics of debugging a vague Next.js issue with Sentry tracing.
But distributed tracing with Sentry goes beyond finding the single line of misbehaving code. It gives you deep visibility into how errors ripple through your entire app - whether you’re wrangling multiple APIs, async requests, or complicated database logic. You won’t have to waste time comparing logs from different containers or deciphering minified bundles in production, because the trace view spells it out step by step.
For teams working on larger Next.js applications—or those working with microservices—this is even more valuable than in our small example above. It shortens the debugging cycle and helps everyone on the project become more self-sufficient.
The minute a ticket comes in about a vague, show-stopping error, you can use traces to identify the source and create a precise fix. Instead of shaky guesses, you rely on solid evidence. By integrating tracing into your routine, you can tackle production issues head-on and keep your focus where it belongs: building robust features and getting happier users.
