Local Variables for NodeJS in Sentry
Local Variables for NodeJS in Sentry
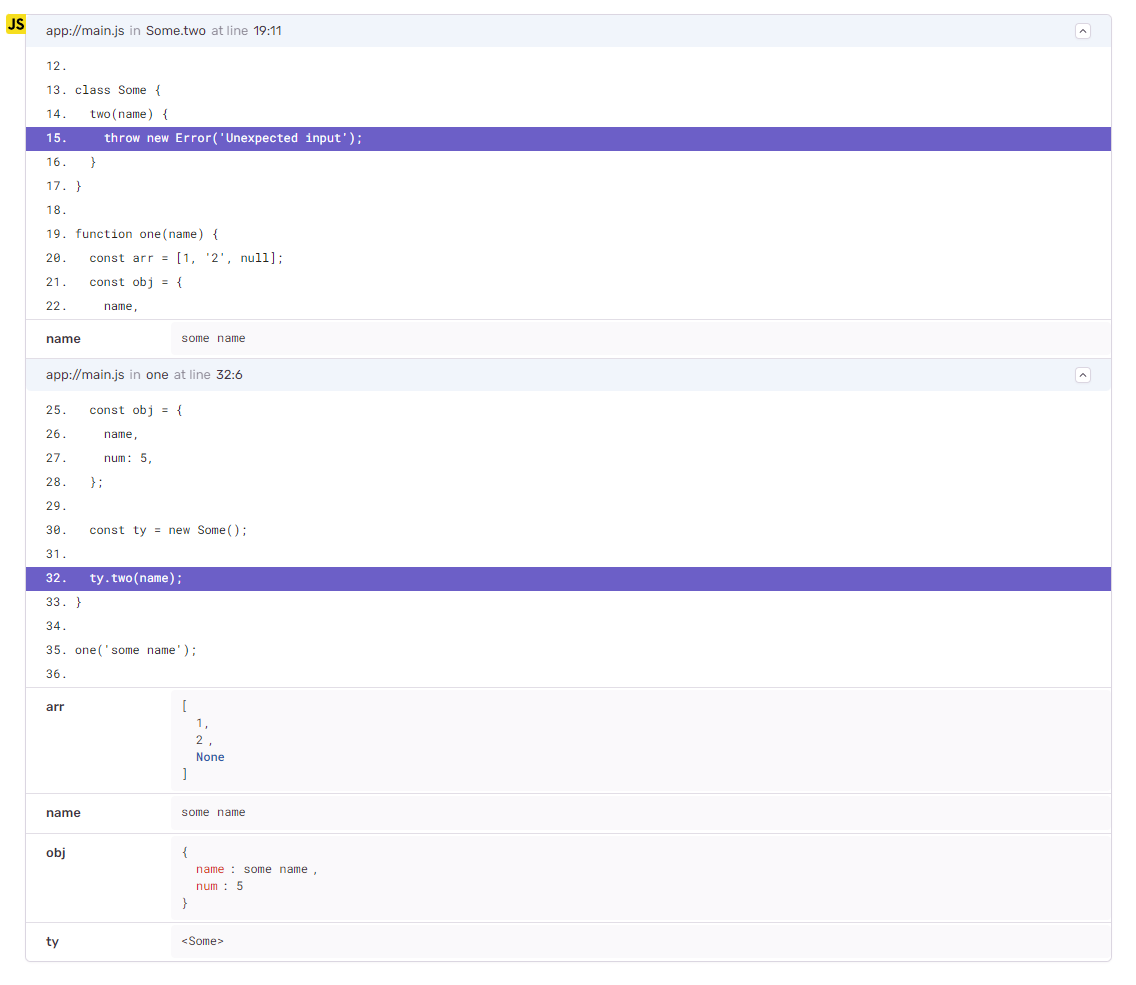
Stack traces show us exactly where an exception occurred, but you can still be left wondering: What arguments or state caused the exception to occur?
If you can reproduce the issue locally with a debugger attached you’ll have access to these local variables, but with Sentry you can identify the exception location without needing to reproduce the issue locally. By including local variables with stack traces, Sentry events become much closer to the full debugging experience.
We already have local variable support for our PHP, Python and Ruby SDKS - and now we support local variables on the Sentry NodeJS SDK. Sentry’s users have requested this for a while, but we couldn’t quite figure out how to get the local variable data into our stack trace data in a JavaScript environment.
It was only after GitHub user @larsqa questioned us about why local variables were showing up locally but not on Sentry events did we decide to take another look. This led us to discover and explore Node’s inspector API, which ended up giving us the information we needed to get local variables in NodeJS stack traces on Sentry.
You can try this out today with Node 18 and above - simply upgrade your @sentry/node package to version 7.46.0 or above, and enable the includeLocalVariables feature:
Sentry.init({
dsn: "https://examplePublicKey@o0.ingest.sentry.io/0",
includeLocalVariables: true,
});How we implemented local variables for NodeJS
Node’s inspector module was introduced as an experimental API with Node v8 and became stable in v14. It’s a simple wrapper around Chrome’s DevTools protocol which means it supports most of the features of Chrome’s Dev Tools, just without the handy UI. Using the inspector module, you can interact with a running Node.js process and its environment, including the call stack, heap, and other runtime information.
Once the inspector session is connected, we enable pausing on uncaught exceptions, provide a callback to be called when the debugger pauses and then enable debugging:
import { Session } from "inspector";

const session = new Session();
session.connect();
session.post("Debugger.setPauseOnExceptions", { state: "uncaught" });
session.on("pause", event => { /* handle event */ });
session.post("Debugger.enable");
When the debugger pause event fires, it’s then just a matter of cycling through the provided stack frames and local variable objectId’s and fetching the values:
session.post("Runtime.getProperties", { objectId }, (err, params) => { });The debugger pause event occurs before the Node global error handlers fire, so we need to cache the local variables for later attachment to the Sentry error event and we need to ensure we’re attaching the variables to the correct error.
How can we be sure that the error we later see passing through the Sentry event pipeline is the same error we recently inspected via the inspector API? Fortunately, the pause event gives us access to the error.stack string which we parse to build a key for storage in the cache. When events later pass through the event pipeline, we recreate this key and look it up in the cache.
Via the DevTools protocol, stack frames list the function name, column and row number but these don’t always match what is parsed from the stack string. We walk the call stack and attempt to pair up the frames and bail out when we can no longer be sure the frames match. We start from the top of the stack to ensure that the variables closest to the exception are more likely to be included. If you find instances where this is not the case, please open an issue so we can improve our integration tests.
The debugger pauses briefly to supply the call stack but does not remain paused while we’re asynchronous fetching the local variables. Because the app continues execution, it’s possible for the error to pass through the Sentry event pipeline before all the local variables are returned. For this reason we cache a pending Promise and only await it when we encounter a matching error.
Future improvements to this feature
Since local variables can be invaluable for fixing reported errors, we would eventually like to enable this feature by default, but we need to test it in different environments and make sure it has minimal performance impacts.
Using the inspector API to augment our error stacktraces using local variables is just the start. We could use it to augment our new Node Profiling SDK, add additional context to our error events, or automatically generate spans for our Node Performance Monitoring functionality. We’re excited to keep experimenting with this technology, and if you have any suggestions, please let us know.


