A Guide to Logging and Debugging in Laravel


ON THIS PAGE
- Setting up the example project
- Logging Laravel applications with Monolog
- Which tools to use for debugging Laravel applications
- How to troubleshoot and fix performance issues in a Laravel application
- Debugging and logging Laravel in production with Sentry
- Debug Laravel smarter, not harder
Logic errors, failed HTTP requests, background jobs that ghost silently—software breaks in all kinds of fun ways. The difference between resilient systems and fragile ones isn’t about avoiding errors altogether. It’s about how fast and clearly you can see what went wrong, and fix it.
Laravel gives you a solid foundation: structured logging, real-time introspection, and built-in performance monitoring. You’ve got tools like dd(), Log::debug(), Monolog, Telescope, Debugbar, and Xdebug for peering under the hood in dev and staging. But production is a different beast.
For full visibility in production across errors, slowdowns, and hard-to-reproduce edge cases, Sentry plugs into your Laravel app to give you the context you need, when you need it.
This guide walks through Laravel debugging tools: what they do, when to use them, and how to get the right insights without digging through logs or guessing what went wrong across environments.
To see how Laravel’s logging and debugging tools work IRL, we’ll use a sample payment API built with Laravel. The project allows users to send, receive, and convert money between currencies, and its minimal design keeps the focus on observability, not business logic. You can find the codebase here on GitHub.
First, clone the project:
git clone https://github.com/getsentry/sentry-example-payment-app.git payment-app
cd payment-app
Now run the following commands to install the dependencies and set up your environment:
composer install
cp .env.example .env
php artisan migrate
php artisan key:generate
Next, start the development server:
php artisan serveThe app is now available at http://127.0.0.1:8000.
You can populate the database with sample data using the following curl command:
curl -X POST http://localhost:8000/api/v1/generate-dummy-data -H "Content-Type: application/json" -H "Accept: application/json"By default, Laravel uses Monolog, a powerful PHP logging library that supports multiple log formats, destinations, and severity levels. Laravel wraps the library with a clean API (like Log::info() and Log::debug()), so you can start logging without needing to understand how Monolog works.
Let’s see how you can create a middleware that creates a log entry when a request takes more than 200 ms in your Laravel application.
First, run the following command to create a middleware class called LogSlowRequests:
php artisan make:middleware LogSlowRequestsThis command creates an app/Http/Middleware/LogSlowRequests.php file.
Now add the middleware code to app/Http/Middleware/LogSlowRequests.php:
<?php

namespace App\Http\Middleware;

use Closure;
use Illuminate\Http\Request;
use Illuminate\Support\Facades\Log;
use Symfony\Component\HttpFoundation\Response;

class LogSlowRequests
{
    /**
     * Handle an incoming request.
     *
     * @param  \Closure(\Illuminate\Http\Request): (\Symfony\Component\HttpFoundation\Response)  $next
     */
    public function handle(Request $request, Closure $next): Response
    {
        $startTime = microtime(true);

        $response = $next($request);

        $duration = (microtime(true) - $startTime) * 1000; // Convert to milliseconds

        if ($duration > 200) {
            Log::warning('Slow request detected', [
                'url' => $request->fullUrl(),
                'method' => $request->method(),
                'duration' => round($duration, 2) . 'ms',
                'ip' => $request->ip(),
                'user_id' => $request->user()?->id,
                'request_id' => uniqid(),
                'memory_usage' => round(memory_get_peak_usage(true) / 1024 / 1024, 2) . 'MB',
            ]);
        }

        return $response;
    }
}
The LogSlowRequests middleware measures the duration of each incoming HTTP request and logs a warning if the duration exceeds 200 milliseconds. In the logging entry, we capture metadata, including URL, method, user ID, IP address, and memory usage.
Next, register the middleware in bootstrap/app.php:
<?php

use Illuminate\Foundation\Application;
use Illuminate\Foundation\Configuration\Exceptions;
use Illuminate\Foundation\Configuration\Middleware;

return Application::configure(basePath: dirname(__DIR__))
    ->withRouting(
        web: __DIR__.'/../routes/web.php',
        api: __DIR__.'/../routes/api.php',
        commands: __DIR__.'/../routes/console.php',
        health: '/up',
    )
    ->withMiddleware(function (Middleware $middleware) {
        $middleware->api([
            \Illuminate\Routing\Middleware\SubstituteBindings::class,
            \App\Http\Middleware\LogSlowRequests::class,
        ]);
    })
    ->withExceptions(function (Exceptions $exceptions) {
    //
    })->create();
Now each HTTP request to your Laravel application that takes more than 200 ms will be logged in the laravel.log file.

Logging slow requests
Laravel’s logging system is channel-based. Each channel defines a driver (for example, stack, daily, slack, or syslog) and configuration for how and where logs are written. You define and customize logging channels in config/logging.php.
The default channel is typically stack, which lets you combine multiple channels into one:
// config/logging.php

'channels' => [
    'stack' => [
        'driver' => 'stack',
        'channels' => ['daily', 'slack'],
        'ignore_exceptions' => false,
    ],

    'daily' => [
        'driver' => 'daily',
        'path' => storage_path('logs/laravel.log'),
        'level' => 'debug',
        'days' => 14,
    ],

    'slack' => [
        'driver' => 'slack',
        'url' => env('LOG_SLACK_WEBHOOK_URL'),
        'username' => 'Laravel Log',
        'emoji' => ':boom:',
        'level' => 'critical',
    ],
]
You can switch the active logging channel in the .env file:
LOG_CHANNEL=stackUsing a stack ensures that logs can be written to multiple destinations simultaneously. For example, you can write debug output to a file while also sending critical errors to Slack or Sentry.
Logging helps you capture what went wrong, but it doesn’t always tell you why. For deeper insight into issues, you need debugging tools that help you trace requests, examine queries, and understand failures.
Laravel provides a range of tools you can use for debugging locally or investigating deeper issues:
The
dd()anddump()functions: To inspect variables, objects, and execution flow on the fly.Laravel Telescope: For deeper visibility, such as tracking SQL queries, measuring request duration, or understanding why a job failed.
Laravel Debugbar: To track rendered views, route details, query execution time, and memory usage.
Often, the first step in debugging is seeing what a variable contains. Laravel provides two built-in helpers for this:
dump()outputs the variable contents but continues execution.dd()(short for “dump and die”) outputs the data and terminates the request.
For example, you can log information about requests for payment creation, and have dd() under a catch block to analyze and handle exception details better.
// app/Http/Controllers/Api/PaymentController.php
...
public function store(PaymentRequest $request): JsonResponse
    {
        try {

            $payment = Payment::create($request->validated());

            // Debug: Check the created payment
            dump('Created payment:', $payment->toArray());

            // Raise error for testing
            // throw new \Exception('Test error');

            return response()->json(['data' => $payment], 201);
        } catch (\Exception $e) {
            // Debug: Check the exception details
            dd('Payment creation failed:', [
                'error' => $e->getMessage(),
                'trace' => $e->getTraceAsString()
            ]);

            return response()->json(['error' => 'Failed to create payment'], 500);
        }
    }
Then, when you use an API client to send a POST request to create a payment, you will see the output in the response panel.
curl -X POST 'http://localhost:8000/api/v1/payments' \
--header 'Content-Type: application/json' \
--data '{
    "amount": 100,
    "currency": "USD",
    "type": "send",
    "sender_id": 1,
    "receiver_id": 2
}'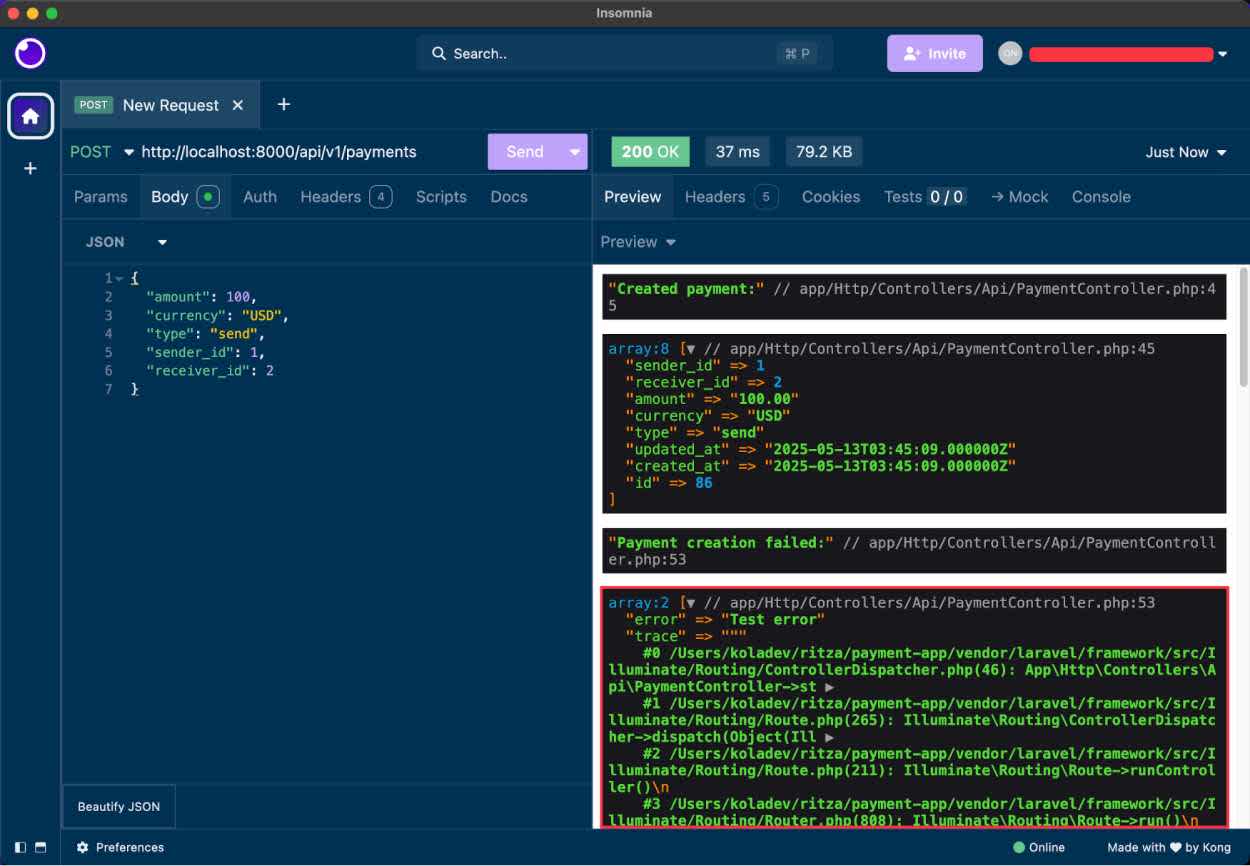
Making a request in Insomnia
The dd() and dump() functions are powered by Symfony’s VarDumper component, so you get clean, readable output even for complex objects and collections.
That said, dd() or dump() should never be included in production code. Those tools stop execution, leak internals, and aren’t logged. For production-safe inspection, it’s better to use structured logging like Log::debug().
Laravel Debugbar adds a visual toolbar to your application, displaying debugging information directly in the browser. Debugbar integrates tightly with Laravel and gives you instant feedback on what’s happening behind the scenes. It’s ideal for frontend-heavy development or when you want to inspect queries, routes, and request timing directly on the pages you’re developing.
You can install the package using Composer:
composer require barryvdh/laravel-debugbar --devOnce installed, Debugbar activates automatically and appears as a floating bar at the bottom of any page your app renders. The image below shows the root page of the Laravel application running at http://127.0.0.1:8000.

Laravel Debugbar
You can inspect the queries executed on this page before the content is rendered.

Laravel Debugbar SQL Queries
Debugbar is excellent for local development, especially when you’re dealing with Eloquent performance issues, trying to understand route behavior, or debugging composition issues. Like Laravel’s built-in helpers, Debugbar is not meant for production use. Keep it in your dev dependencies and disable it outside of local environments.
Laravel Telescope is an official debugging assistant that gives you deep visibility into your application’s runtime behavior. Useful during local development or when debugging in a staging environment, Telescope acts as a dashboard for your backend, displaying incoming requests, queued jobs, exceptions, logs, and database queries in real time.
Set up Telescope using Composer with the following commands:
composer require laravel/telescope
php artisan telescope:install
php artisan migrate
You’ll find the Telescope UI panel at http://127.0.0.1:8000/telescope.

Telescope UI
Once enabled, Telescope will automatically record details such as:
HTTP requests (including headers, payloads, and status codes)
Database queries (with bindings and execution time)
Logs
Scheduled tasks
Queued jobs
Model events
Telescope allows you to inspect the code without modifying it, giving you enough context to understand the situation and make informed decisions. For example, here is a detailed view of a POST request to /api/v1/payments.

Request detailed view
Avoid running Telescope in production unless it’s secured, as it exposes sensitive data. Even then, it isn’t optimized for production environments: Telescope logs everything, which can add performance overhead.
For low-level inspection and stepping through code line by line, Xdebug remains the most potent option for debugging Laravel applications in VS Code. With Xdebug, you can set breakpoints, watch variables, and control execution flow, all from your editor.
Laravel supports Xdebug out of the box, and if you’re using Laravel Sail, DDEV, or another containerized environment, enabling Xdebug is typically a matter of flipping a config flag.
When Xdebug is set up in VS Code, you can:
Pause execution inside a controller method or job handler to inspect what’s happening line-by-line.
Inspect objects, closures, and service container bindings.
Watch runtime state across the request and response lifecycle.
Learn more about debugging with Xdebug and VS Code in our on logging and debugging in PHP.
Laravel’s logging and debugging tools can also help uncover performance issues – especially during development.
Monolog: Add logging to middleware, listeners, or other performance-critical areas of your application to track slow SQL queries and identify bottlenecks.
Laravel Telescope: Monitor components that impact performance. On the Queries page, for example, you can see how long each query takes, identify slow ones, and dig into the details to understand what’s causing delays.
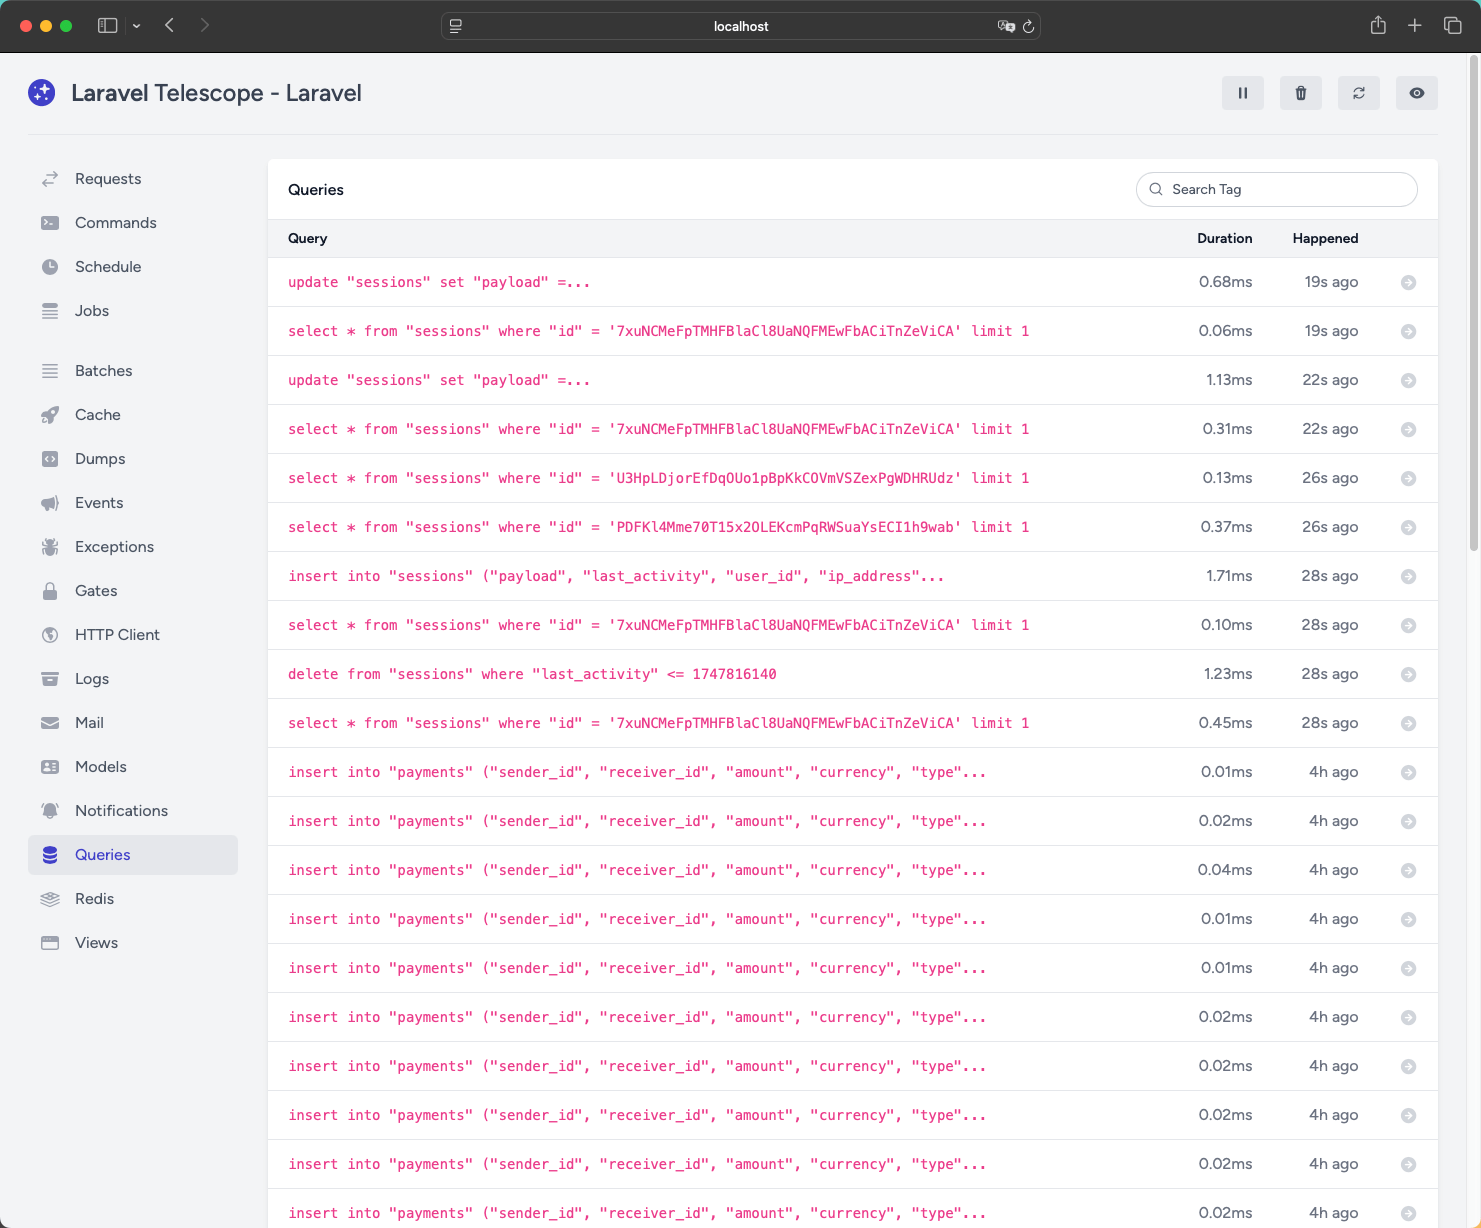
Laravel Telescope Queries page
Laravel Debugbar: Inspect what’s happening behind the scenes of your web pages. Use the timeline view to analyze query performance, track events, and see how long each part of the page takes to render.

Laravel Debugbar Timeline graph
However, these tools work best when you are already aware of performance issues and you are debugging them locally. In production, troubleshooting requires a different approach. Monolog can log issues, but it won’t notify you in real time. Telescope and Debugbar give you deep insight, but they track everything and aren’t designed to run safely in production.
For troubleshooting and fixing performance issues in production, you need to:
Be alerted when processes are slow.
See stack traces and exception context in real time.
Track which environments are affected.
Measure impact by seeing how many users are affected, how often, and which endpoints or views are involved.
Effective debugging requires knowing when your application breaks, why it happens, and what context led to the failure. This is where Sentry fills the gap: It captures unhandled exceptions, aggregates similar errors, displays full stack traces, and automatically adds context such as environment, route, user, and release version.
Integrating Sentry into a Laravel application is straightforward using the Sentry Laravel SDK. Review the complete PHP SDK documentation for more advanced integration options and platform support.
To get started, install the Sentry SDK using Composer:
composer require sentry/sentry-laravelEnable Sentry to capture unhandled exceptions by adding the following to the bootstrap/app.php file:
<?php

use Illuminate\Foundation\Application;
use Illuminate\Foundation\Configuration\Exceptions;
use Illuminate\Foundation\Configuration\Middleware;
use Sentry\Laravel\Integration;

return Application::configure(basePath: dirname(__DIR__))
    ->withRouting(
        web: __DIR__.'/../routes/web.php',
        api: __DIR__.'/../routes/api.php',
        commands: __DIR__.'/../routes/console.php',
        health: '/up',
    )
    ->withMiddleware(function (Middleware $middleware) {
        $middleware->api([
            \Illuminate\Routing\Middleware\SubstituteBindings::class,
            \App\Http\Middleware\LogSlowRequests::class,
        ]);
    })
    ->withExceptions(function (Exceptions $exceptions) {
        // Sentry config
        $exceptions->reportable(function ($e) {
            if (app()->bound('sentry')) {
                app('sentry')->captureException($e);
            }
        });
    })->create();
Next, create a project on Sentry and take note of the project’s DSN in the Sentry dashboard.
Run the following command to configure Sentry, replacing YOUR_DSN with your project’s DSN:
php artisan sentry:publish --dsn=YOUR_DSNThis command creates the config file (config/sentry.php) and adds the DSN to your .env file with the variable name SENTRY_LARAVEL_DSN.
Now, to make sure the configuration is running, use the following command to trigger an exception for Sentry to capture:
php artisan sentry:test
Sentry configuration test
If you navigate to the Sentry panel, you should see the issues.

Test issues with Sentry
With this setup done, Sentry will monitor your application and log any issues that arise. However, you can also manually report caught exceptions. For example, consider the endpoint to create a payment.
// app/Http/Controllers/Api/PaymentController.php

public function store(PaymentRequest $request): JsonResponse
{
    try {

        $payment = Payment::create($request->validated());

        // Raise error for testing
        throw new \Exception('Test error');

        return response()->json(['data' => $payment], 201);
    } catch (\Exception $e) {
        // Debug: Check the exception details
        dd('Payment creation failed:', [
            'error' => $e->getMessage(),
            'trace' => $e->getTraceAsString()
        ]);

        return response()->json(['error' => 'Failed to create payment'], 500);
    }
}
Instead of using dd(), we can report the exception to Sentry.
// app/Http/Controllers/Api/PaymentController.php

use Sentry\Laravel\Integration;
// ...

public function store(PaymentRequest $request): JsonResponse
{
    try {

        $payment = Payment::create($request->validated());
        // Raise error for testing
        throw new \Exception('Payment test error');

        return response()->json(['data' => $payment], 201);
    } catch (\Exception $e) {
        // Log the error with Sentry
        \Sentry\captureException($e);

        return response()->json(['error' => 'Failed to create payment'], 500);
    }
}
Now when a request is made to create a payment, it will result in a 500 error and Sentry will capture the exception.

Sentry capturing payment error
Clicking on the issue redirects us to a page providing more information about the exception. First, you have the detailed trace with the lines causing the error.

Issue trace
Scroll down to see details about the request, including the body, header, and metrics like server response time.

Sentry trace view
Once basic exception tracking is working, you can further customize how errors are organized and surfaced.
Sentry allows you to tag issues with custom data, such as the environment (local, staging, or production), the authenticated user ID, or specific application states. This helps you group and filter issues effectively, especially in multi-tenant or multi-service systems.
If you want Sentry to associate logged-in users with events automatically, you can enable this in the .env file:
SENTRY_SEND_DEFAULT_PII=trueAlternatively, for better control, manually set the user by listening to Laravel’s Authenticated event. Add the following code to app/Providers/AppServiceProvider.php:
use Illuminate\Support\Facades\Event;
use Illuminate\Auth\Events\Authenticated;
use Sentry\State\Scope;
use Sentry\Laravel\Integration;

/**
 * Bootstrap any application services.
 */
public function boot(): void
{
    Event::listen(function (Authenticated $event) {
        $user = $event->user;

        Integration::configureScope(static function (Scope $scope) use ($user): void {
            $scope->setUser([
                'id' => $user->id,
                'name' => $user->name,
                'email' => $user->email,
            ]);
        });
    });
}
With Sentry, you can enrich events by adding custom tags – indexed key-value pairs that you can use to group, search, and filter issues. Tags can track details like locale, customer tier, deployment version, or request source.
\Sentry\configureScope(function (\Sentry\State\Scope $scope): void {
    $scope->setTag('tenant', 'acme-corp');
    $scope->setTag('page.locale', 'en-us');
});
Learn more about enriching events in Sentry’s Laravel documentation.
Sentry enables you to track performance issues related to specific events in your project. For example, you can configure Sentry to alert you about slow database queries or N+1 requests. To fine-tune Sentry alerts, go to Settings → Projects → [Your Project] → Performance in your dashboard. All configuration options are under Performance Issues – Detector Threshold Settings.

Sentry performance configuration
Sentry also has a dedicated Laravel view found under Insights—> Backend, a single place to see how your app is really performing in production. It surfaces slow routes, failing jobs, expensive queries, and cache issues, and ties them back to the users and endpoints they impact most. So instead of jumping between logs, you can zero in on what’s broken, what’s slow, and what’s next to fix.

Sentry Insights for Laravel dashboard
Blog
See what’s slowing down your Laravel app—before your users do.
Insights for your Laravel project connects the dots between routes, jobs, queries, and cache usage, so you can fix what matters faster.
Laravel’s approach to monitoring and debugging is developer-friendly. Whether you’re using dd() to print a variable or Telescope to analyze a failed request, you’re working with tools designed to support developer productivity.
But most of those tools are optimized for development environments. Yes, you can configure Telescope for production, but you’ll need to secure it, manage access, and handle the performance implications. Laravel’s dd() and dump() functions offer instant visibility, but easily leak data and halt execution if used in the wrong context. Monolog provides structured logging, which is crucial for audit trails, but it lacks real-time insights and alerting capabilities.
In production, where real-time visibility, fast response times, and issue grouping across environments and user sessions are required, those limitations become apparent. You need to know something’s broken before your users report it, and that’s where Sentry stands out. Sentry integrates cleanly into Laravel, captures rich context across both frontend and backend, while supporting both production-grade monitoring and local development workflows.
Here’s a comparison table to help you decide which tool fits which use case:
Tool | Environment | Best Used For | Notable Use Cases |
Monolog | All | Structured logging and audit trails | Request logs, slow request alerts, error traces, compliance logging |
| Local | Quick inspection and stopping execution | Inspecting variables, debugging logic, short-circuiting during dev |
Debugbar | Local (browser only) | Inline visibility into views, queries, and route behavior | Frontend and backend integration debugging, AJAX inspection, query timing |
Telescope | Local and staging | Request, job, event, and queries introspection with a full UI | Debugging failed jobs, tracking queries, monitoring exceptions in staging |
Sentry | All (especially production) | Real-time error reporting, context, and alerting | Tracking uncaught exceptions, user or session tagging, error grouping across environments |