Logs are Generally Available (Still logs, just finally useful)
Logs are Generally Available (Still logs, just finally useful)


When we started building Logs in Sentry we had one goal: make them useful for real debugging, not just another high-volume text storage. This meant making them "trace connected" from day one. This let us ensure they were tightly connected to the actions and performance happening in your application, right where developers already go to investigate errors, performance, and latency issues.
Now, Logs is out of beta and generally available to everyone. The best part, we added a bunch of capabilities you asked for during the beta period:
Live Tailing: stream logs in real time to confirm fixes, watch long-running jobs, or spot issues the moment they happen.
Alerts: trigger on specific log patterns (e.g. repeated payment_status=declined) so you know about failures before users report them.
Dashboards: visualize log trends over time, like rising error rates in Safari or sudden spikes tied to a new feature flag.
Whether you're debugging a failed checkout, a flaky job, or a slow pageload, logs give you critical context. And when those logs are connected to the rest of your telemetry – traces, errors, and replays you find the root cause faster. No tab juggling, no timestamp math, just answers.
Read on to see real life examples of how Logs make it easy to debug annoying problems or just jump to our docs to start sending logs now.
See what happened even when nothing breaks
Trace-connected logs help you spot silent failures
Your frontend sends a checkout.request. The backend returns a 200. No issues are filed. No exceptions are thrown. But a user reports they never got an order confirmation.
You open the trace in Sentry. The checkout.request span looks fine. It completed successfully. But the async order.processed span that should follow? It’s missing.
You click into the checkout.request span. The logs scoped to that span show:
INFO EnqueueOrder user_id=5832 feature_flag=fast-checkout job_id=ff38cd
So the job was enqueued. You pivot to the logs for the order processor service and filter by job_id=ff38cd. No results. But a nearby log catches your eye:
WARN DroppedOrder job_id=ab3912 reason="missing config"
The fast-checkout flow is skipping a step. No crash. No errors. Just a missing config and a dropped job. Because the logs are tied to the trace—and scoped to the span—you spotted it immediately.
Watch jobs run (or fail) live
Your nightly invoice sync has been flaky for weeks. You push a fix and want to know tonight, not tomorrow, if it worked.
You filter logs to service=invoice-sync, turn on Live Tail, and watch:
INFO JobStarted user_count=2382
INFO Step1Completed duration_ms=84
INFO Step2Completed duration_ms=112
INFO JobCompleted total_duration_ms=764
Catch UI regressions before they snowball
Use dashboards to spot patterns, alerts to catch them next time
You roll out a new product carousel behind a feature flag. In testing, everything looked fine. But by the next day, bug reports start trickling in: “Page doesn’t load on Safari.”
No errors were thrown. No issues triggered. But users are clearly hitting something.
You check your logs and build a dashboard:
Filter to
feature_flag=product-carousel-v2Group by
user_agentandlevel
Safari stands out with a spike in level=ERROR.
You dig into the logs and see repeated messages like:
ERROR UIRenderer
render failed: fetchFonts is not supported
user_agent=Safari feature_flag=product-carousel-v2
The new UI depends on a font API that doesn’t exist in Safari’s environment. Nothing crashed—but the page never rendered.
You roll back the flag, push a polyfill, and then set a log-based alert:
Trigger if feature_flag=product-carousel-v2 AND message contains "render failed"
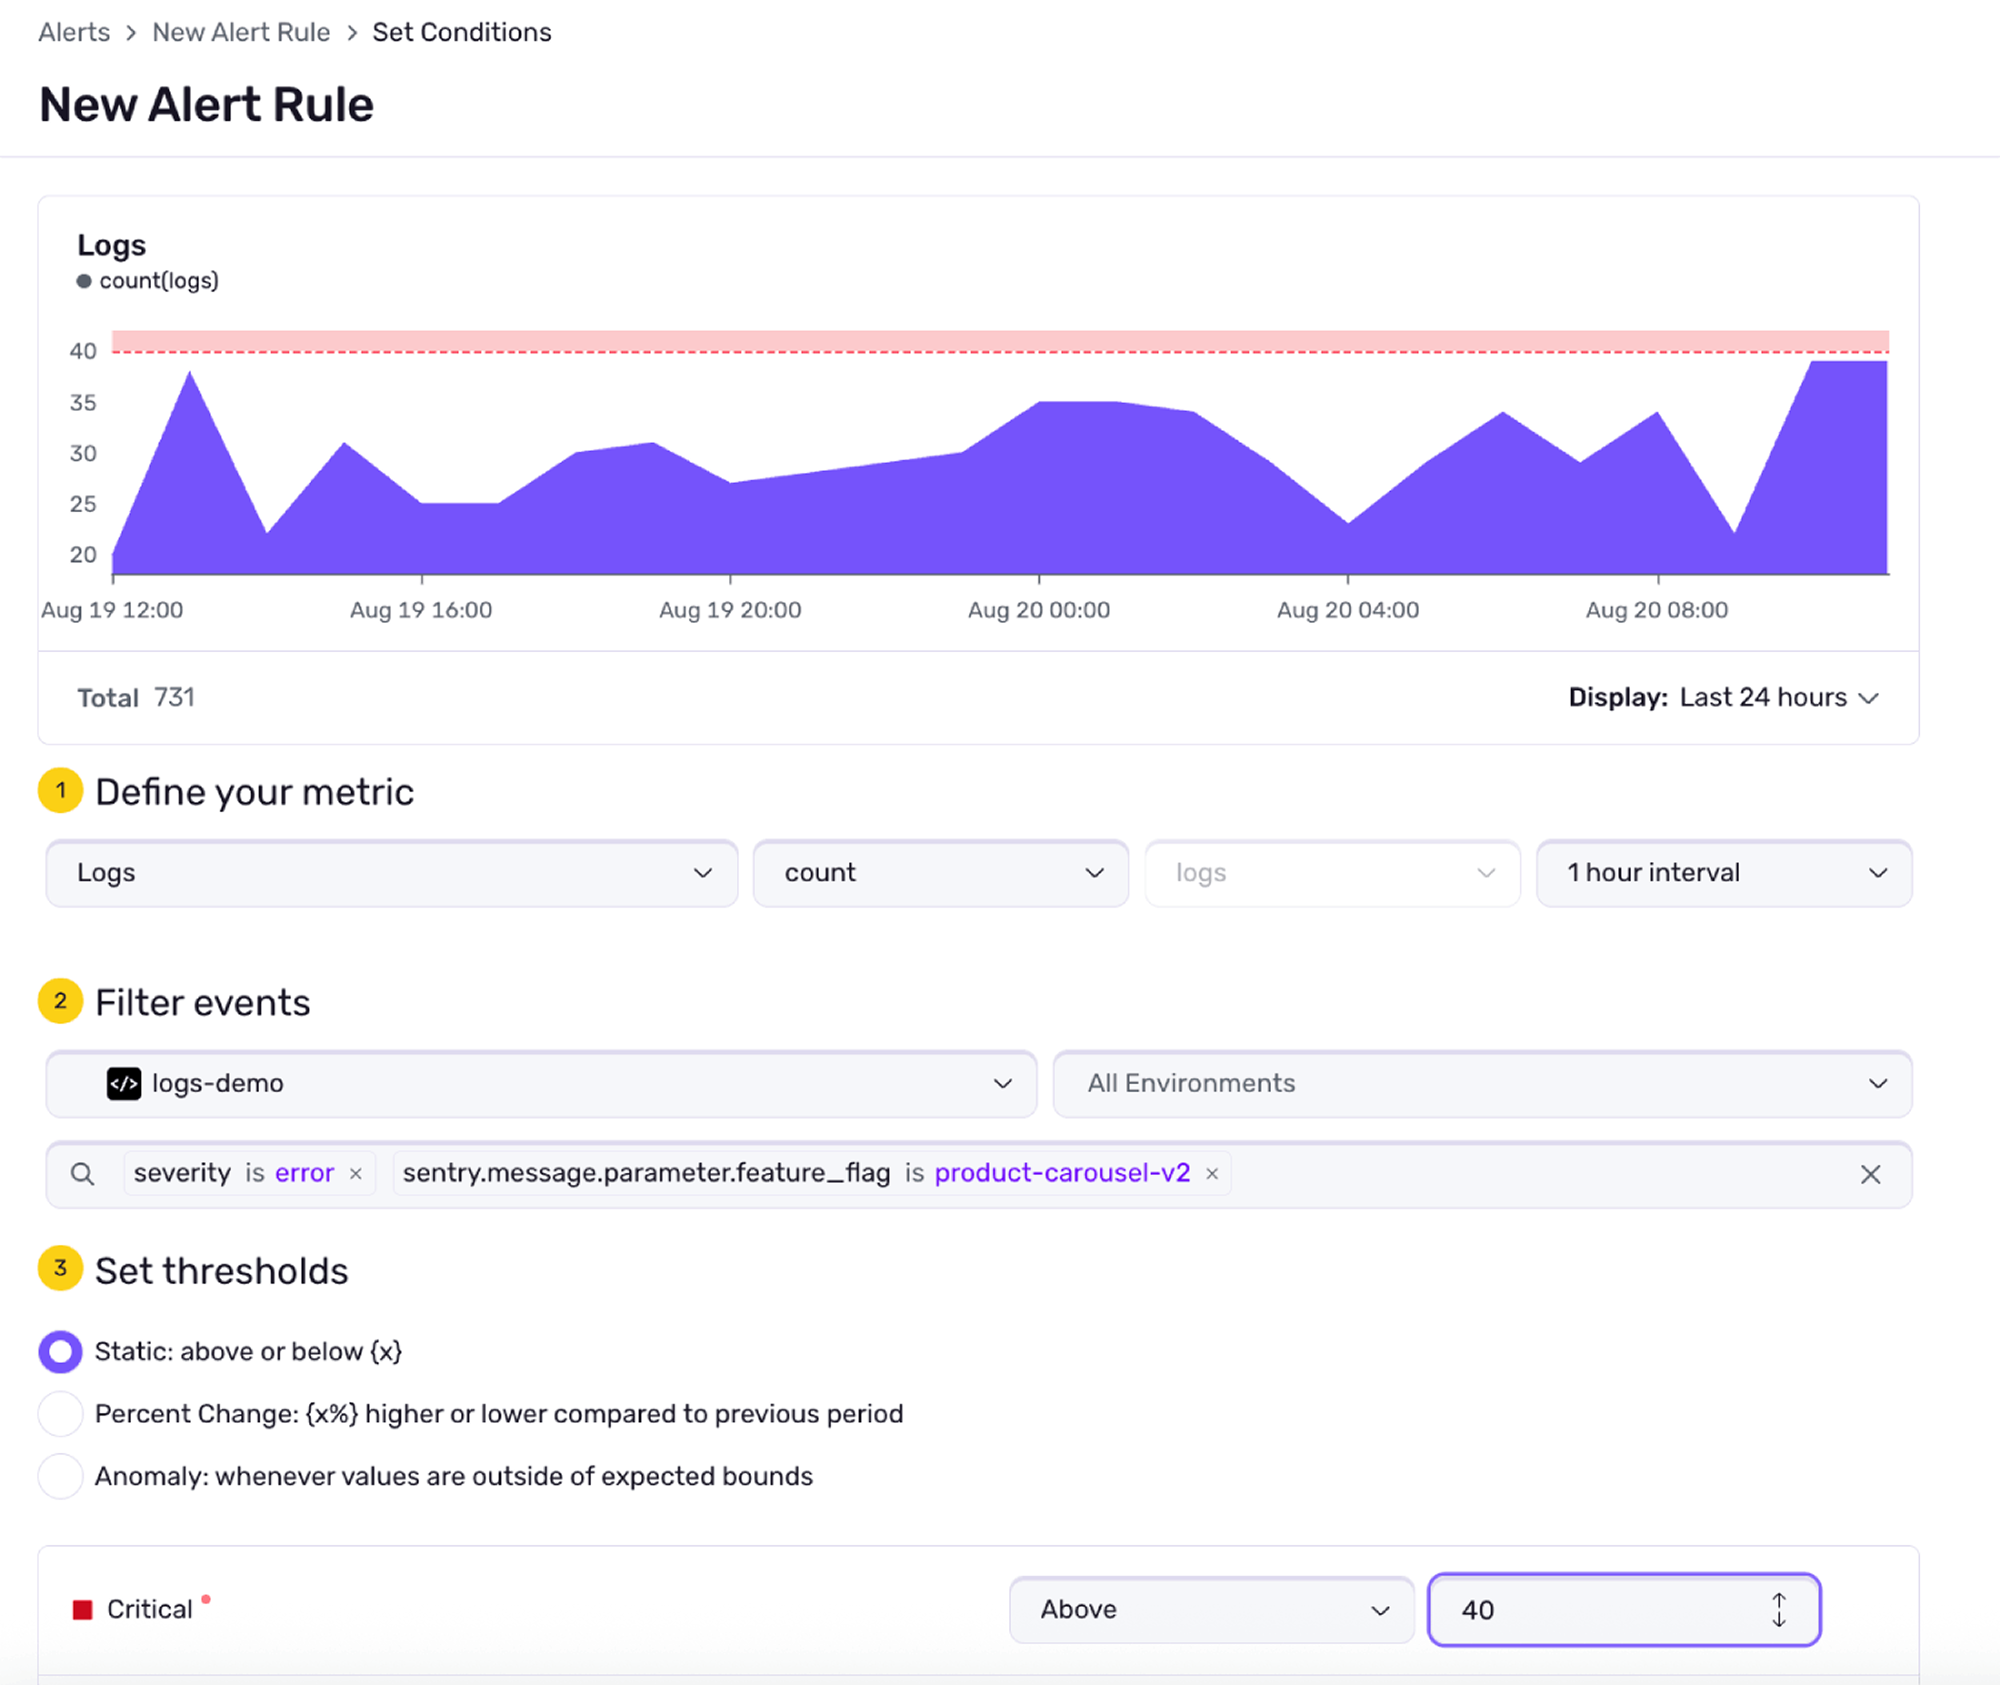
Next time, you won’t wait for bug reports to know something’s off.
What do people think so far?
We could keep talking about how useful logs are, but some of our users have been doing a pretty good job on our behalf:


Since the beta, developers have pushed terabytes of logs through Sentry every day. More than 5,000 teams already use them. Some have even stopped SSHing into servers just to grep through raw log files entirely.
![a screenshotted quote, saying "I love it! This is fantastic! It's super simple and not bloated with unnecessary features. It's already helped me solve multiple bugs without needing to SSH in my server or view [REDACTED] (which I hate)"](https://images.ctfassets.net/em6l9zw4tzag/3kSUFBn4XtBznHwzbd194V/b351f949c31b3458d541ef801c39e5bc/logs-ga-quote_1.png?w=2000&h=135&q=50&fm=png)
Getting started with Logs
All Sentry customers get 5GB of logs each month for free. And additional logs cost 50 cents/GB.
Getting started takes a minute. Logs works with Python, JavaScript, Go, Ruby, PHP, .NET, Java, and Mobile. Here’s what it looks like in JavaScript:
Initialize the SDK with the enableLogs option set to true.
Sentry.init({
  dsn: "your_dsn",
  // Enable logs to be sent to Sentry
  enableLogs: true,
});
Then use the logger API to send structured logs with custom attributes:
const { logger } = Sentry;

logger.error(logger.fmt`Checkout failed`, {
  order_id: "a3f8c9",
  user_id: 1234,
  payment_status: "declined",
});

logger.info(logger.fmt`${user.username} added ${product.name} to cart.`, {
  cart_id: "xyz789",
  user_id: user.id,
  product_id: product.id,
});
Every log you send can include structured data like user_id, order_id, or feature_flag so you can filter, group, and alert on it directly in Sentry.
Once logs are flowing, you’ll see them right next to the traces and errors you already use to debug—automatically scoped, searchable, and with the attributes you care about.
Existing Sentry users can try it for free for 14 days or if you don’t have an account, start one for free.
Join us on Discord or GitHub if you’ve got questions, or check out the full documentation to start sending logs.