Meet Web Vitals Performance Issues


Ben Coe -

We’ve introduced a new type of Performance Issues, Web Vitals Performance Issues. These issues will be opened for the highest opportunity pages in your application if your Web Vitals metrics drop into our meh, or poor thresholds for performance.
We’ve built these issues with Seer Issue Fix specifically in mind. Our goal is to not just alert you about low vitals scores, we want to give you actionable steps you can take to improve your scores and, when possible, fix the problem for you.
What are Web Vitals, and why should you care?
Web Vitals are standard metrics for understanding how your site’s user experience compares to benchmarks for performance. A website with good vitals scores isn’t guaranteed to have a great user experience, but a website with bad vitals is — most likely — a bad user experience.
But hey, even if you don’t care about providing a delightful user experience, Web Vitals can affect your ranking in Google’s search, your listings on Shopify, etc. tldr; they affect your bottom line 🤑.
The three Core Web Vitals (the ones you should care about most) are:
Largest Contentful Paint (LCP): How long does it take the largest element on your page to render? Measuring loading.
Interaction to Next Paint (INP): When interacting with a page element, how long does it take the next frame to render? Measuring interactivity.
Cumulative Layout Shift (CLS): How much do elements shift during pageload? Measuring page stability.
Web Vitals and Sentry
Sentry already has a great out-of-the-box dashboard for measuring Web Vitals metrics across your application — we talk about the feature here, and here, and also here.
Here are some things some things that make Sentry’s existing Web Vitals functionality cool:
We collect metrics from real user sessions. As developers are well aware, things usually run perfectly on your own computer.
We collect metrics for authenticated pages without additional hoops to jump through.
You can see your Web Vitals performance in the context of other telemetry — maybe a page was slow to load because an exception was thrown and an operation retried.
Today we’re releasing a slick update to Sentry’s built-in Web Vitals features, Web Vitals Performance Issues.
Introducing Web Vitals Performance Issues
Web Vitals Performance Issues are a new type of Performance Issue that will be triggered when the highest traffic pages of your application are exhibiting poor vitals metrics for an extended period of time.
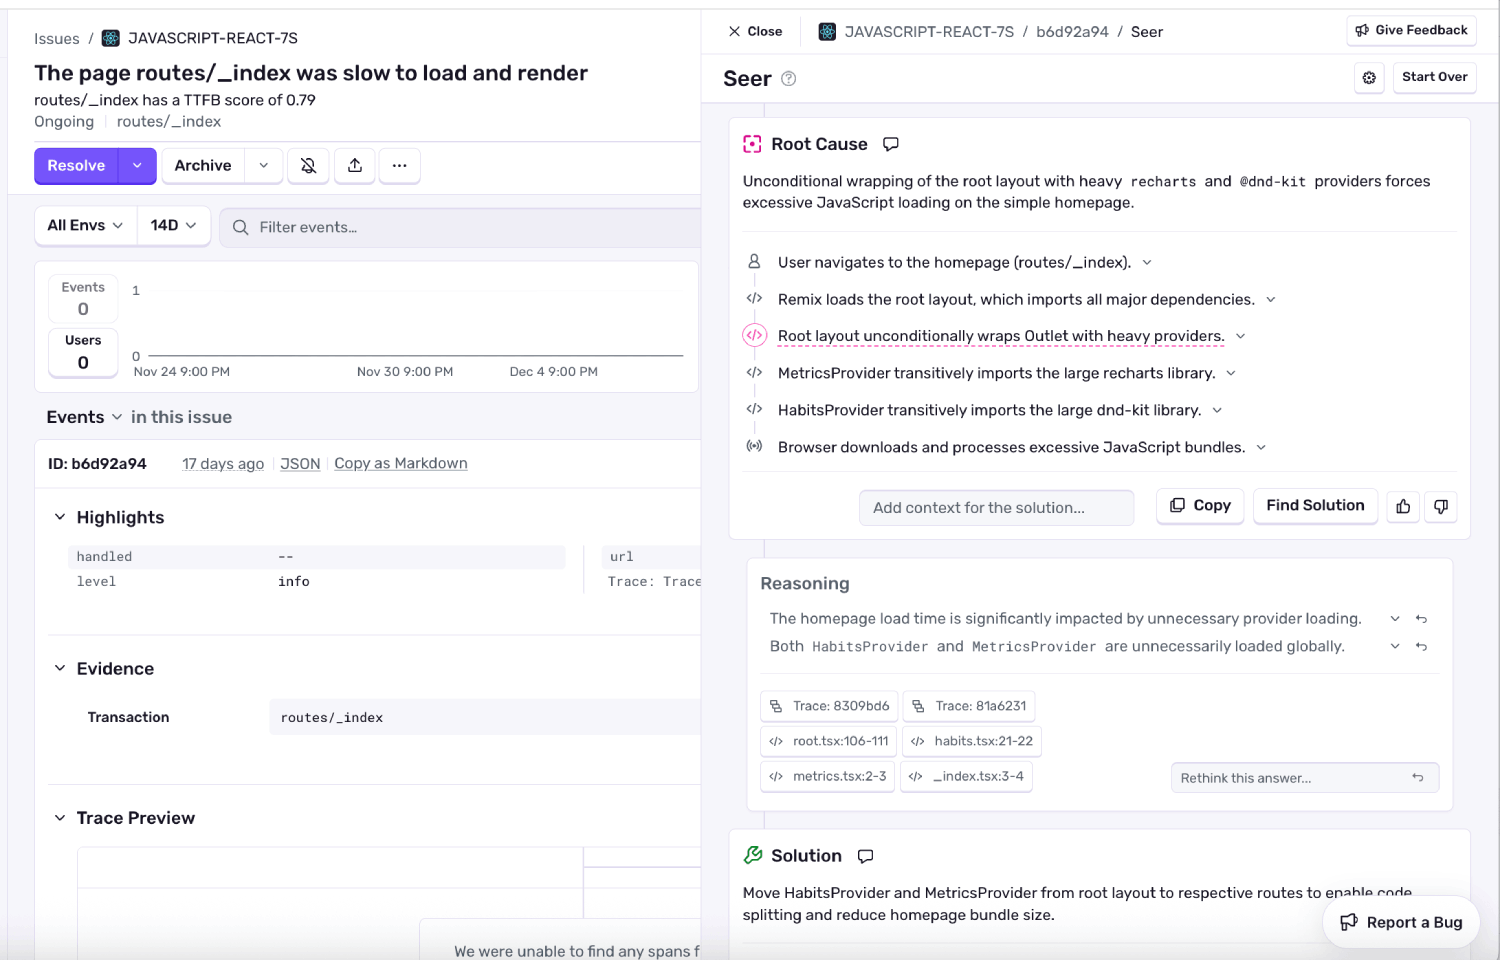
In my opinion, the killer feature? With Sentry’s Seer Agent, these issues won’t just warn you about a bad score, they’ll help you root cause and actually fix the underlying problem.
Why didn’t we do this sooner?
Up until now, we opted not to alert users about poor Web Vitals scores (even though Performance Issues aren’t new), what was preventing us?
We didn’t want to create busy work for developers. Although important, poor Web Vitals measurements are secondary to signals like errors in an application.
We didn’t want to spam users with a alerts. A bad Web Vitals metric may be a problem across dozens of pages.
We didn’t want to create issues that weren’t actionable. “Okay, I have a bad CLS score, now what?”, we imagined users asking.
Here’s how the approach we’ve taken addresses these concerns…
Avoiding spam and busy work
We’ve taken a few steps to avoid overwhelming engineers with a wall of Web Vitals issues:
Issues are created at a lower priority than critical errors, so they can be filtered out of the issue stream.
Issues are only opened for the top 5 highest opportunity pages.
We only reevaluate Web Vitals scores every two weeks, and won’t open new issues for the category of problem for the same page.
With Seer Root Cause Analysis, we hope that we can give developers a helping hand fixing poor Web Vitals scores (not just alert them).
Making issues actionable
How are we making sure these issues are actionable?
We’ll only open Web Vitals issues if you have Seer enabled on your account. We didn’t want to create alerts without also helping you fix them.
We attach various signals to the Web Vitals issues, making it possible for our AI agent to root cause and fix the problem:
Seer has access to the codebase exhibiting the poor web vitals score.
Seer has access to traces representing typical user sessions on the page.
Seer has access to the historical Web Vitals metrics for the given page.
Wrap things up already…
It’s my hope that, with some of these design decisions we’ve made, we’ve built something that:
Will truly help people better diagnose and fix gnarly performance issues on their websites.
Won’t introduce annoying new tedium to engineers that makes them want to throw their laptop out the window 😅. Note, if you do find yourself wanting to throw something, the feature can be turned off here.
Read more about Web Vitals Performance Issues in our documentation, and please be liberal with your feedback.