How a Product Studio Mitigates User Friction with Performance Monitoring
How a Product Studio Mitigates User Friction with Performance Monitoring
Panenco is a Product as a Service studio with more than 50 software development, product management, data science, design, and marketing experts building and hosting applications spanning multiple industries, including healthcare, fintech and education. For them, customer success isn’t just a business function, teams focus heavily on providing a fast, frictionless UX.
Success invariably brings new challenges and as the business and number of people using their solutions grew, developers found themselves increasingly reactive to user feedback, turning issue resolution into “fishing expeditions” with teams spending more time skimming through raw logs.
Senior engineer Sebastiaan Viaene explains that teams historically handled customer feedback in a reactive manner, focusing on being easily reachable for all audiences and ensuring quick response times.
Rather than spending more time on handling an increasing amount of incoming requests, we started looking for ways to prevent them altogether and spot broken code, crashes, and failed API calls before users are impacted.
"We needed an efficient error and performance monitoring solution that we could implement across our entire portfolio," says product manager, Ruben Opdenakker, adding that they specifically wanted a single platform with which they could:
Quickly see failed API calls
Monitor endpoint performance
Measure the actual response time their customers experienced
Implementing Sentry took 2 days, and as they continued to define new processes the team saw how automatic error and exception reports and alerts on crucial performance issues sped up investigations, and let developers resolve performance issues before they caused any “user misery.”
Over the past few months, we made error and performance monitoring integral to our operating model. We’ve seen improvements in user experience and boosted performance while reducing user friction, says Sebastiaan.
Improved Performance = Reduced User Friction
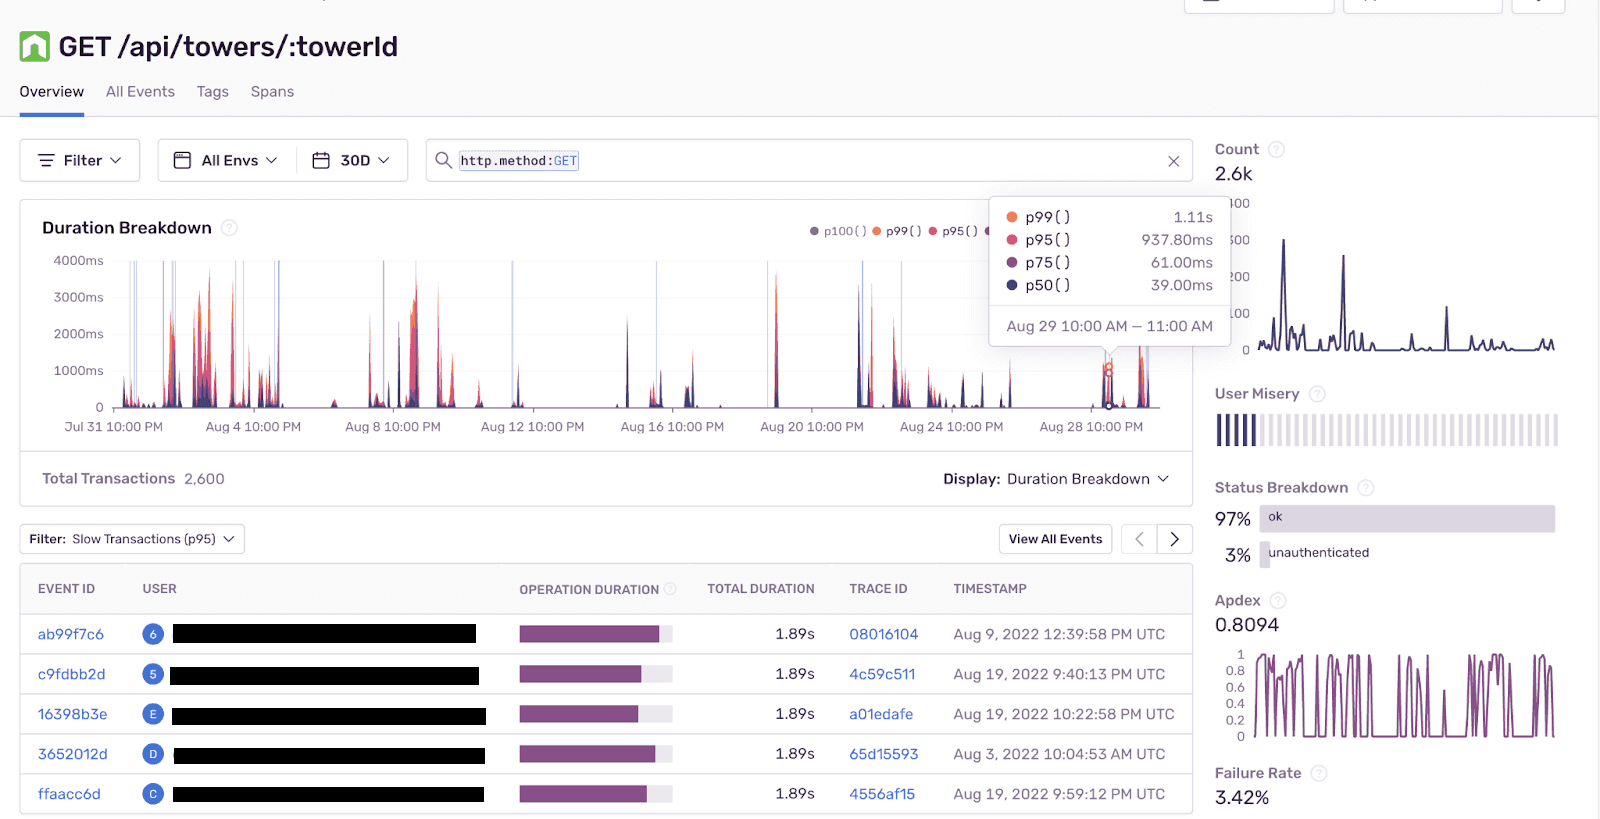
With visibility into backend performance and the ability to detect endpoints with the highest response times, developers already cut the time it took to find ‘the root cause of slow’ and improve application performance.
Measuring the actual response time users experience
Being the tinkerers they are though, the team wanted to take it a step further. The idea? Break response times down to the main tasks that the backend had to execute for each endpoint.
We look at endpoints if there is a lot of user misery. Look at spans to see what takes long - look at the high volume stuff to see where we can improve.
So, they integrated performance monitoring with their CICD setup and created a separate repository with stress-testing code written in Locust. A scheduled pipeline executes a stress testing session on a daily basis targeting the staging backend server, and generates a report on completion.
Sentry captures a percentage of these endpoint calls, which developers then use to review their response times. The team also configured Sentry to automatically create issues on GitLab for their backend and link existing issues to Sentry reports, minimizing the manual overhead for the issue tracker and "resulting in up to orders of magnitude fewer database queries."
As a business, Panenco brought together a talented group of problem-solvers to build high-quality digital products in partnership with companies and entrepreneurial individuals. As a team, they applied that same dynamic to product development, performance and user experience.
We use Sentry to monitor API and endpoint performance and have seen up to a 90% reduction in API request execution time for our highest-volume portfolio products. Customer success is a critical function of our business’ daily operations, and performance gives us a clear idea of how we’re tracking against our “frictionless user experience” goal, says Ruben.
For an in-depth look at how Panenco uses Sentry, check out our full conversation with Ruben and Sebastioaan here.


