Mobile Crash Reporting: Helpful Tips on How to Investigate Mobile Crashes
Mobile Crash Reporting: Helpful Tips on How to Investigate Mobile Crashes
A mobile application can crash for a variety of reasons, and it is sometimes difficult to know the reason. Android mobile crashes cause more problems because of the huge number of Android mobiles and the different OS they run. In this post, we will generate a simple error and then look at multiple ways to monitor the error.
We'll check the crash reporting through the log available in Android Studio. Then, we'll compare Crashlytics and Sentry to see how each tool investigates errors and mobile crashes.
Initial Setup
We will first create a simple app for our post that we will use with Android Studio, Crashlytics, an Sentry.
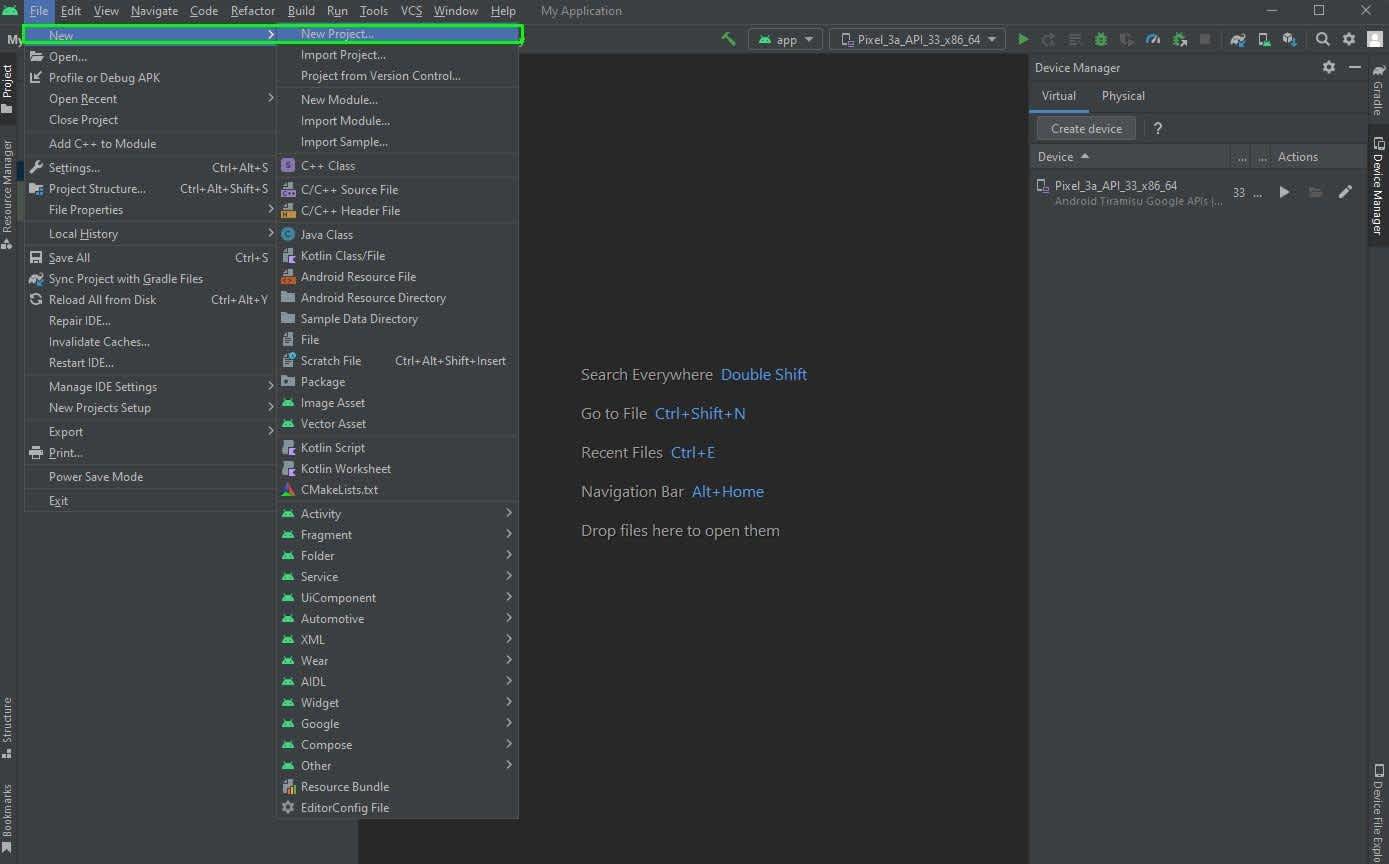
First, we will create a new project in Android Studio. After opening Android Studio, click on New -> New Project.
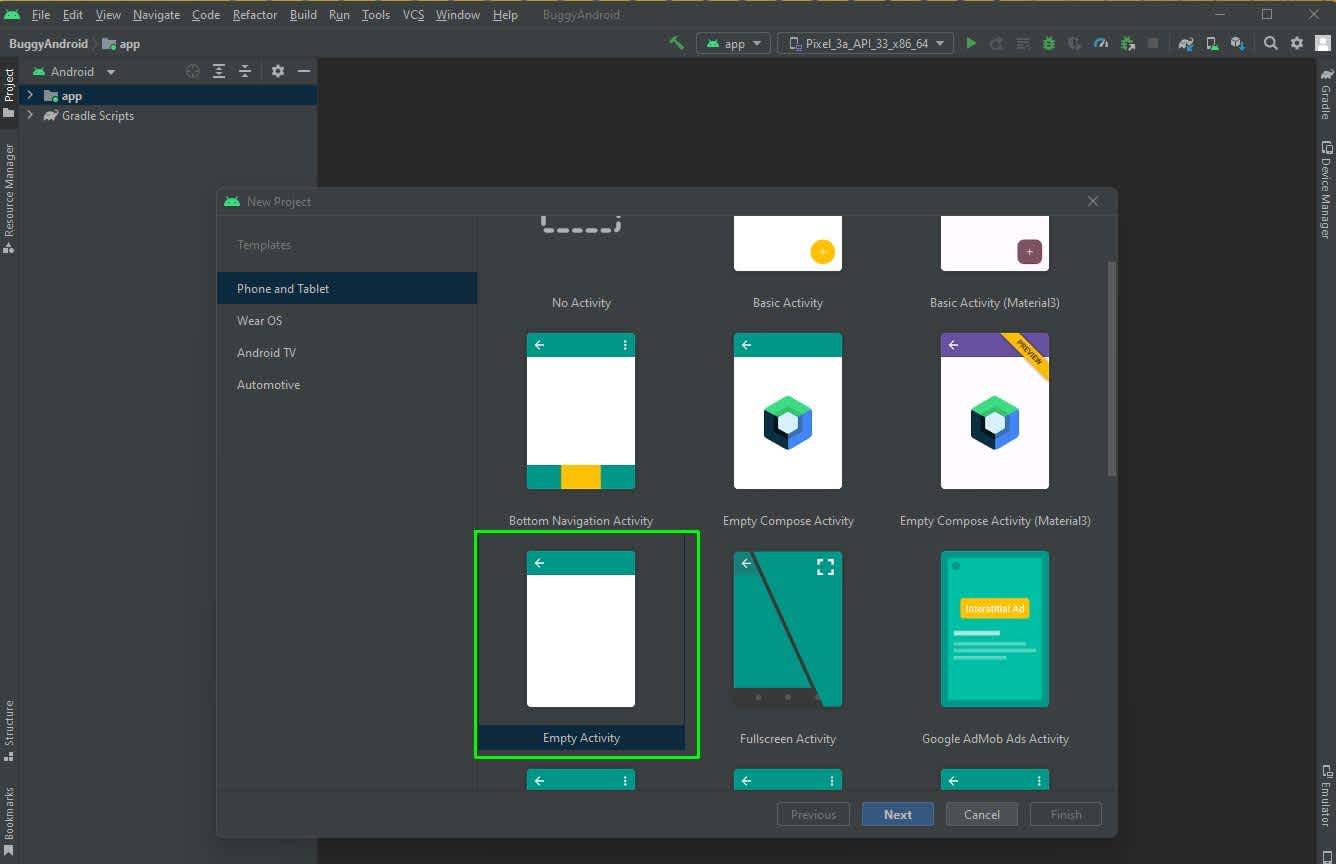
On the next screen, click on Empty Activity and then the Next button.
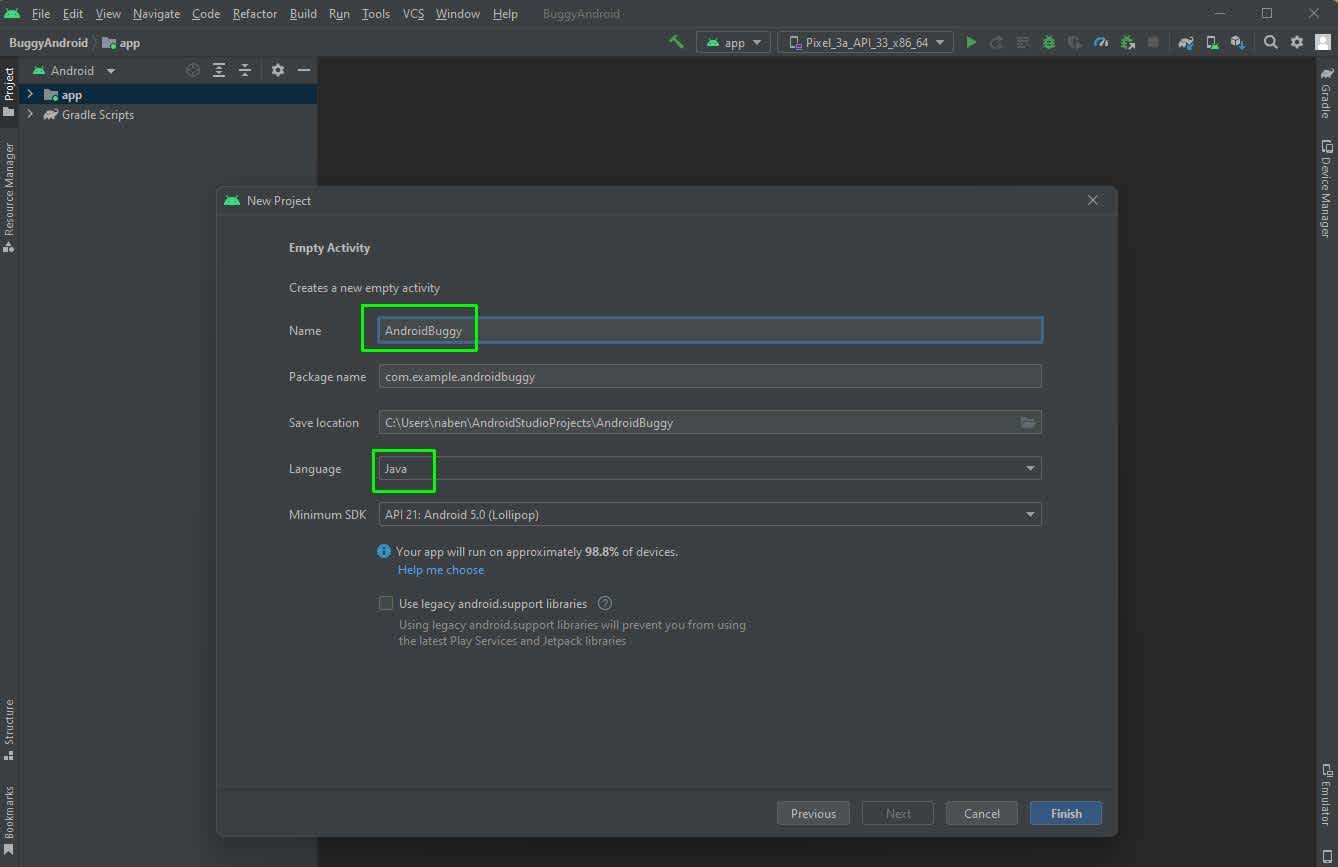
You'll be asked to give the Name and Language. Give any name, but choose Java for the language because we are going to write a small app in Java.
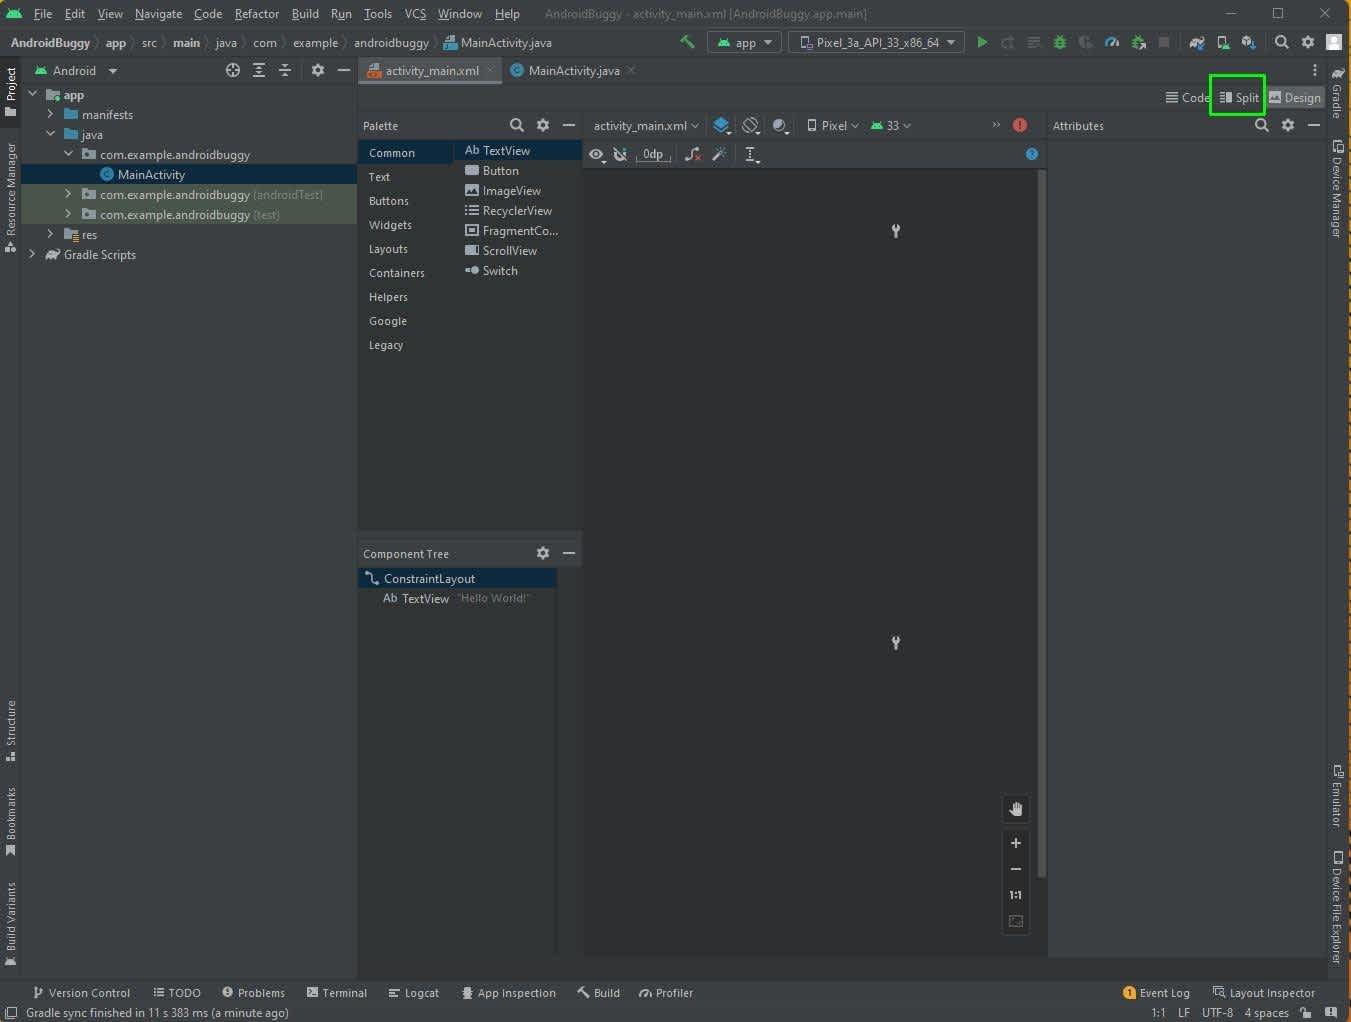
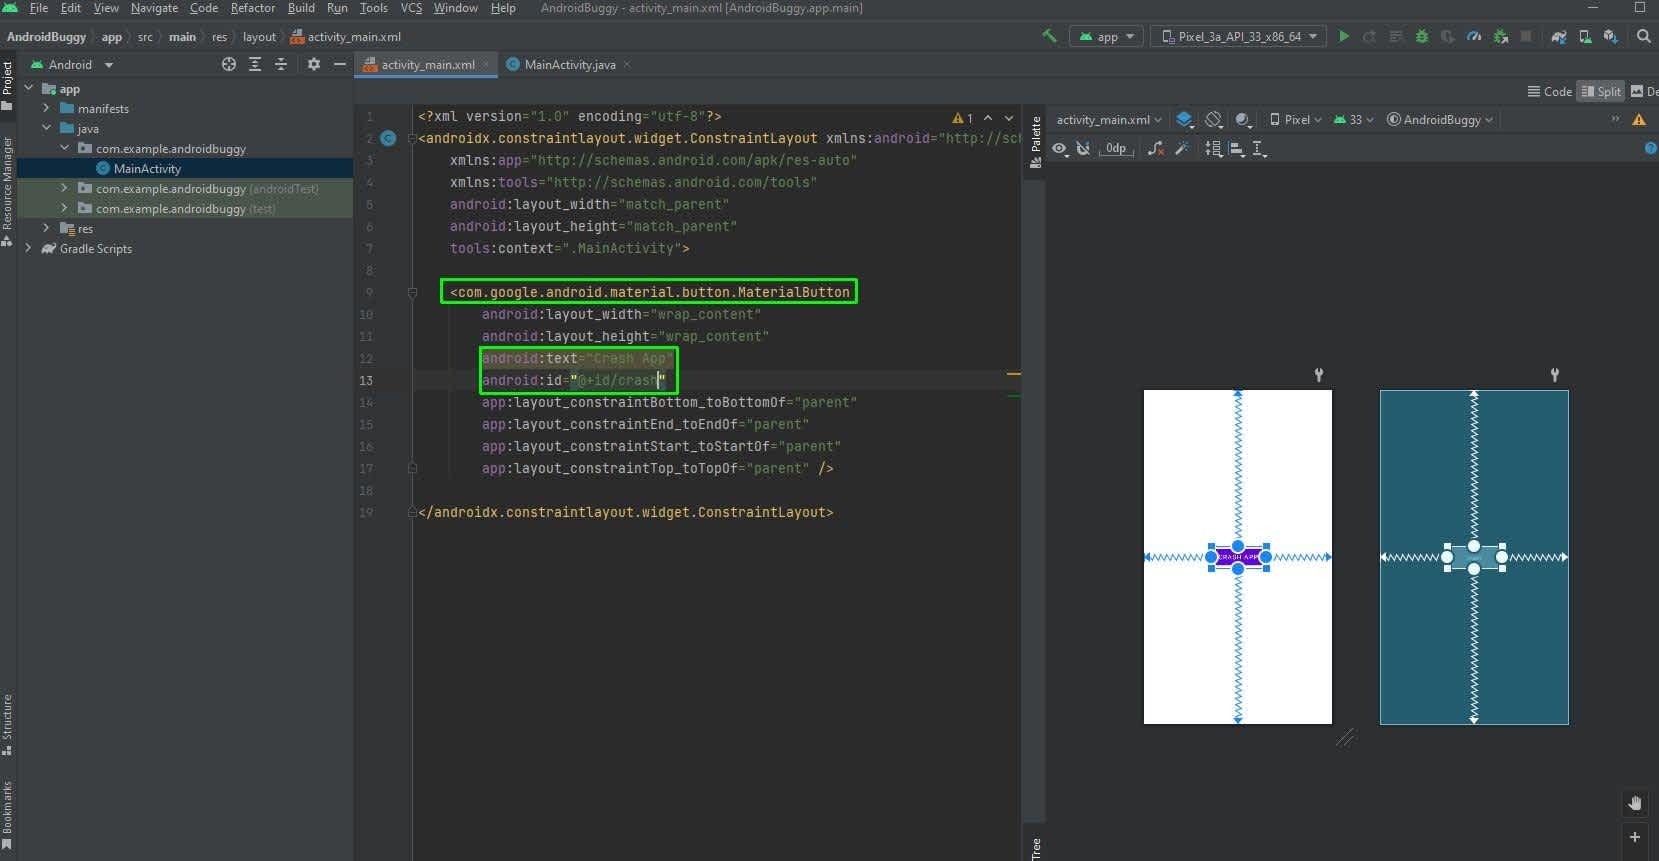
After that, the activity_main.xml will open. Here, click on Split to open the code.
Now we are going to change the code a bit and add a MaterialButton. We'll also add text and id to it.
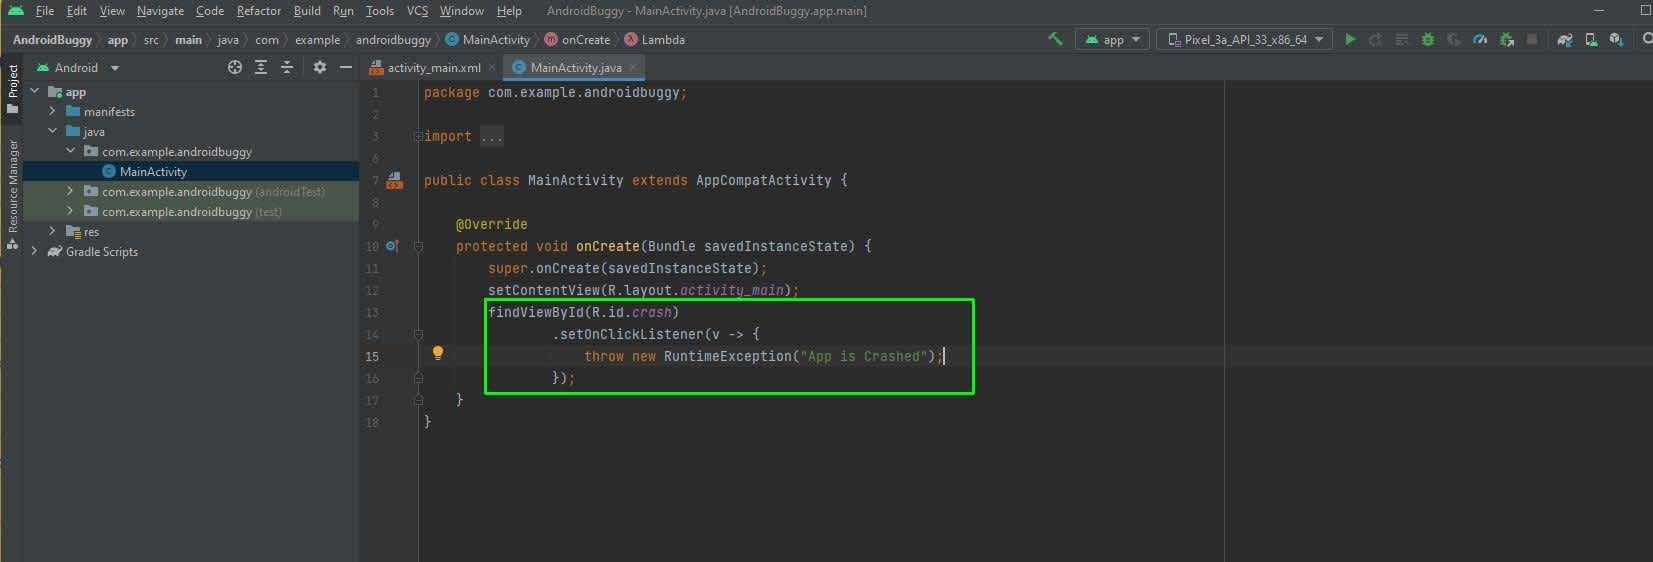
Next, open the MainActivity.java file and add a new in-built function, findViewById. Here, we are taking the id of crash and hence selecting the button. After that we are adding a new click listener. Here, we are just throwing an exception.
Logcat Crash Reporting
We will first look into checking the crash reporting by using Android Studio. Logcat is a good feature that will help us investigate the mobile crashes.
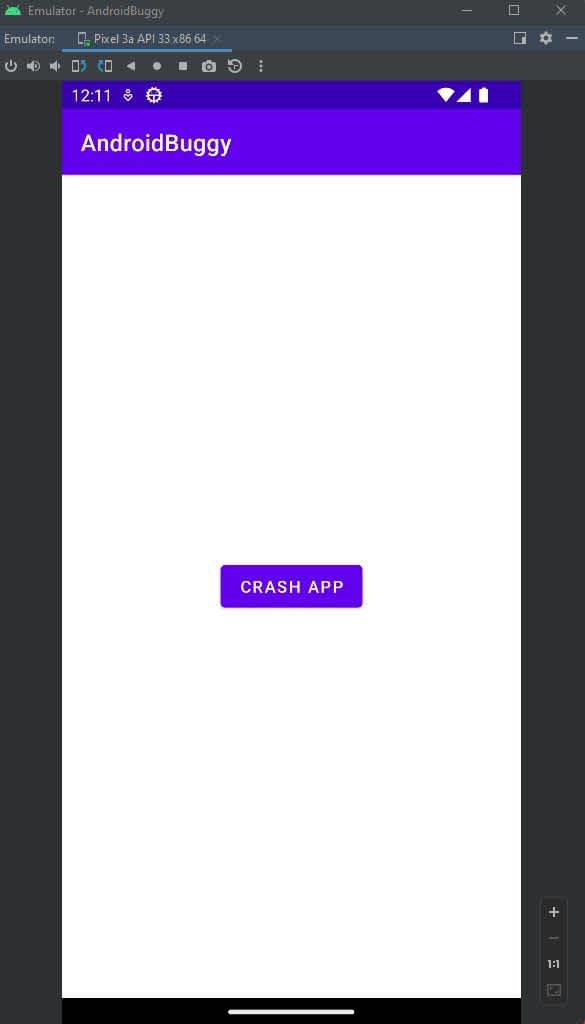
We will first start our Android app on the emulator, as shown below. Here, click on the Crash App button.
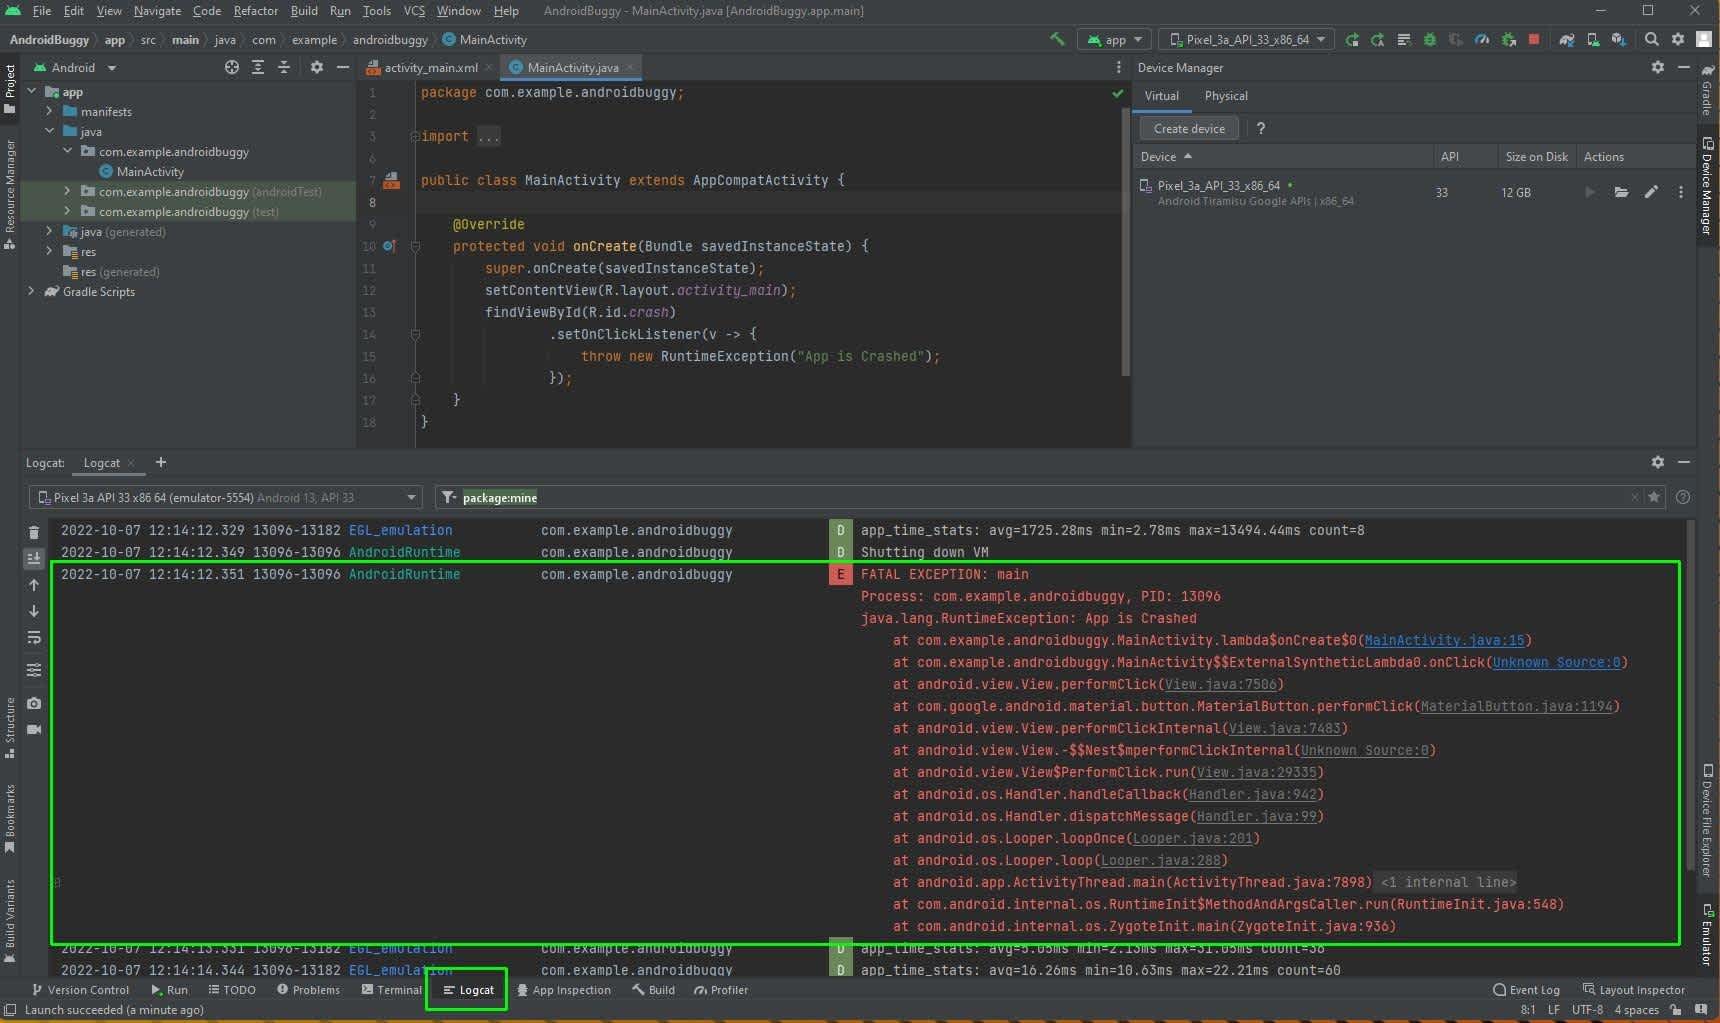
Now, go back to Android Studio and click on Logcat at the bottom. It will open a tab showing our error. The error is shown correctly, but there isn't much information about it.
Challenges with Mobile Crash Reporting
We have a lot of challenges with mobile crash reporting with in-built tolls like Logcat. As mentioned above, there isn't much information. That's fine for this small app, but for a larger production app it's a bigger problem.
Second, it is very difficult to find the root cause of the error, even in our small app.
But the biggest problem is when the mobile app is deployed on the Google Play Store. Android is fragmented, with thousands of different models, and a lot of mobiles are not updated with the latest Android OS. Generally the developer develops the mobile app in the latest Android OS and the testers test them on a limited number of devices running different OS.
So, when an app fails on an old mobile device running an old Android OS, it is very hard to reproduce. Google provides crash reports for deployed apps, but it is very difficult to continuously monitor and get the error data.
Crashlytics for Mobile Crash Reporting
Let's first look at Crashlytics, Google's cloud based crash reporting tool. It solves most of the problems with Logcat and other built-in tools. This tool is from Google's Firebase Suite, so you need to have an account to use it.
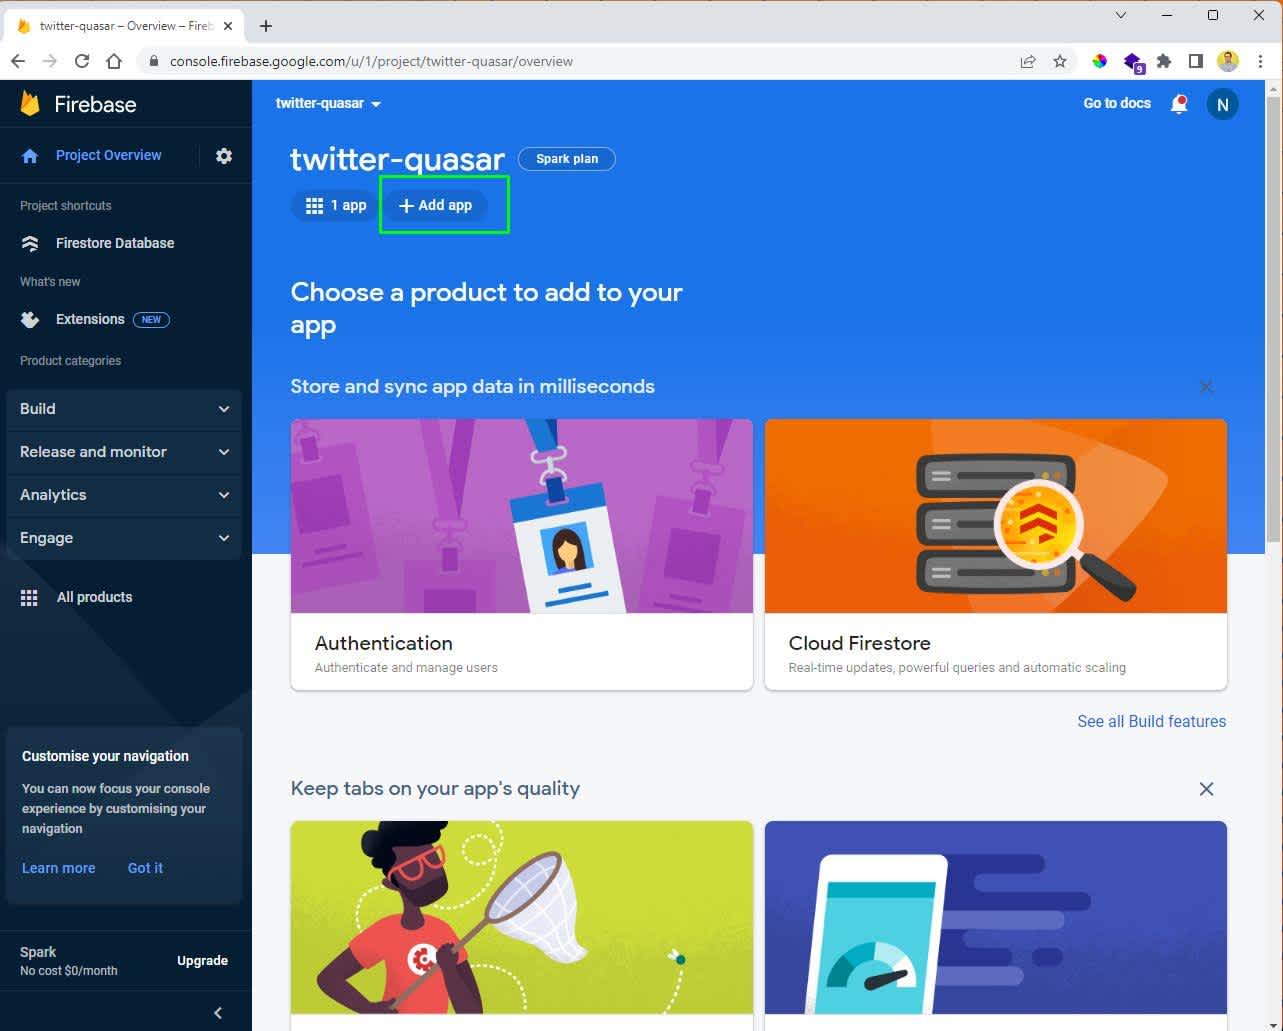
We can create a new app in Firebase or add an existing app. We are going to do the latter. To accomplish that, after opening our existing app, click on + Add app.
A menu will open showing different types of apps. Click on the Android app icon.
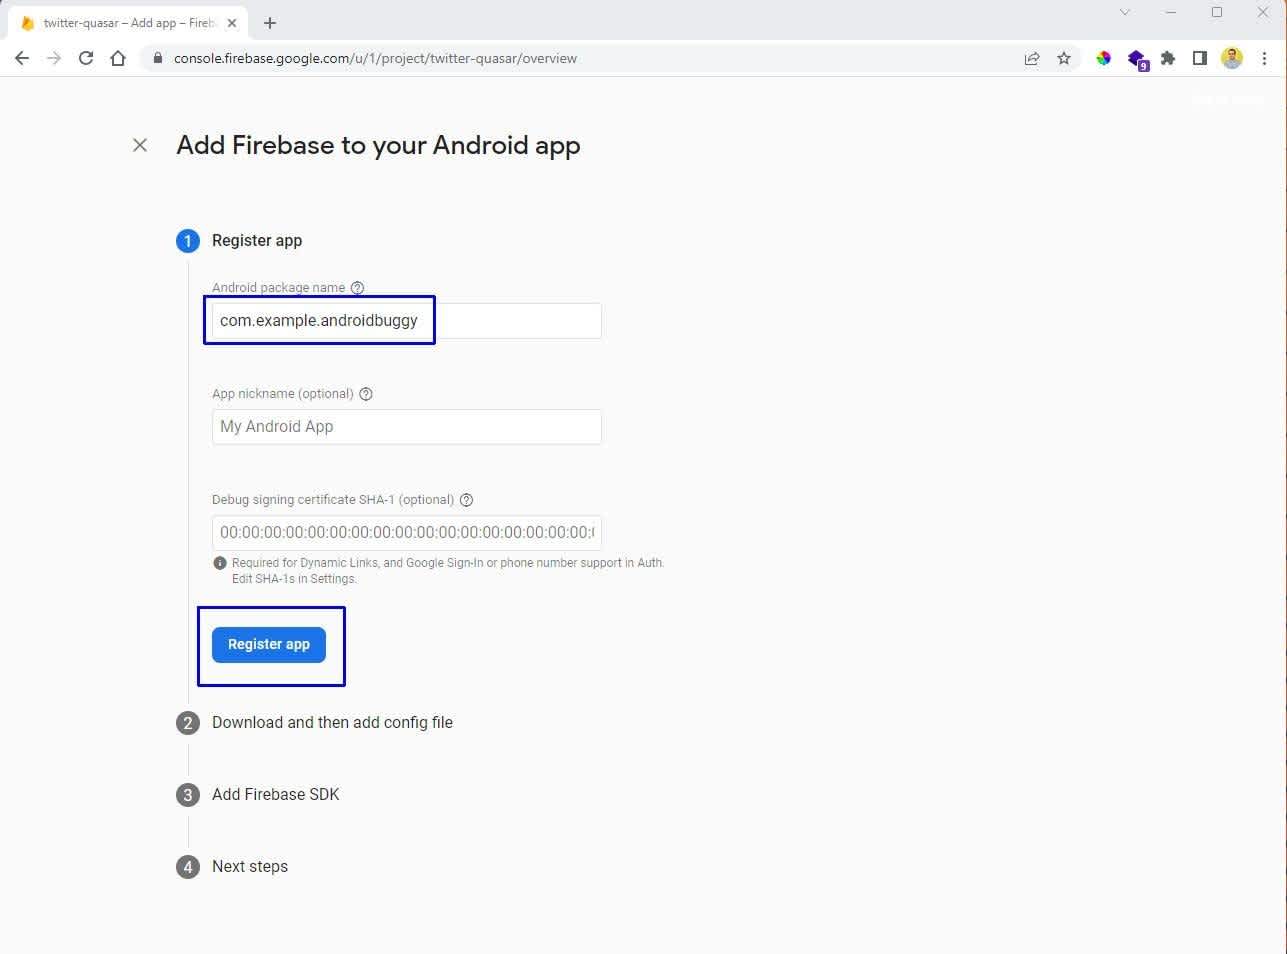
Next, we need to register the app. Here, in the Android package name, give the exact name of the Android app created earlier. Then click on the Register app button.
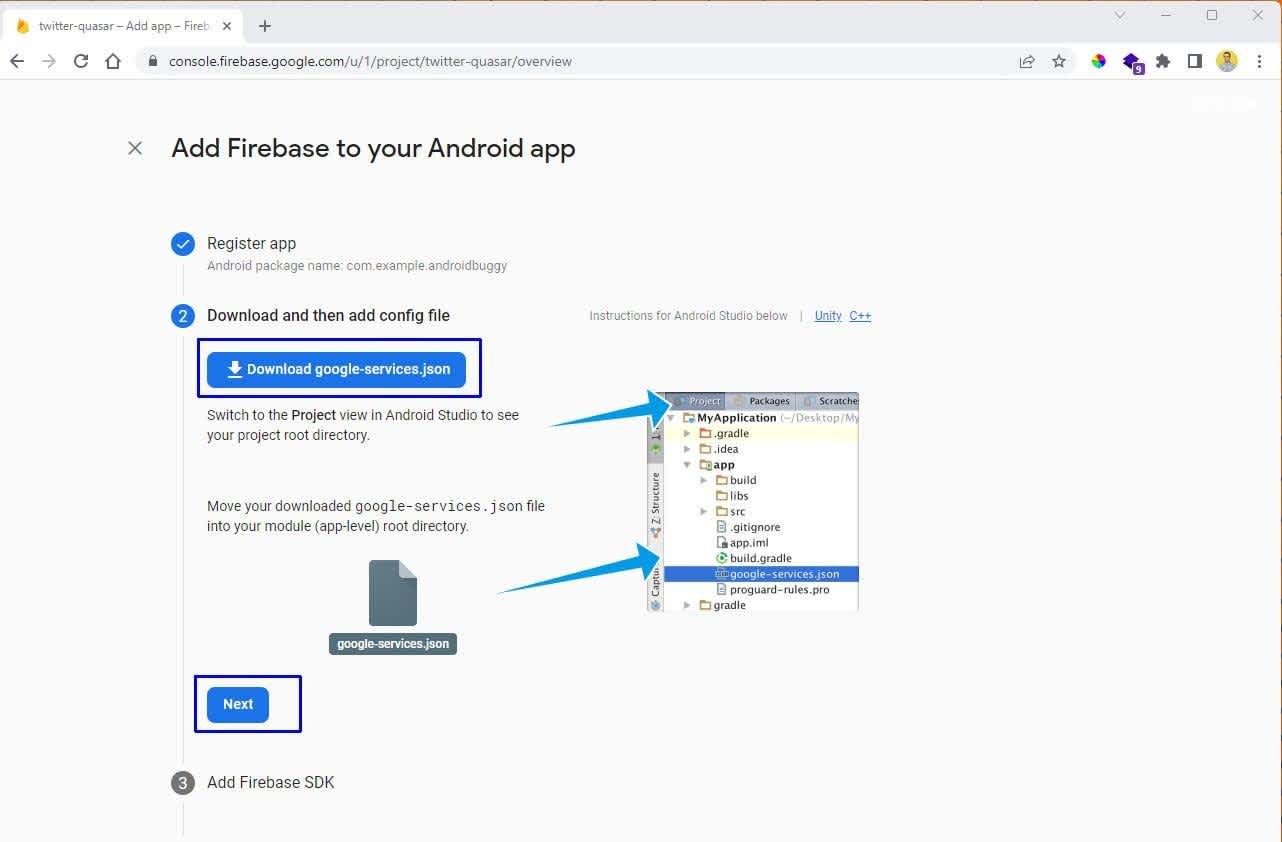
Click on Download google-services.json and it will download the file. Then click on the Next button.
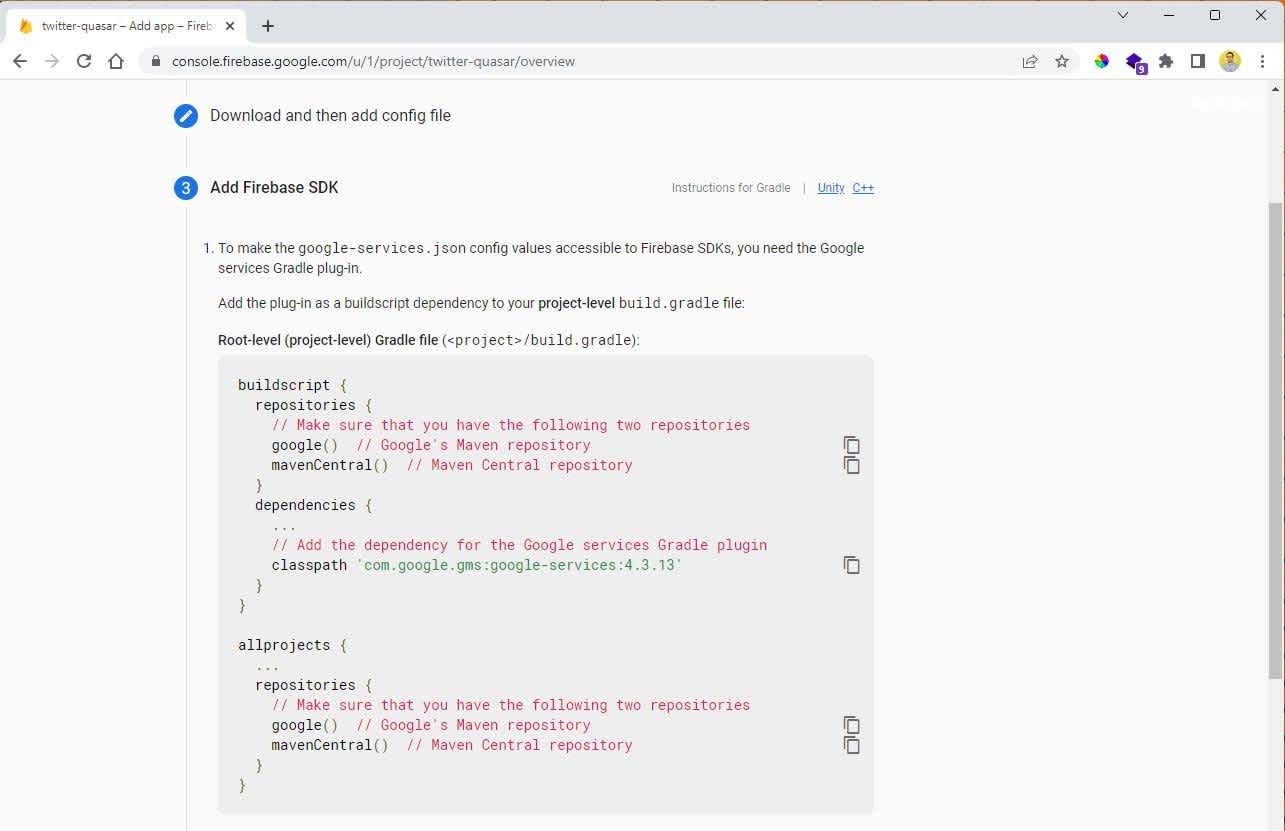
Now it will give us instructions to add dependencies in build.gradle files. Scroll down and click on the Next button.
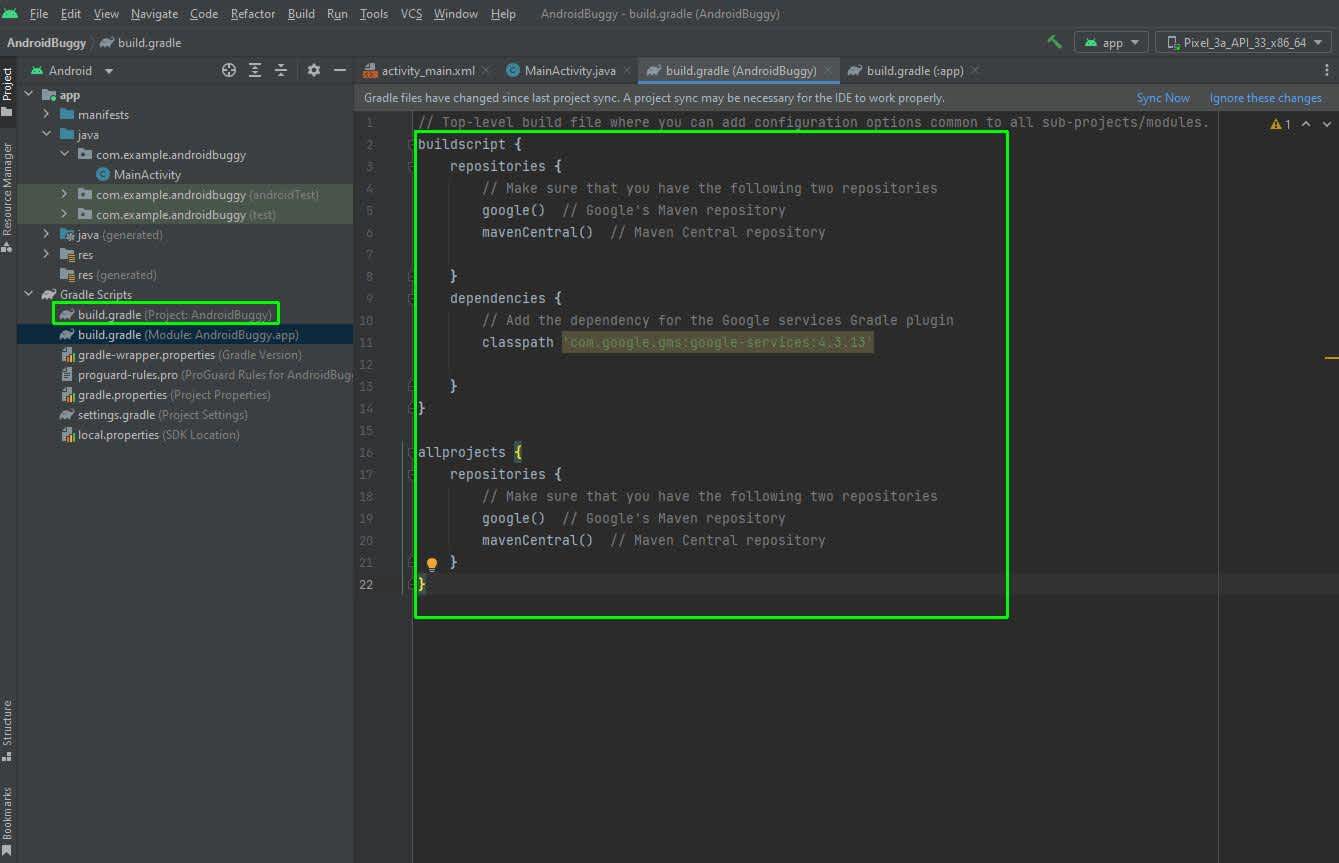
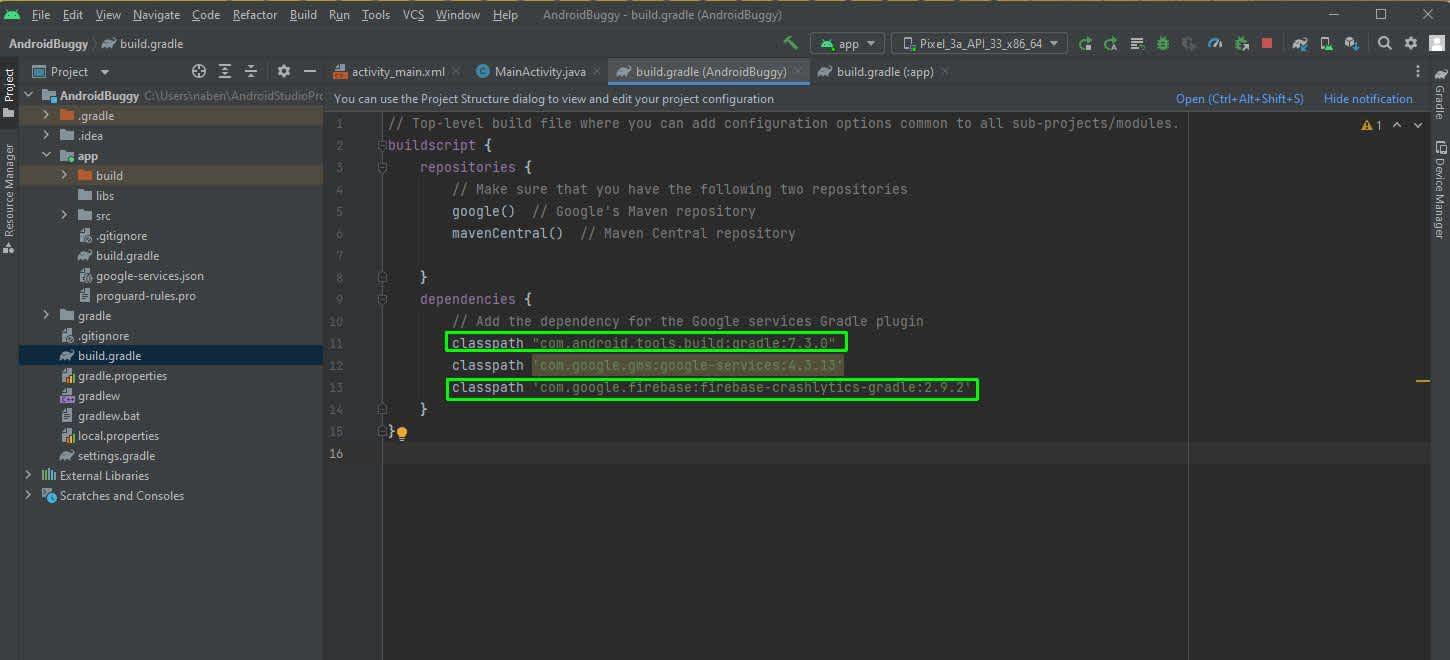
Go into the root build.gradle file in Android Studio and add the dependencies.
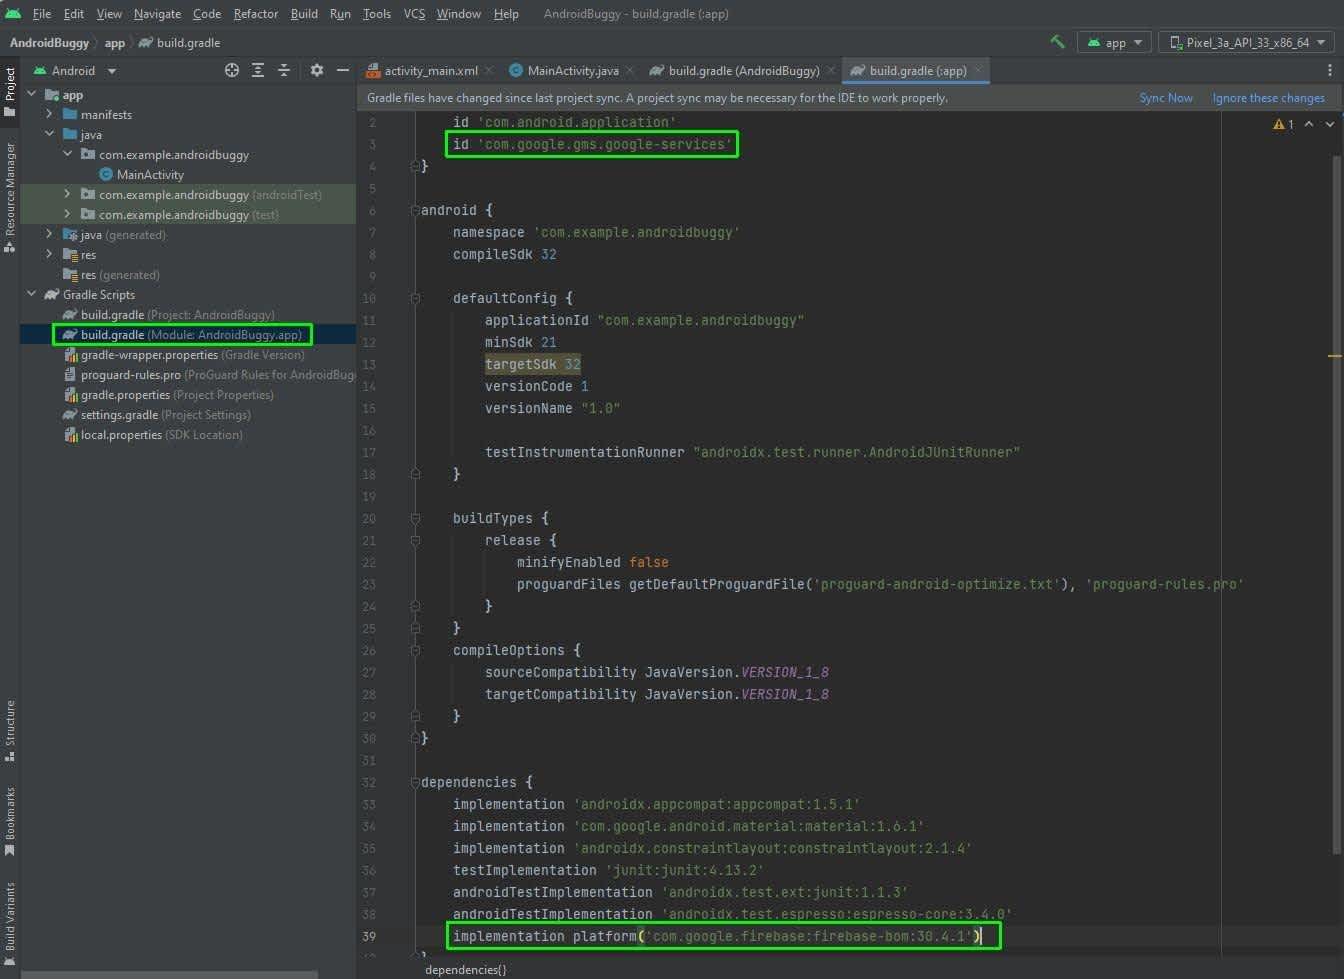
We also need to add dependencies in the module build.gradle file in Android Studio.
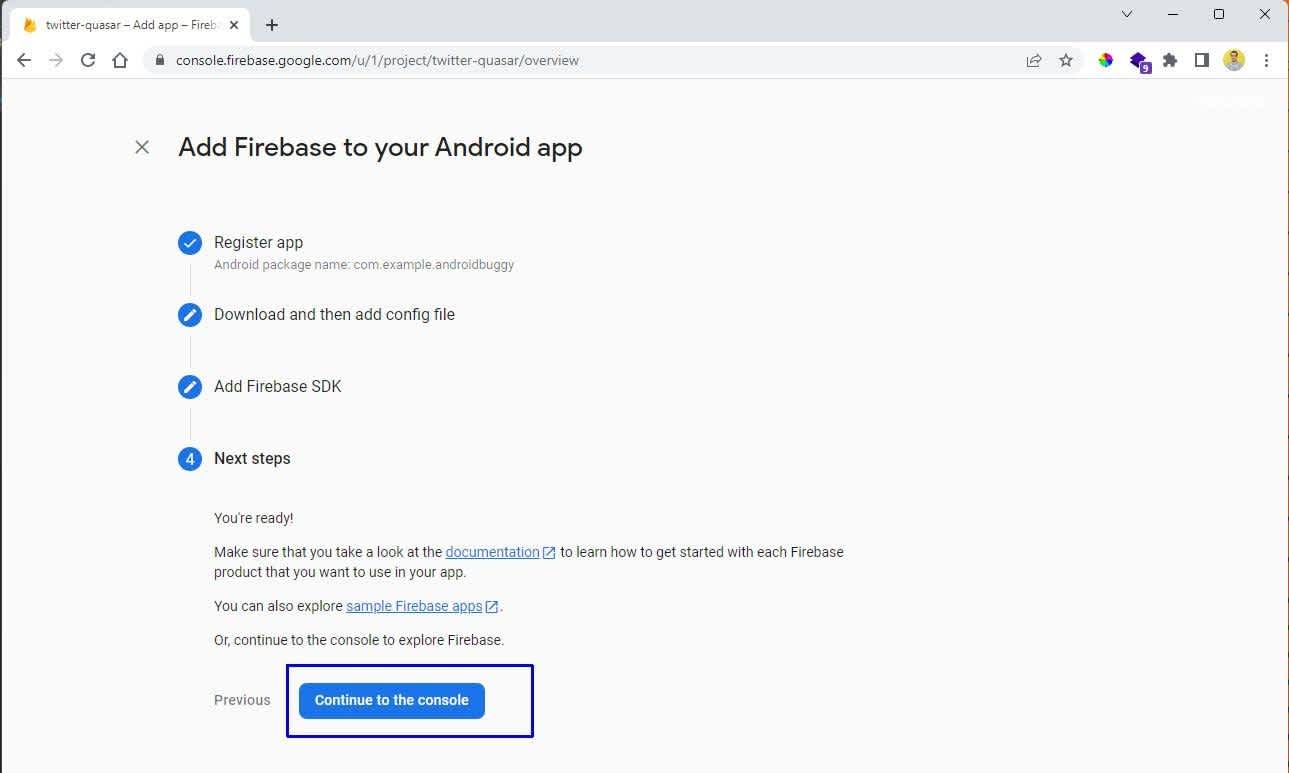
Back in Firebase, click Continue to get to the console button.
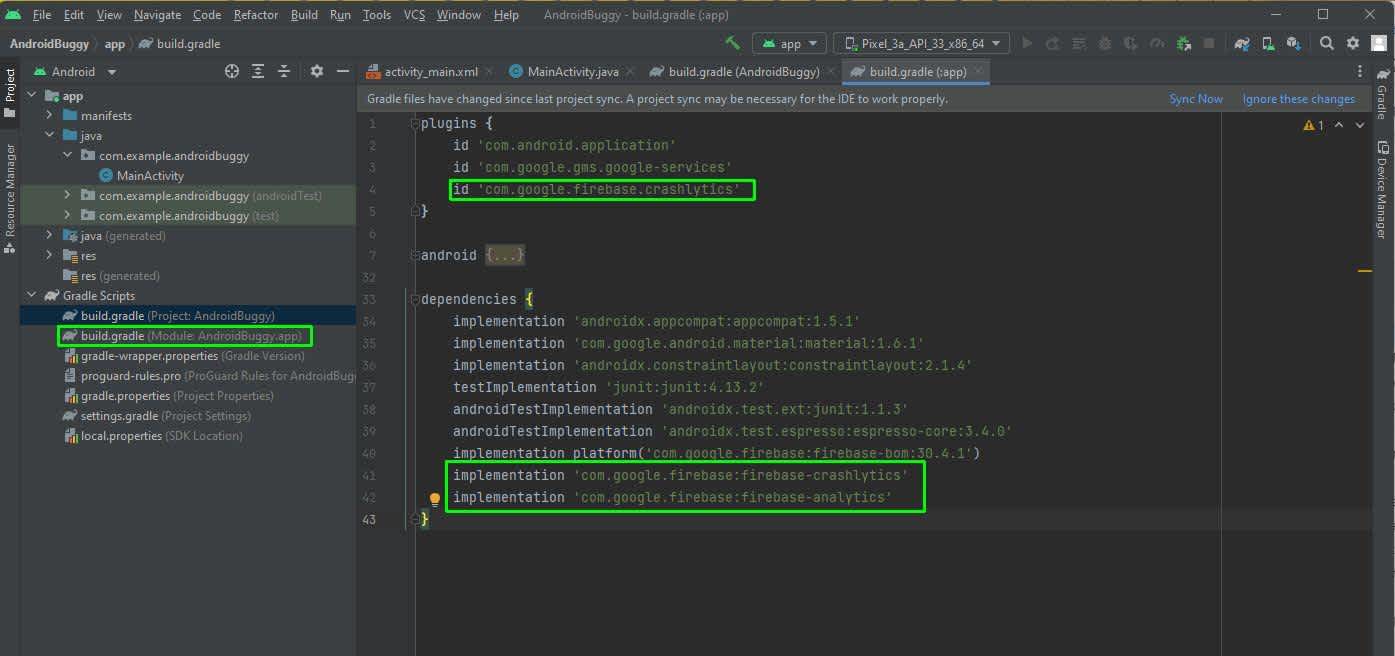
According to official Firebase Crashlytics documentation, we need to add some more dependencies and plugins in the module build.gradle file.
We also need to add more dependencies in the root build.gradle file as shown below.
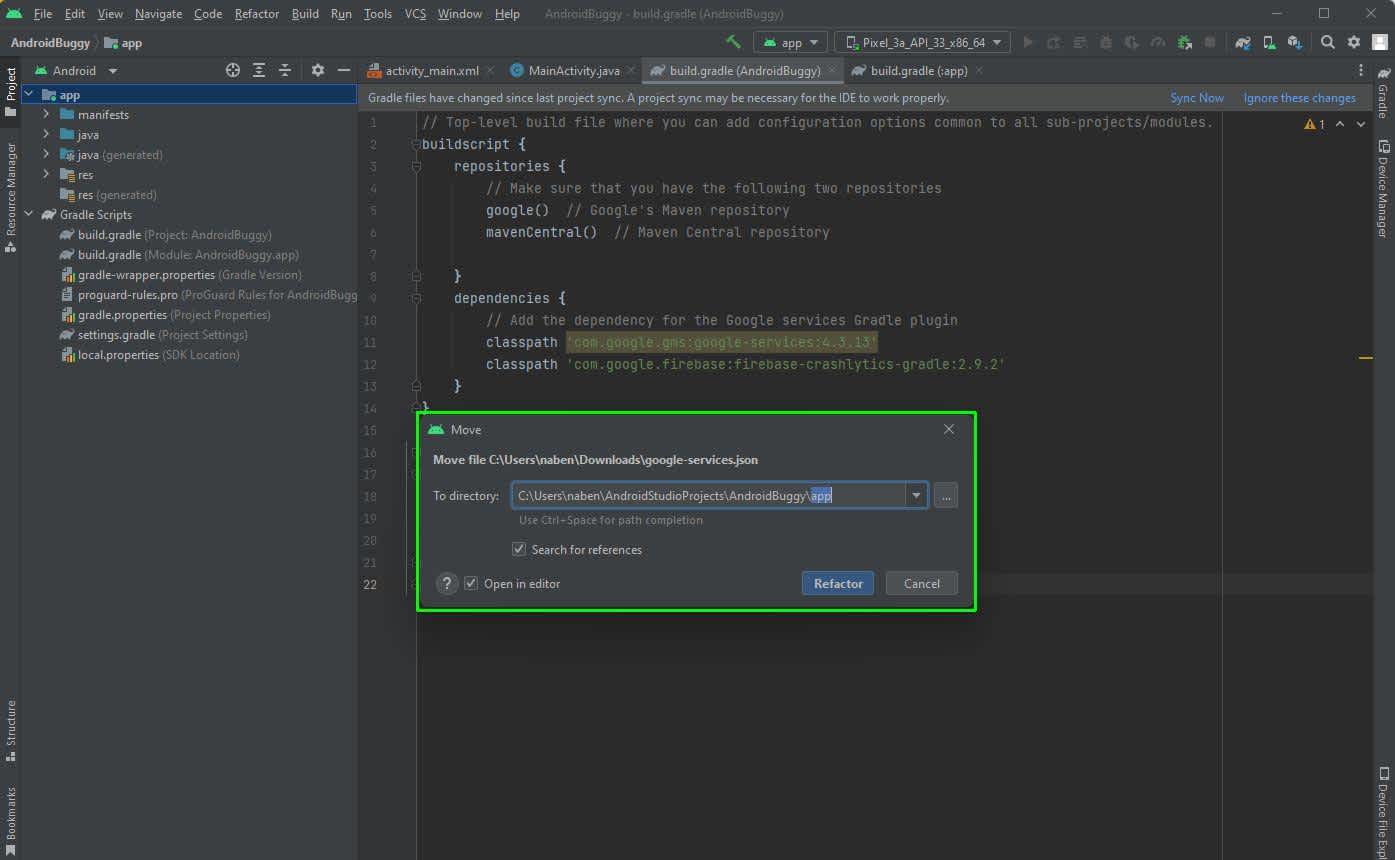
Next, the downloaded google-services.json file needs to be added in the app folder.
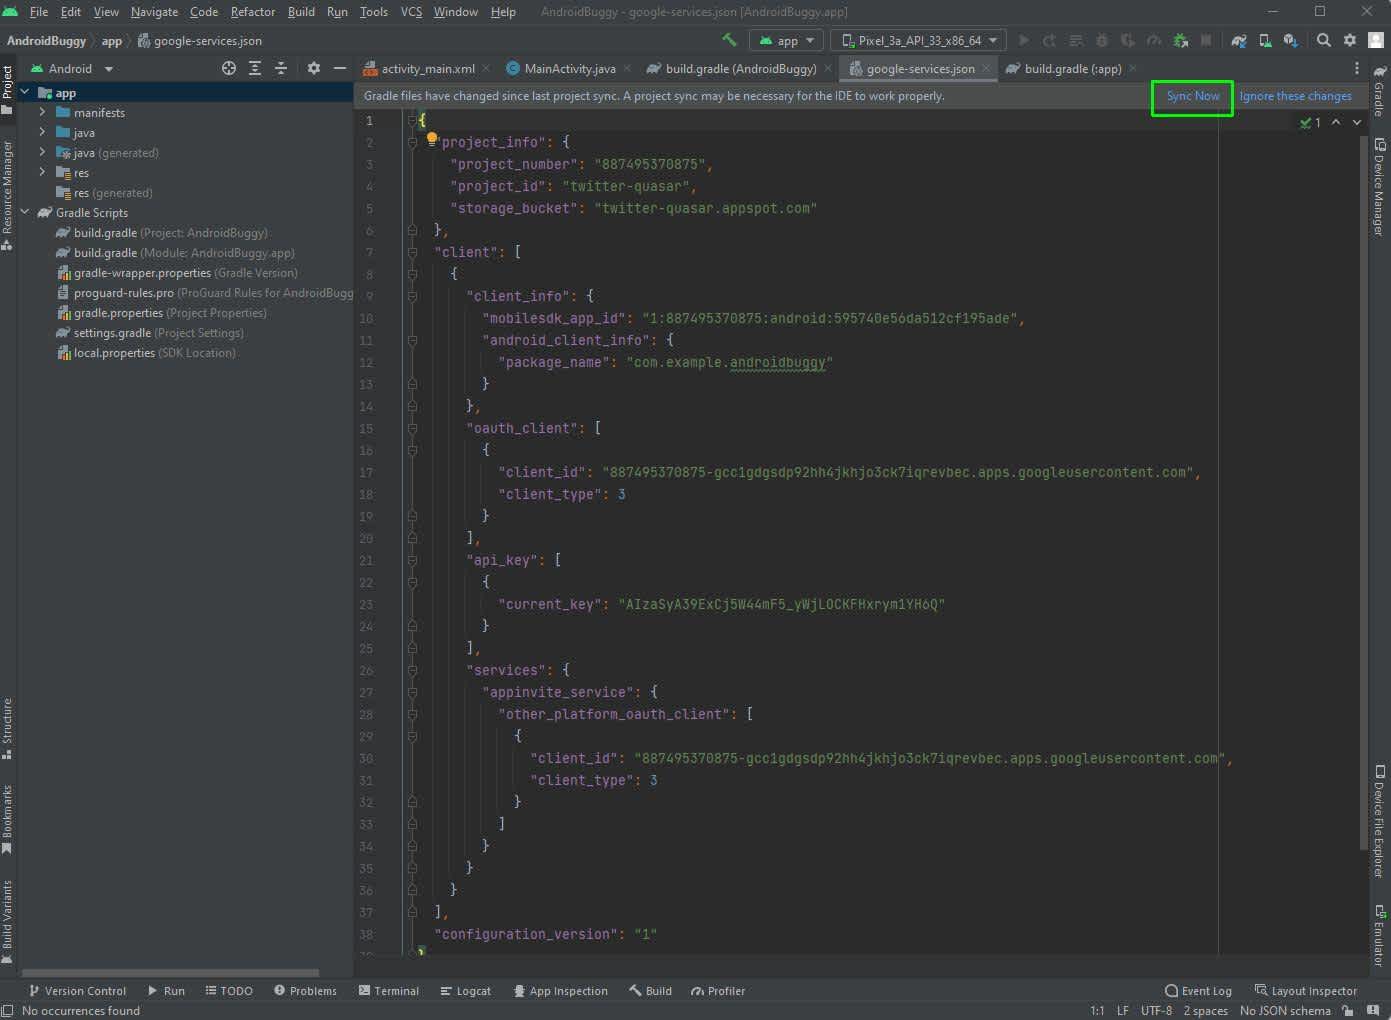
The project will ask us to sync. Click on the Sync Now link on the top right corner.
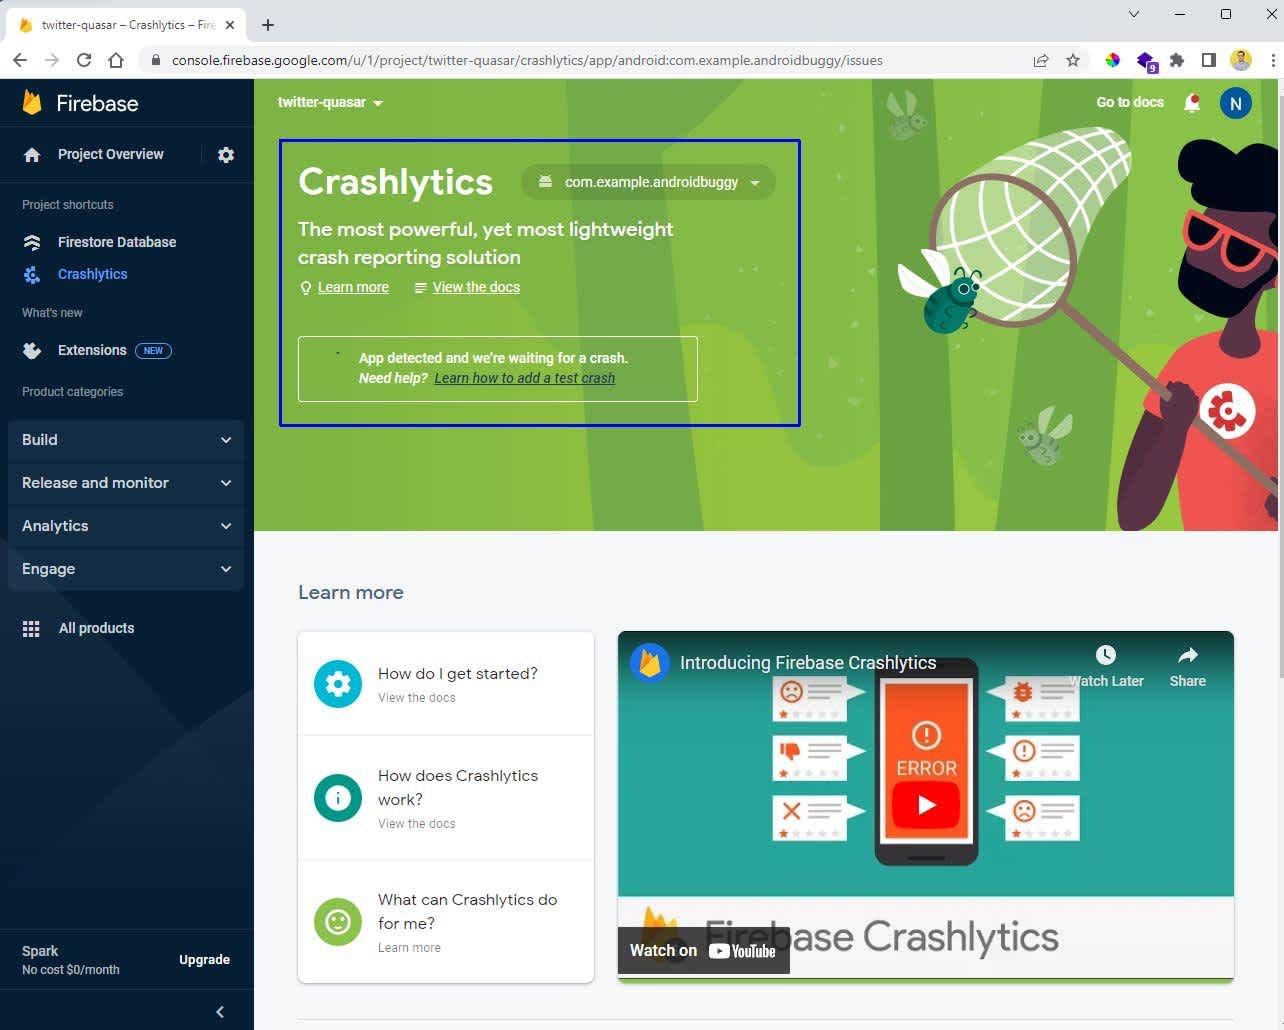
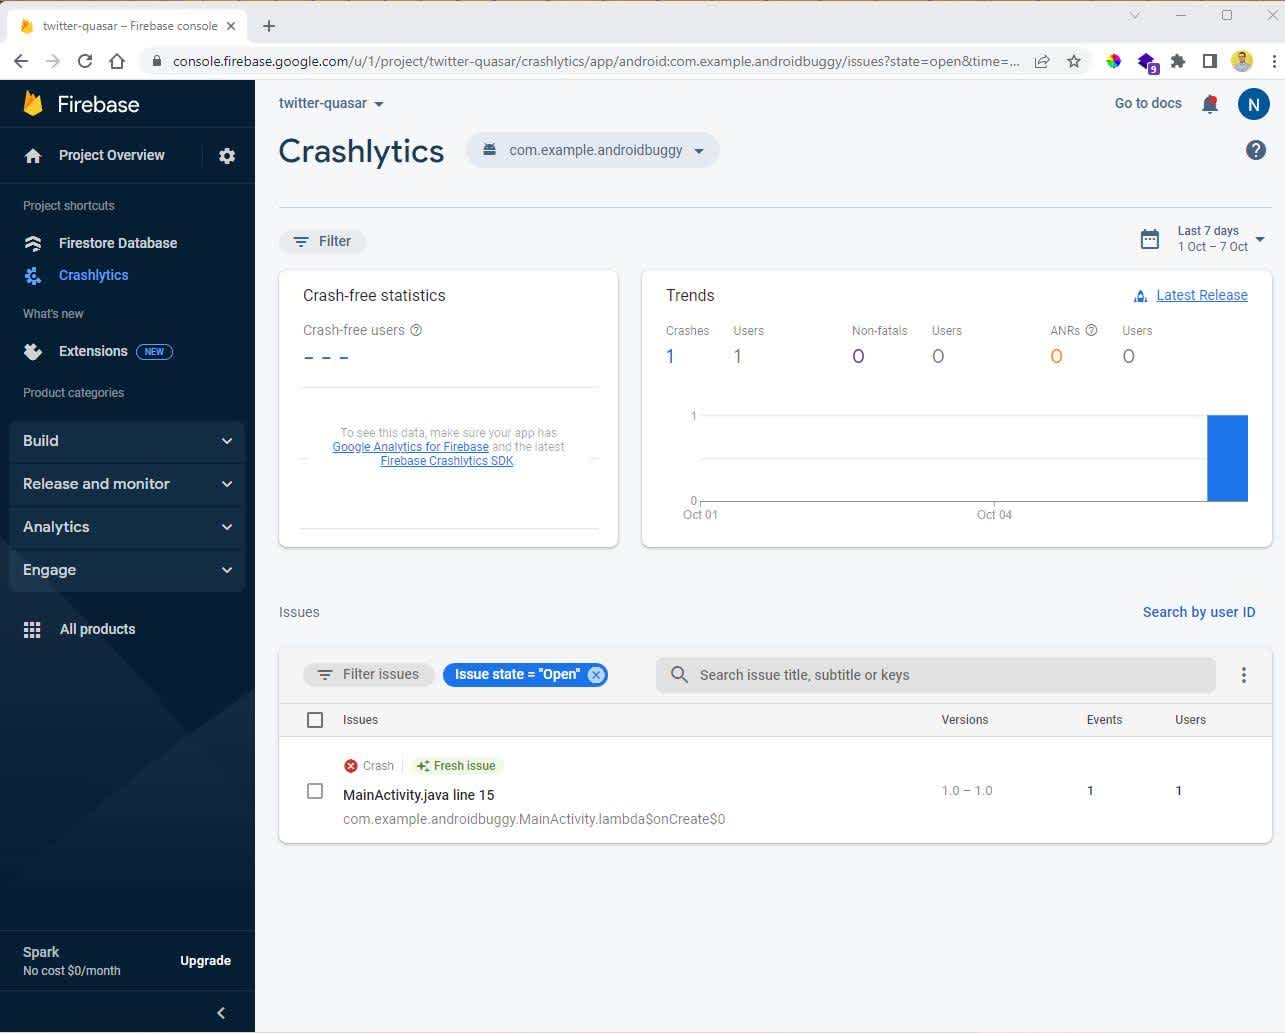
Now, in the Firebase Console, go to Release and monitor and then click on Crashlytics. Here, you will see that the app has been detected and is waiting for a crash.
Restart the app and click on the Crash App button.
Firebase will show us the error with a lot of other metrics. Click on the displayed error.
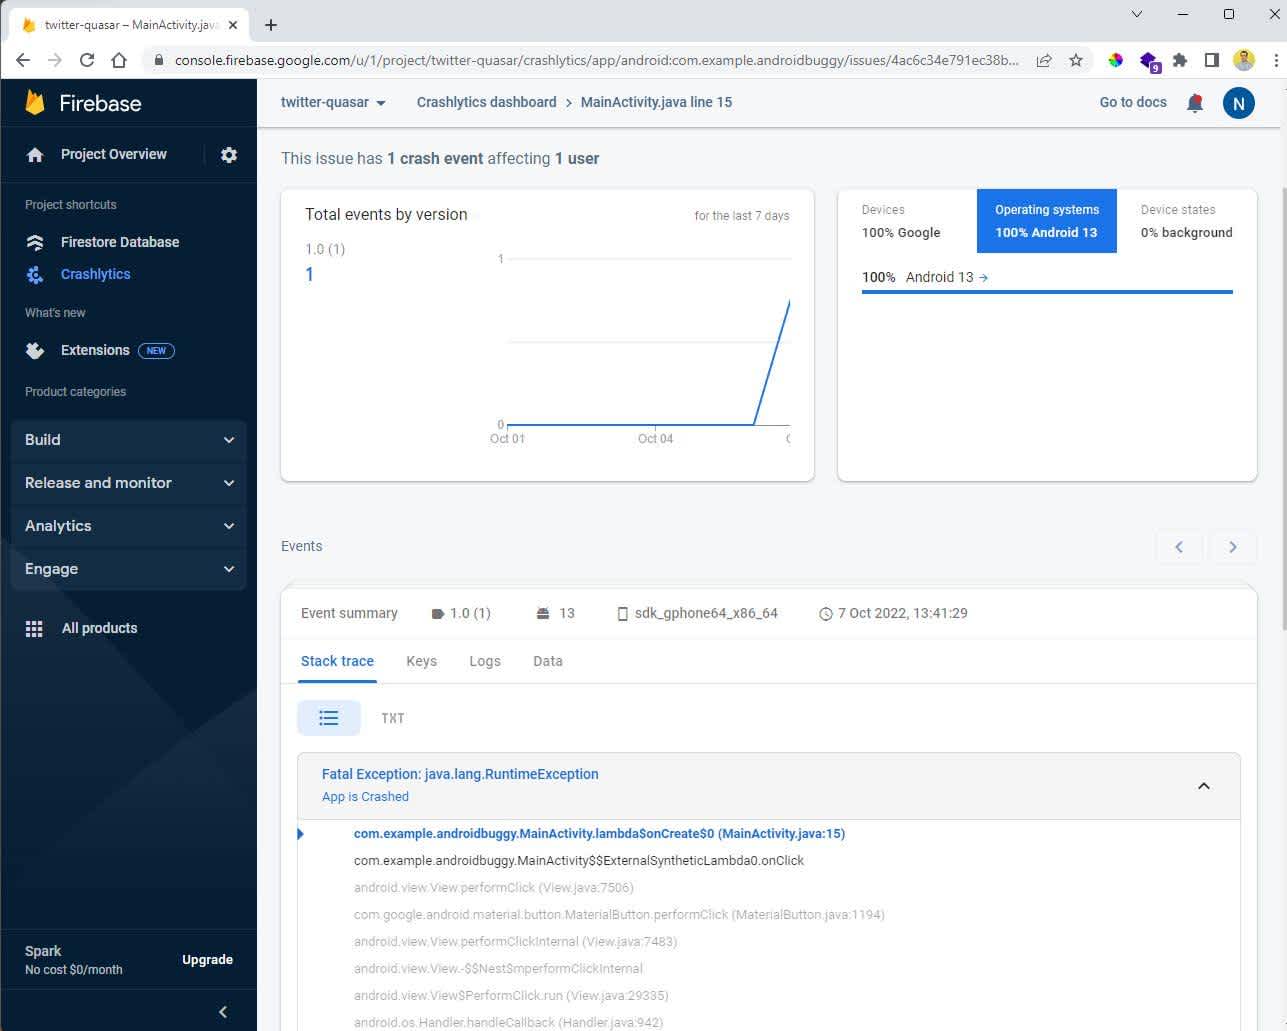
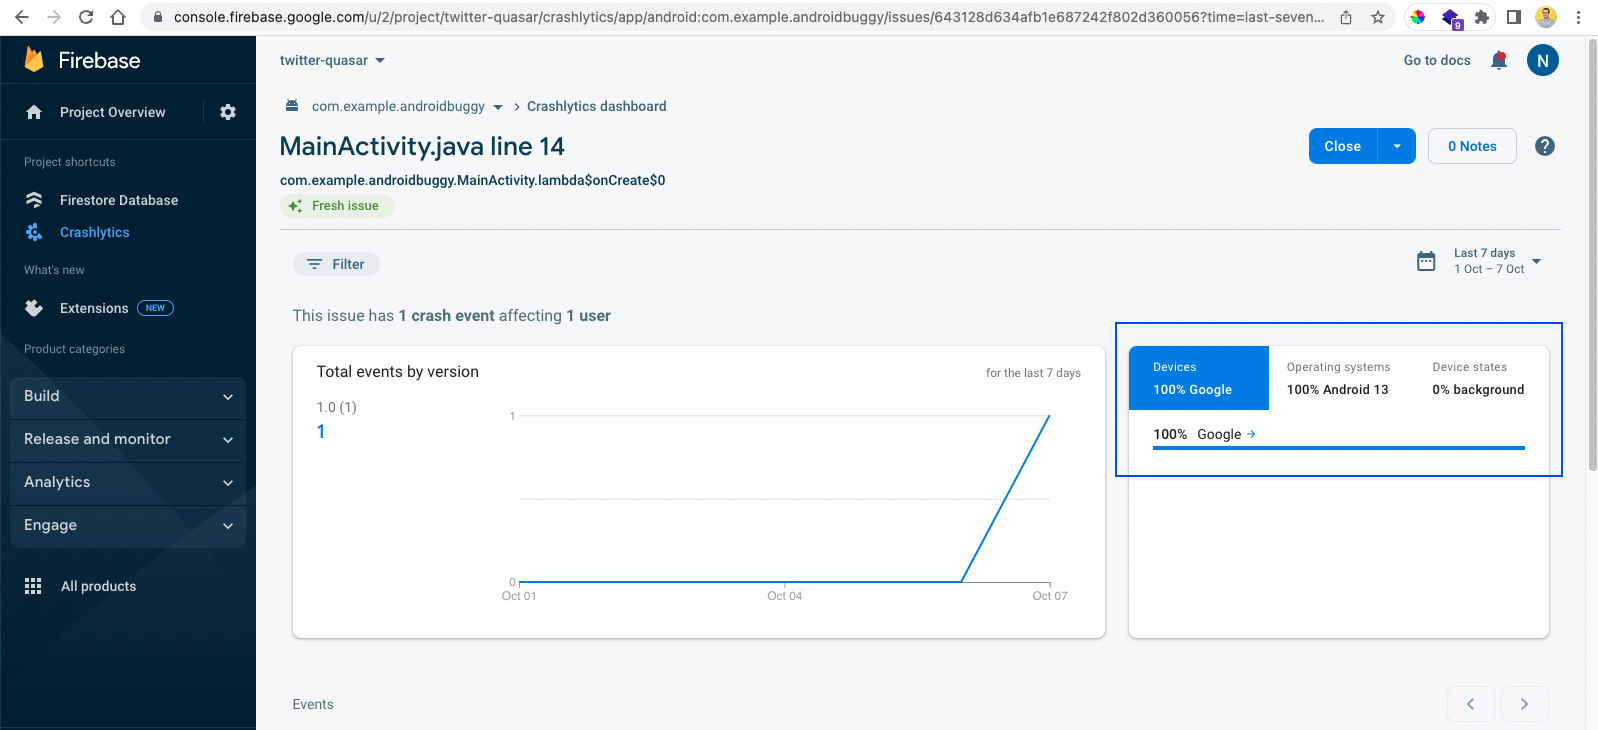
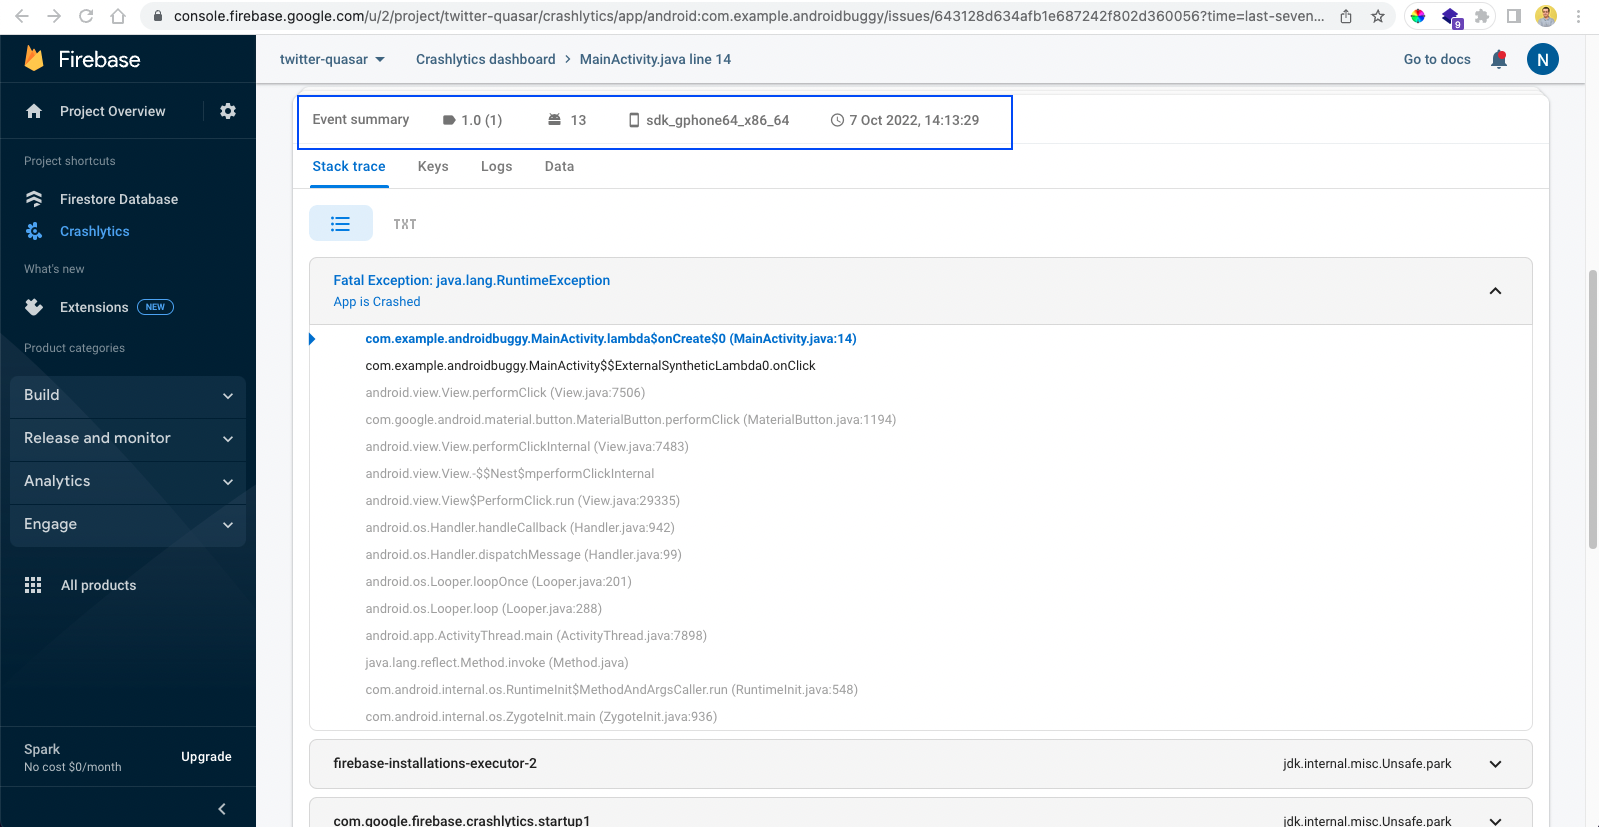
Here, we will see details of the error and other meta data. We see the connected phone model number, which in our case is an emulator. And we also see the time at which the error was generated.
The operating system on which we got the error is also shown (in our case it is Android Version 13). This is particularly useful, as older versions of Android run on a lot of phones. And sometimes, we get errors on those phones.
We also get a nice graph showing the number of errors, which is low in our example app. In the case of more scaled production apps, it will be much higher.
As we have seen in the last two screenshots, Crashlytics provides a lot of metrics, from the number of crashes and the number of users, phone model, OS version, the specific device name (with details and logs), and more.
What's more, Firebase will continuously monitor our application, including the deployed production app in the Google Play Store.
Mobile Crash Reporting using Sentry
Now let's look into another cloud-based tool for mobile app crash reporting: Sentry. Sentry's setup was very straight-forward and less involved compared to Crashlytics.
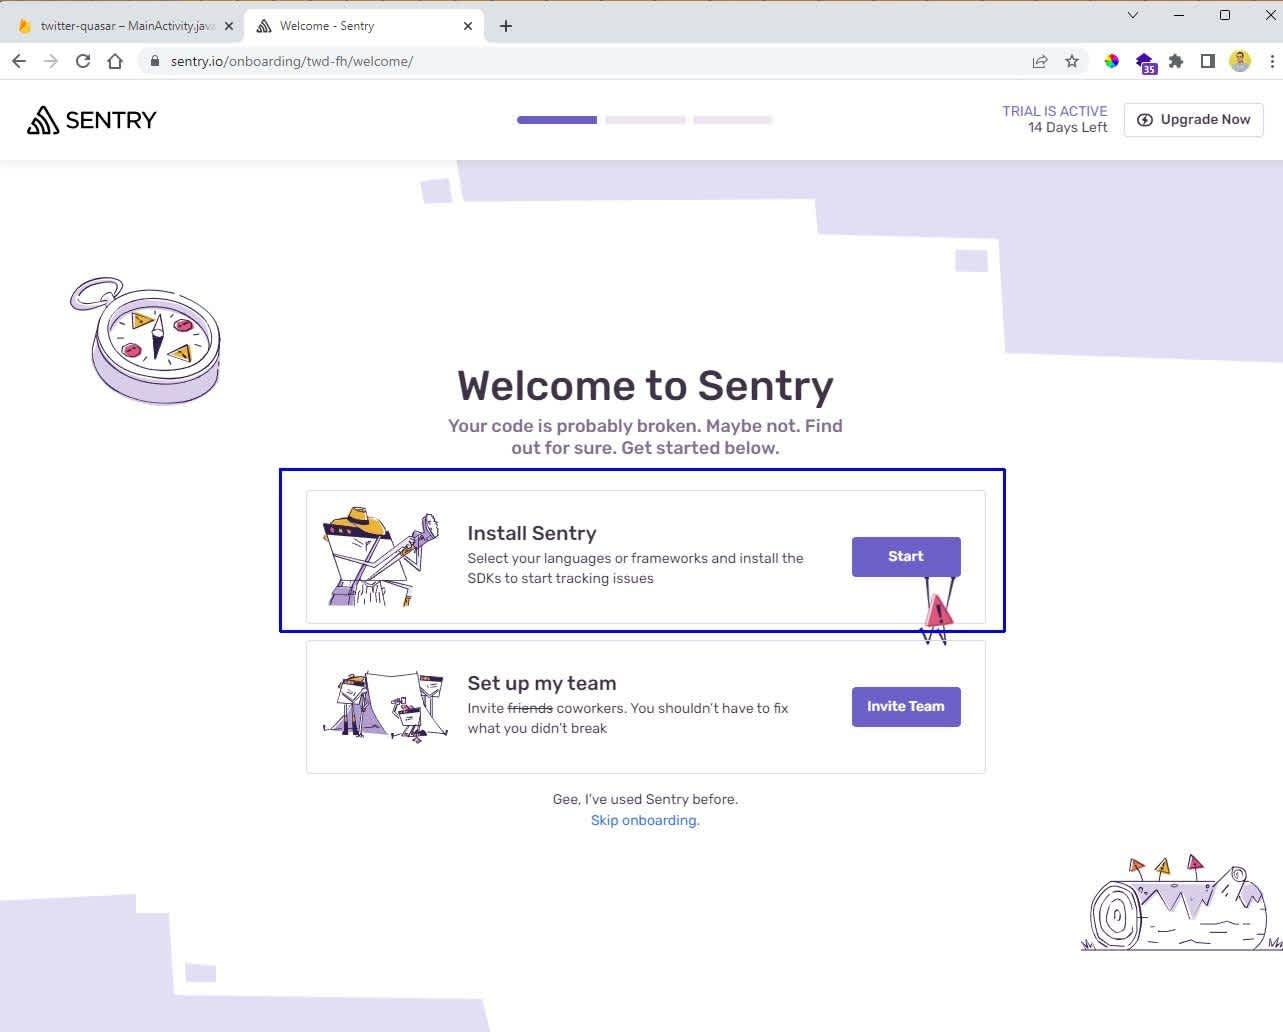
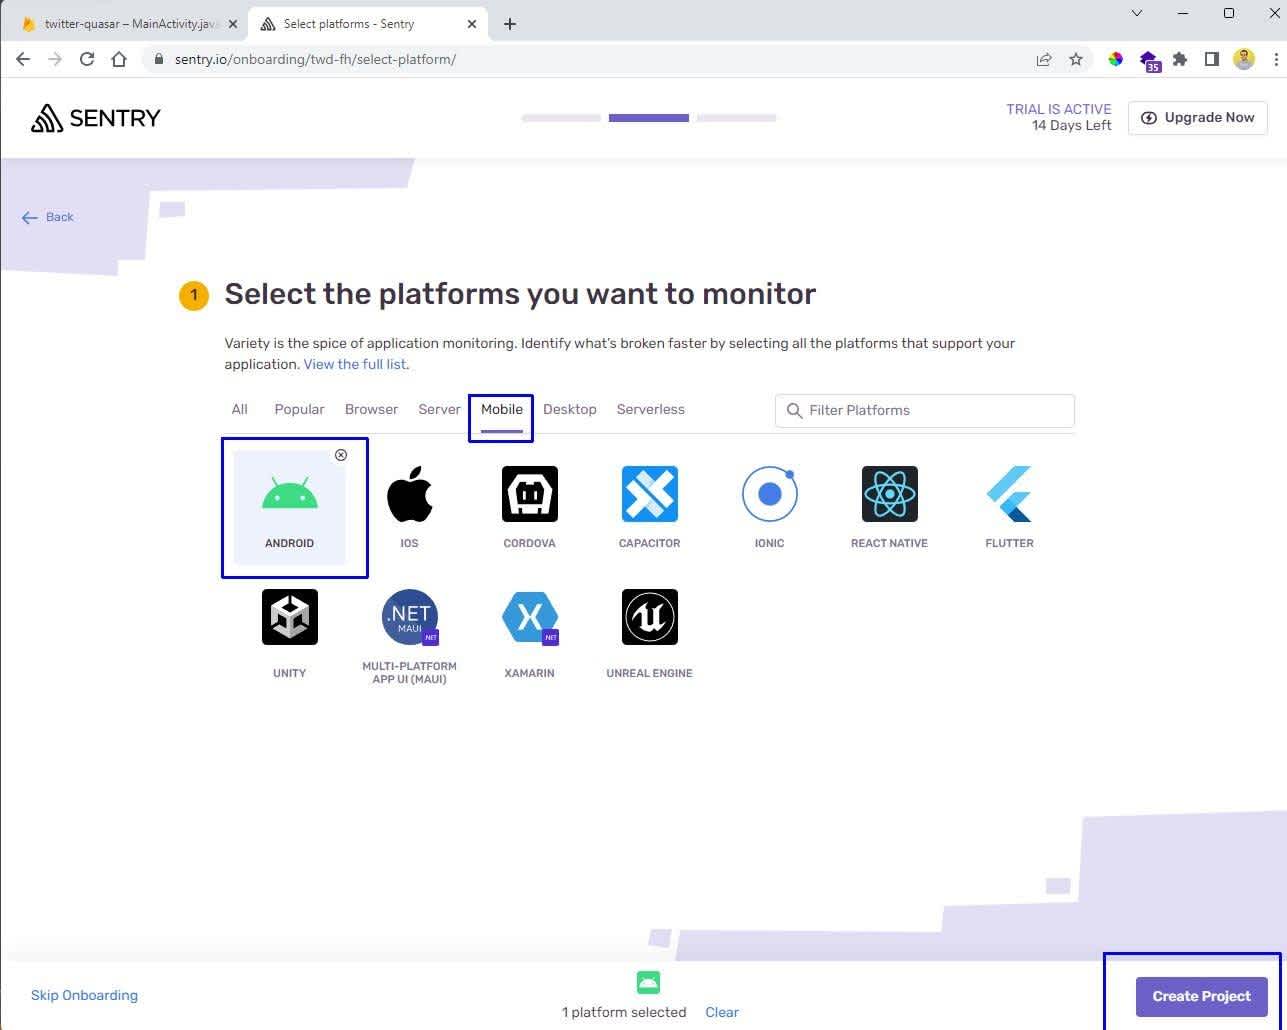
After you create a Sentry account, you'll be on your way to setup. Sentry supports nearly every major language and framework. We'll want to setup an Android project.
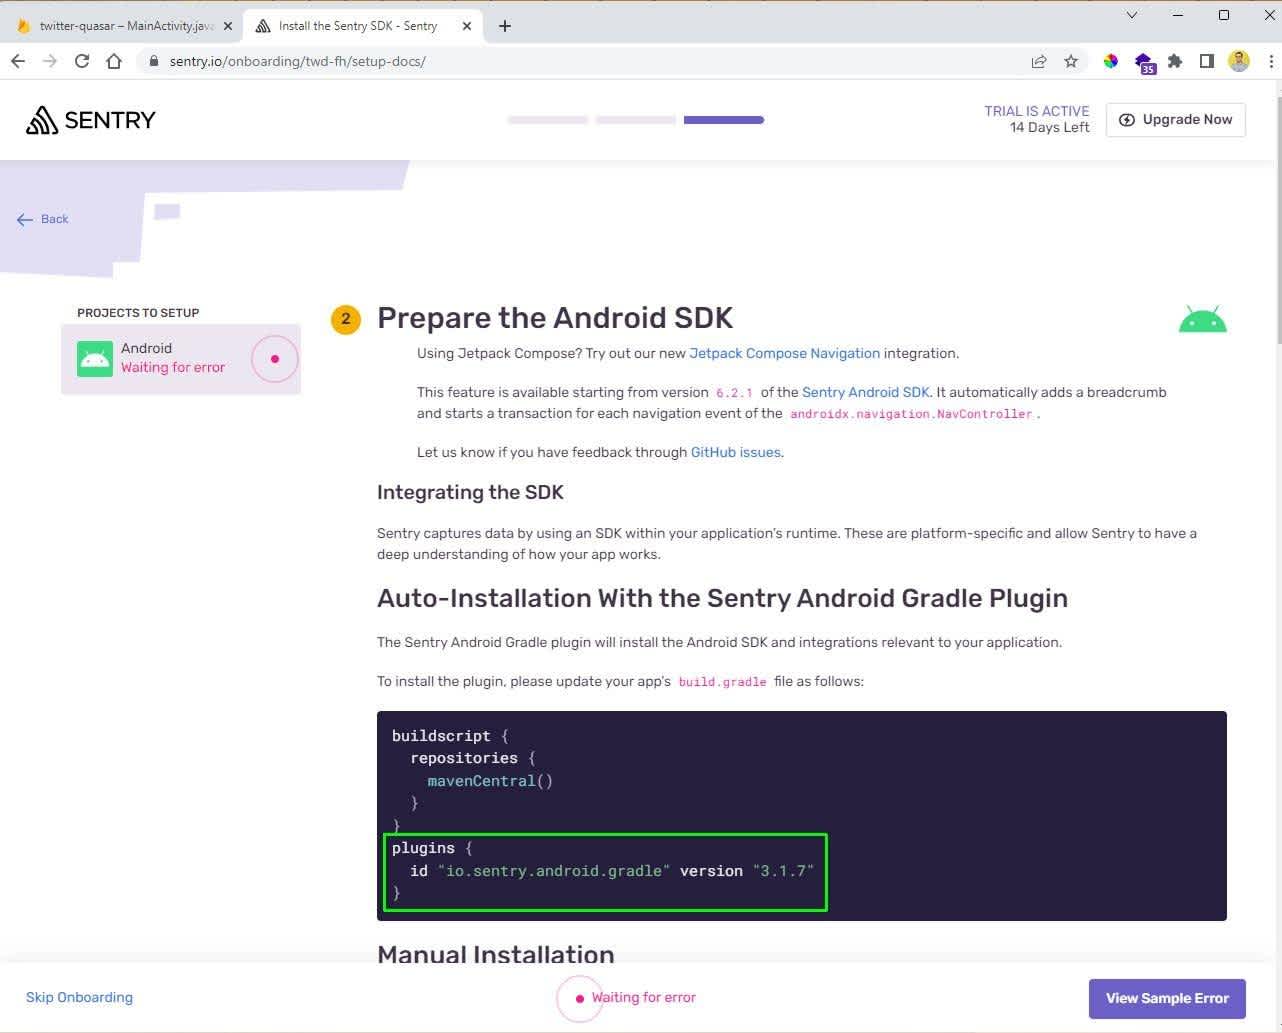
Next, we'll get instructions to add dependencies in our application.
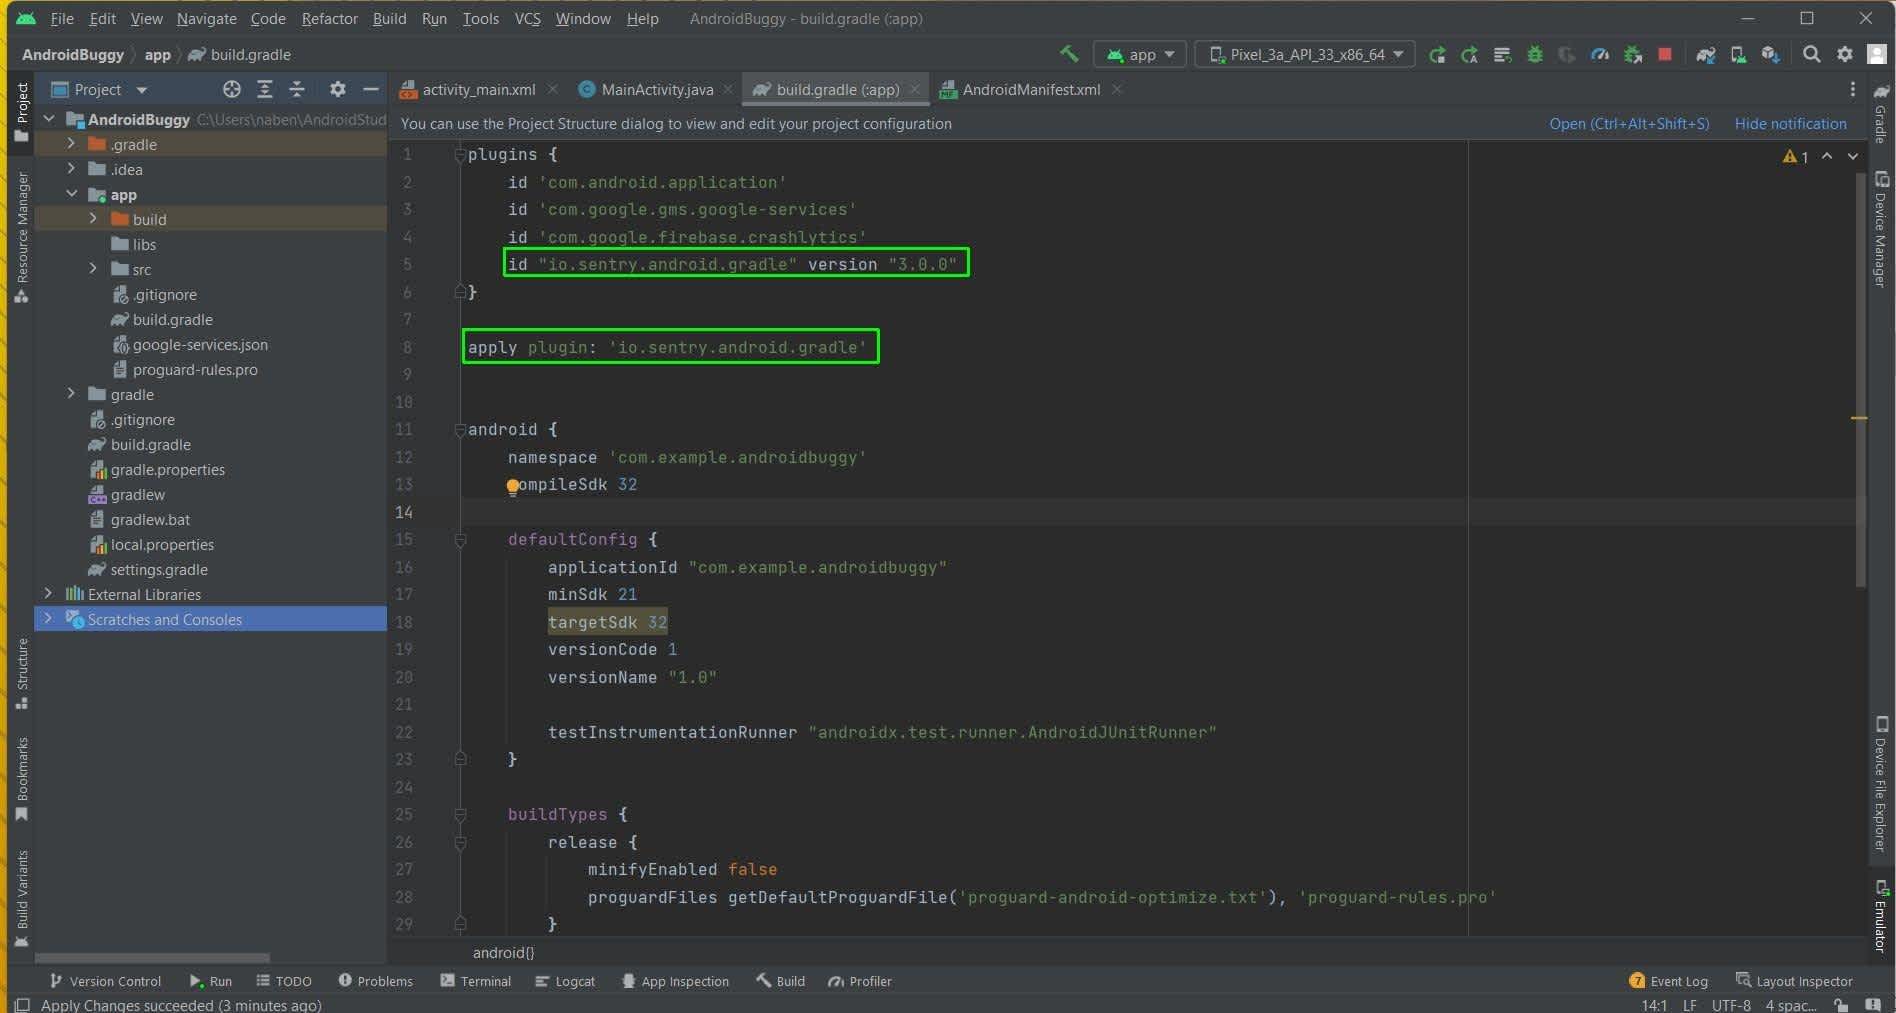
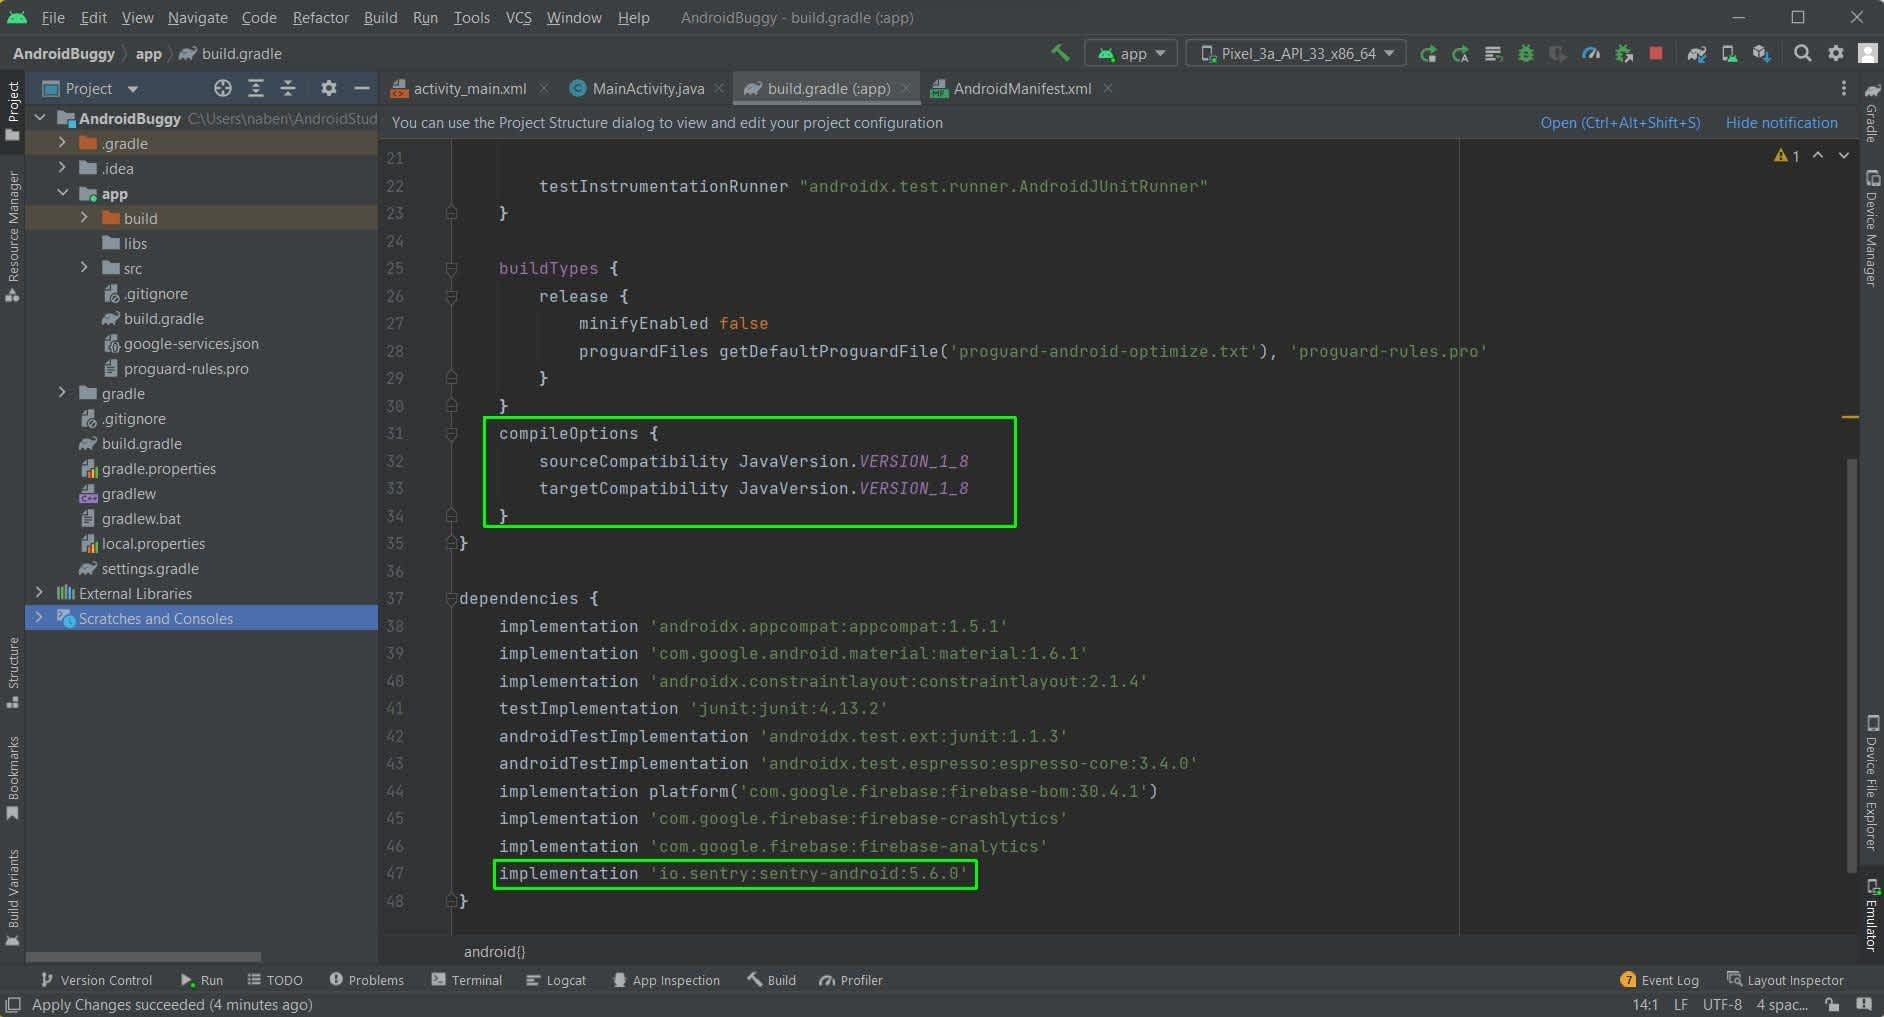
Back in the module build.gradle file in Android Studio, we need to add a plugin for Sentry.
We'll also add the implementation and compileOptions in the build.grade file.
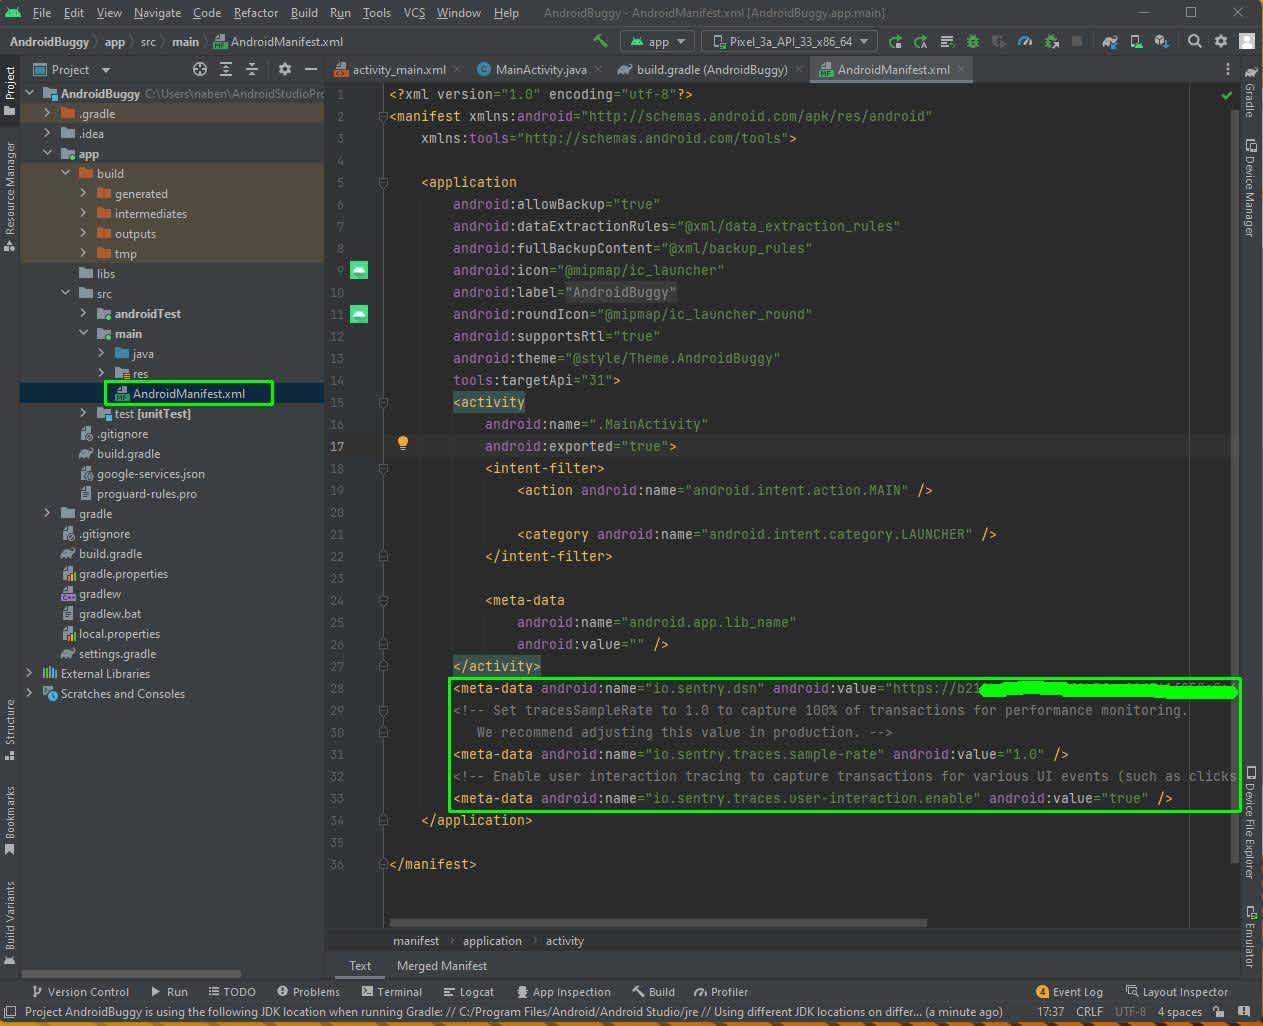
Now, we'll add the meta data containing our keys from Sentry docs in the AndroidManifest.xml file.
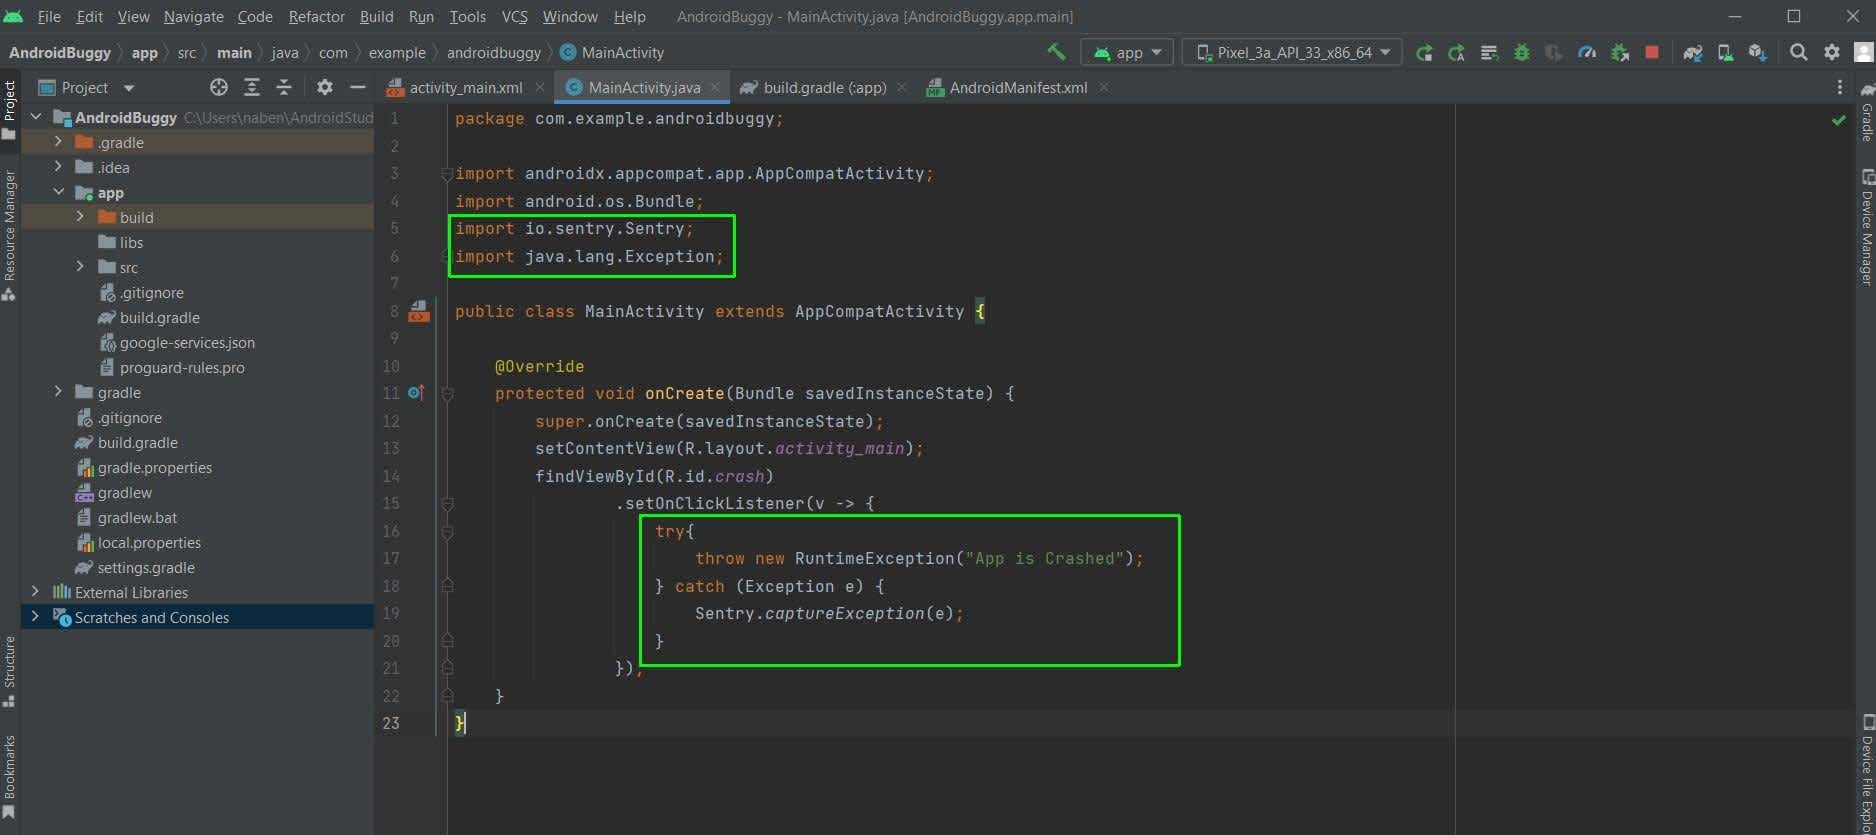
Finally, we will refactor our code in the MainActivity.java file. Here, we are importing Sentry and using it in a try...catch block.
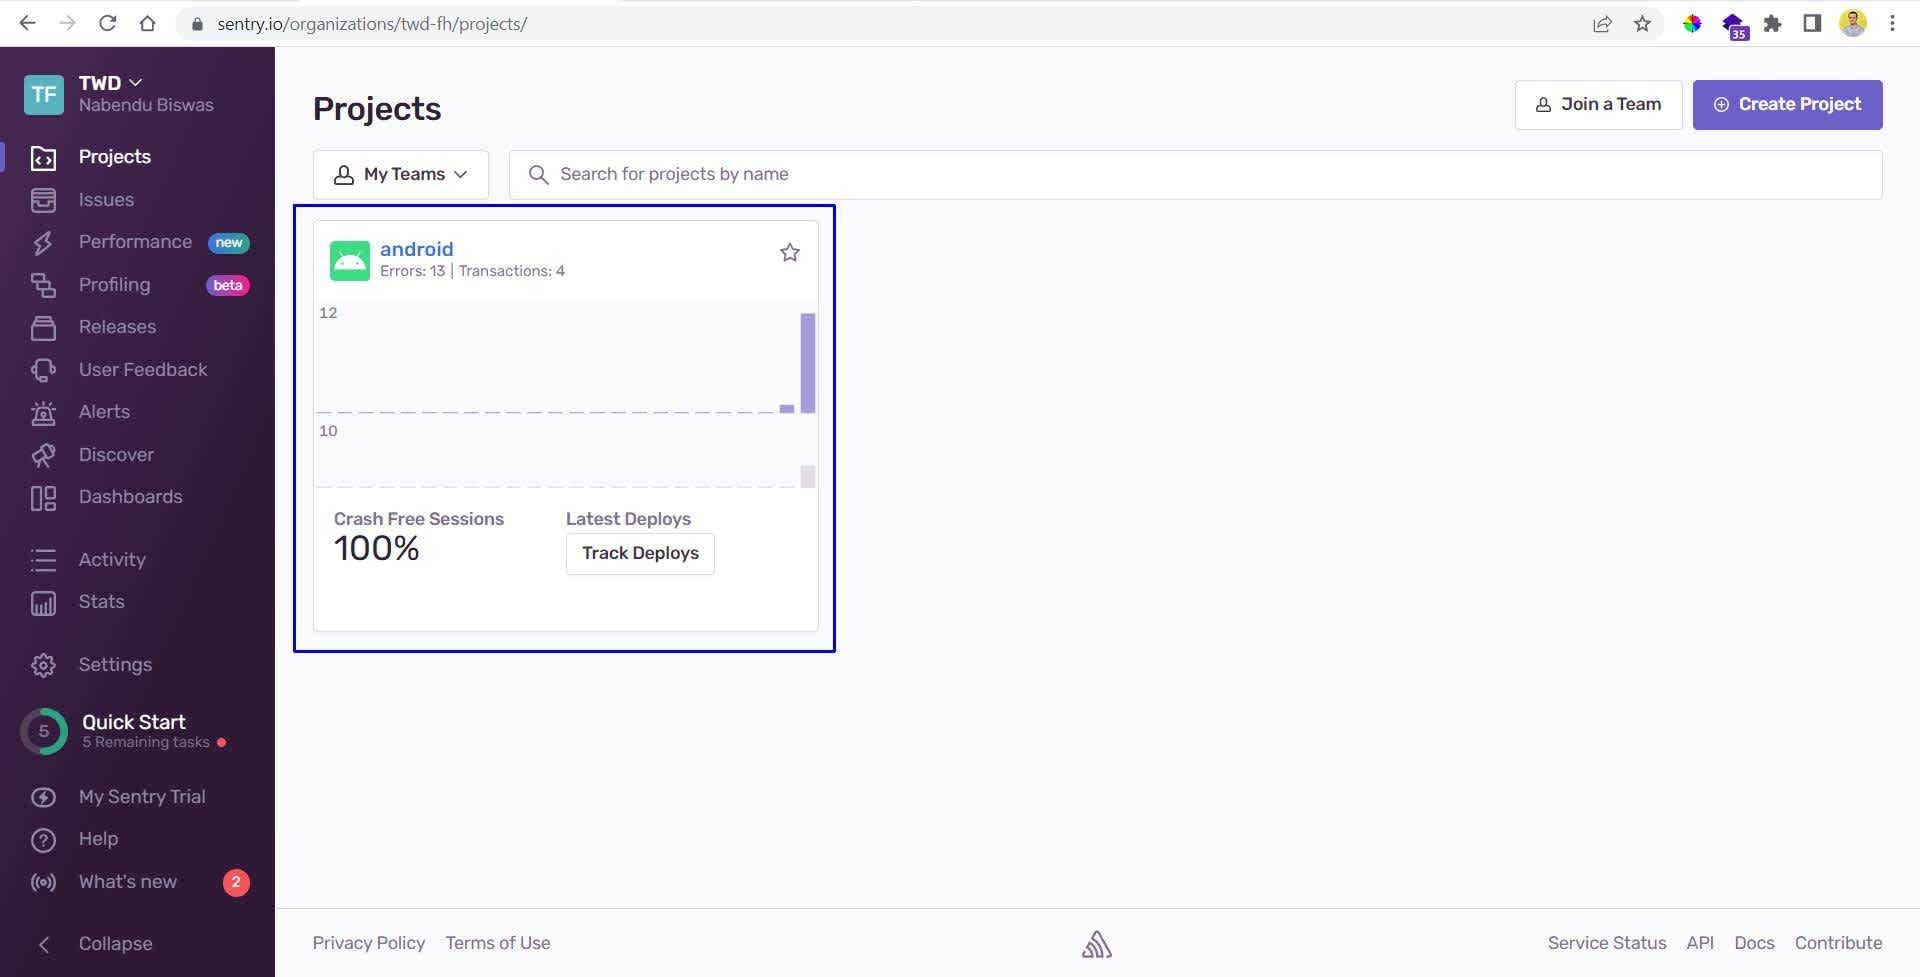
Jumping into Sentry, we'll see errors in our Android Project.
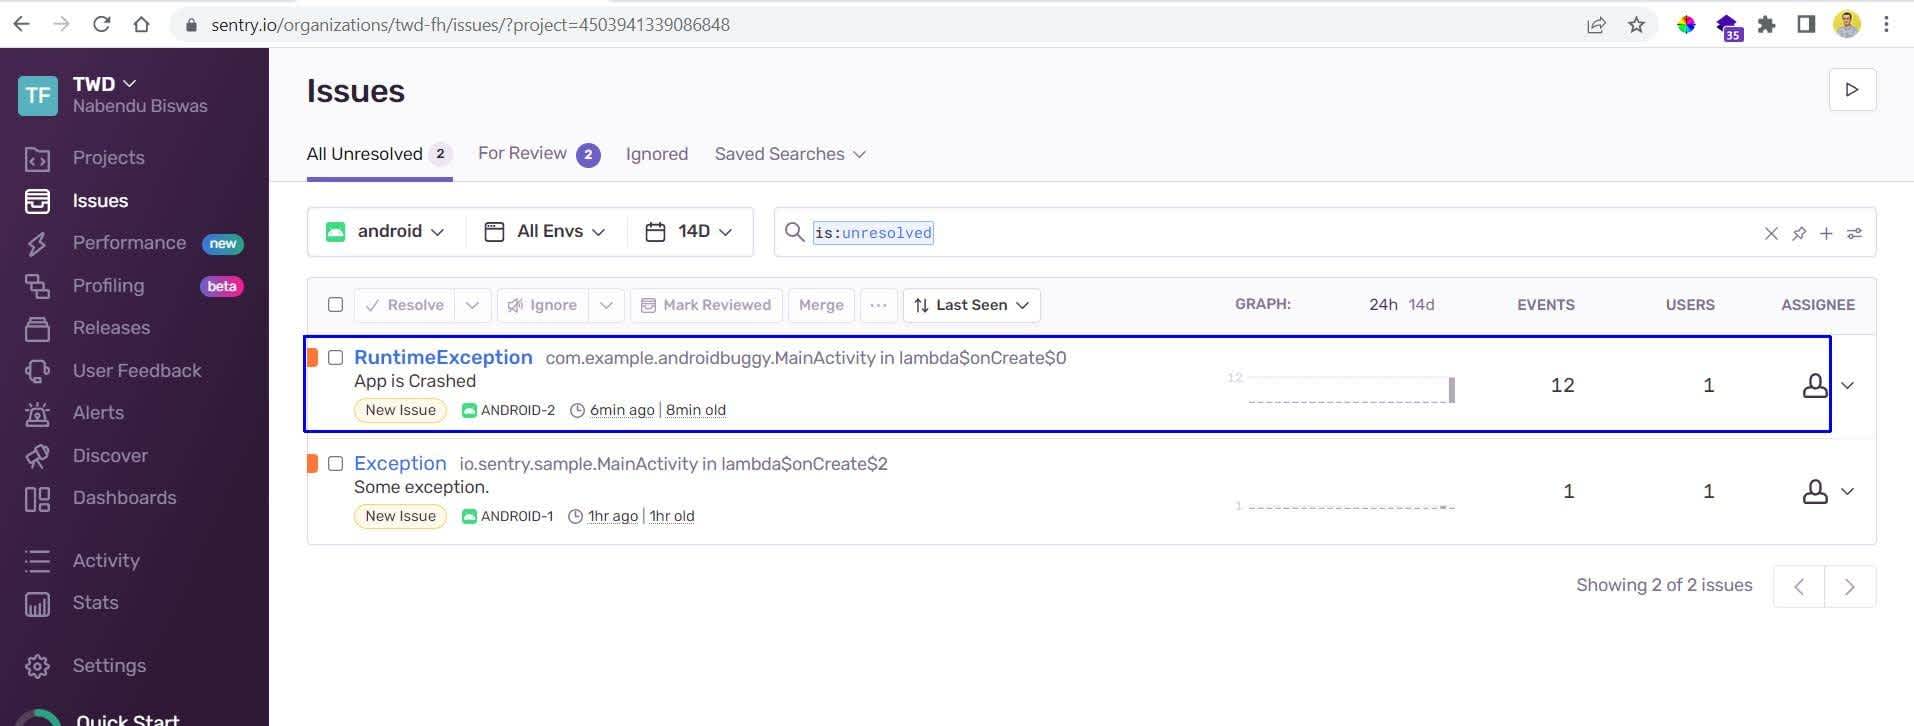
In the Issues tab, we can see our error.
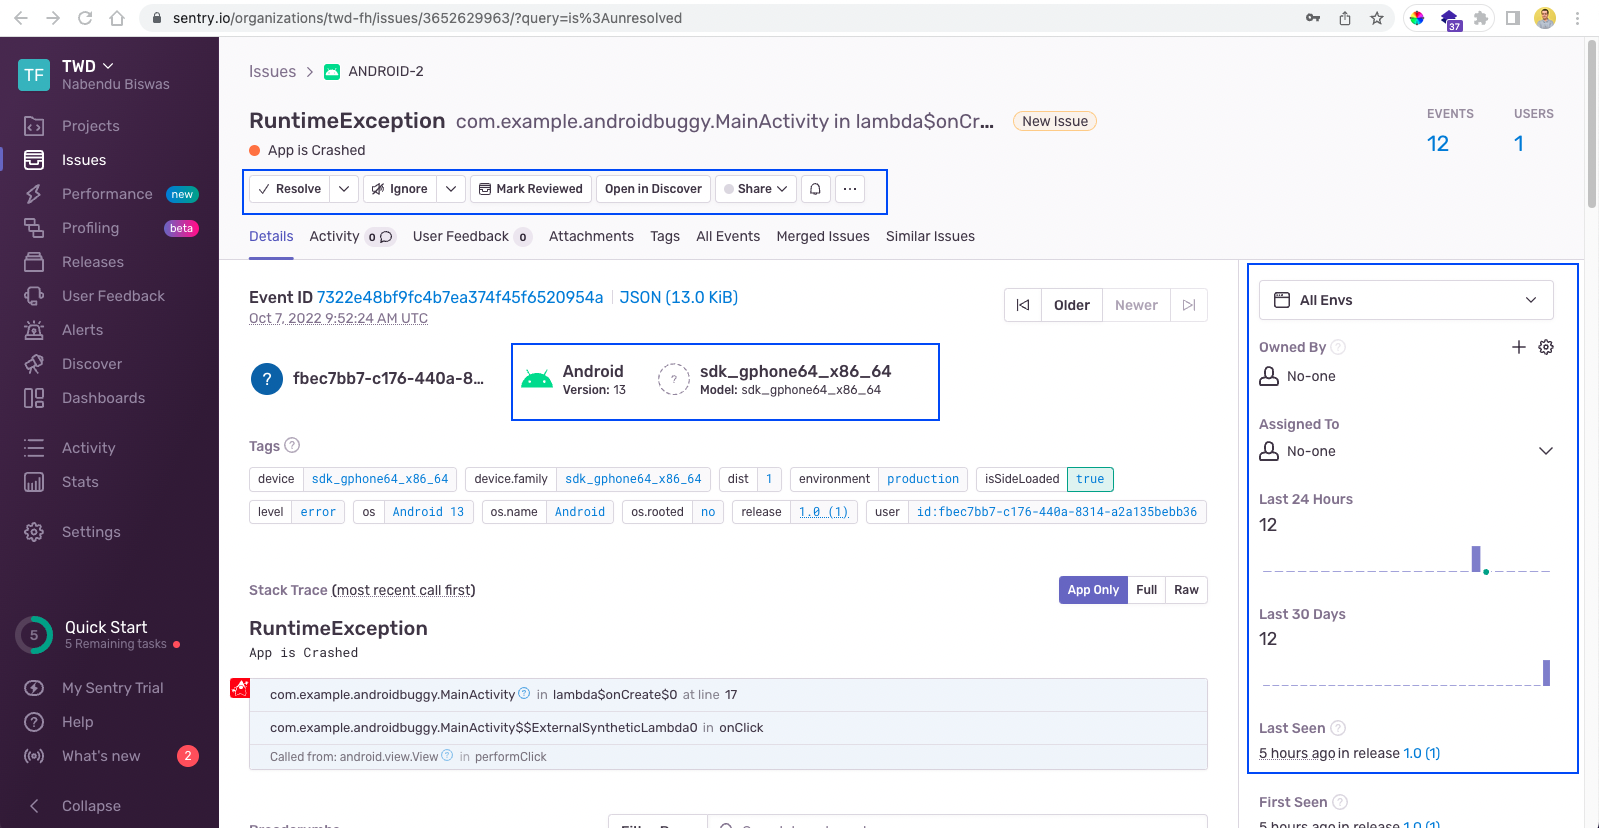
Here, we have a lot of options to track the error (for example, we can resolve or ignore it or mark it reviewed). Again, we are getting all the details and meta data of the device and the environments, and we can also assign this error to someone on our team to fix with the available integrations to GitHub and/or Jira.
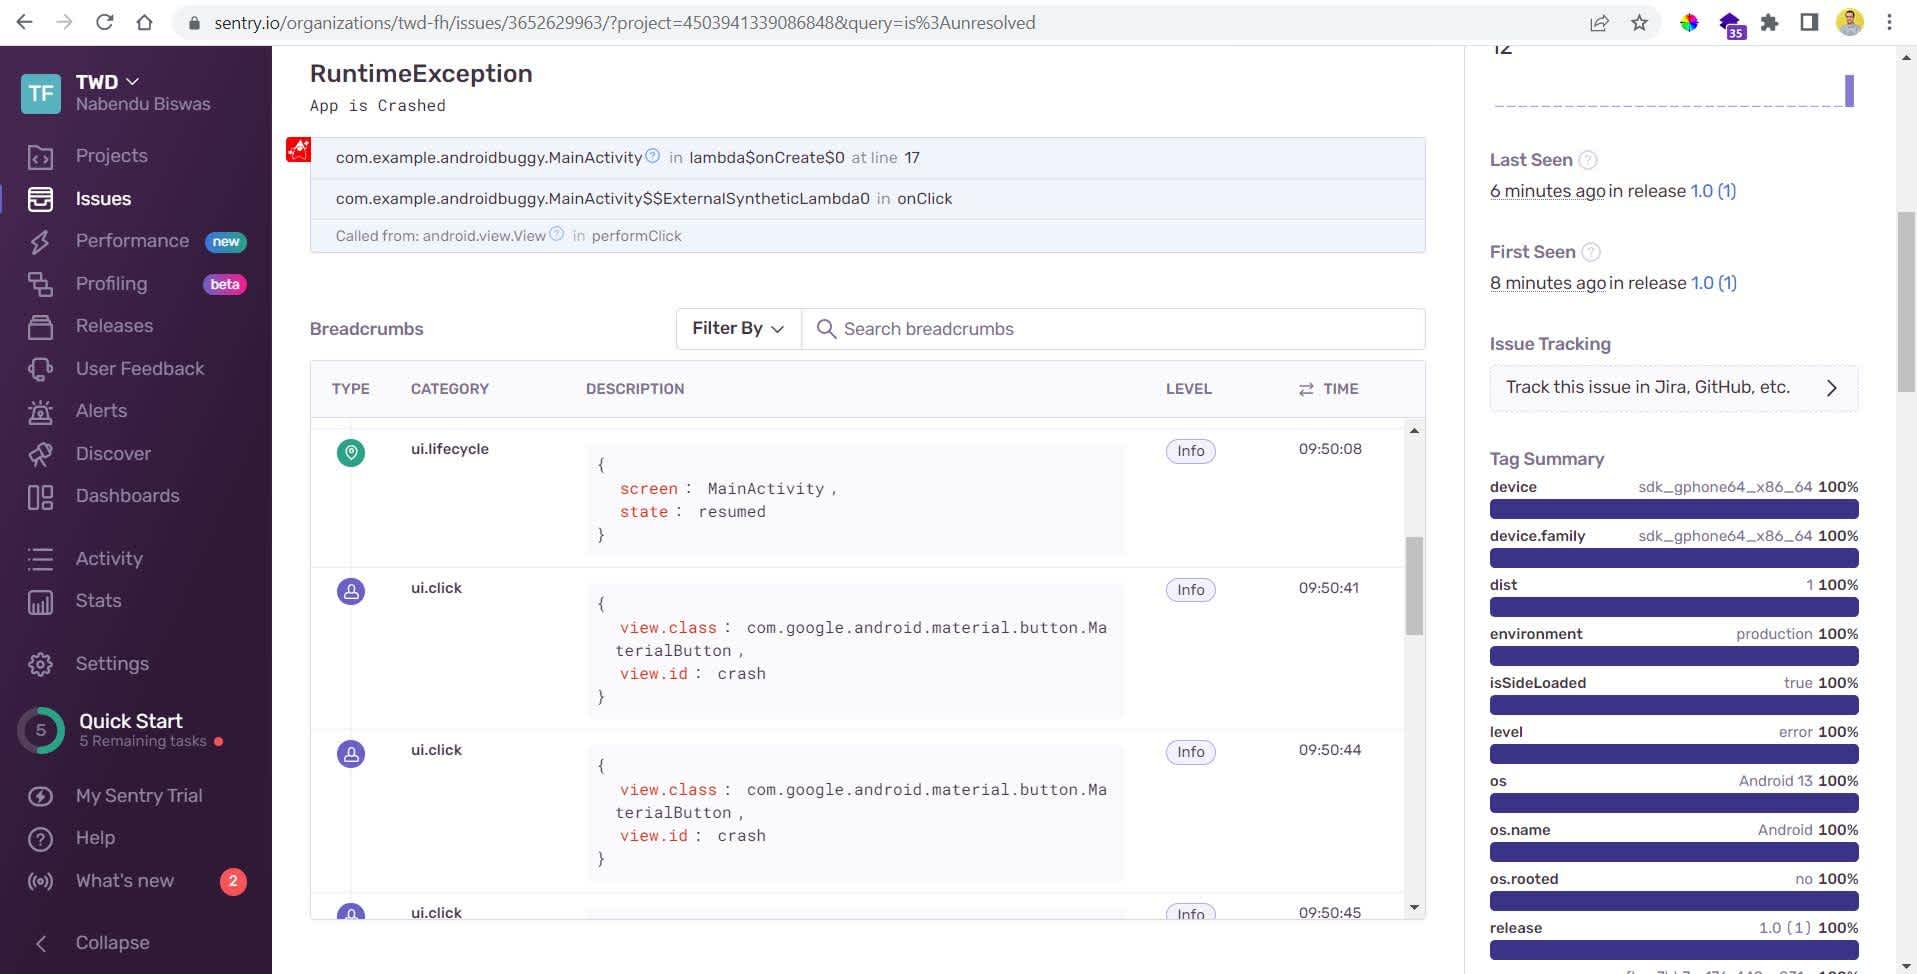
We are getting a lot more details in the log, which can help us solve the error more easily. As you can see from the screenshots, Sentry provides us with both Breadcrumbs and Stack Traces for each of the issues reported.
Breadcrumbs tell us how the user got to the point when the issue occurred. We can use that info to reproduce the crash locally, which makes it much easier to fix the issue.
Stack Traces on the other hand give us the execution flow of the functions and methods that lead up to the crash. Function A called function B, which called function C and then the app crashed. We'd know where those three functions are within our codebase. Using this info, we can look into how those three functions are connected to each other, and figure out what caused the crash.
Challenges Solved With Sentry
As we have seen in the past three screenshots, Sentry is an advanced cloud-based tool with far more advanced crash-reporting features, such as:
Breadcrumbs
Stack Traces
Device Info
Profiling
User Feedback
Alerts
Sentry also has a lot of integrations, like issue-tracking with Jira, which allows us to track and assign bugs to different developers on our team.
Recap
In this post, we learned about mobile crash reporting. We created a simple Android app to crash. We first learned to check logs in the built-in Logcat in Android Studio. Here, we saw many challenges in crash reporting.
We checked out two cloud-based crash-reporting tools: Crashlytics and Sentry. Sentry has more features and felt much easier to use. You can get started with both tools for free.

