Four Mobile Vitals Every Mobile Developer Should Monitor
Four Mobile Vitals Every Mobile Developer Should Monitor
We just launched a killer new feature that tracks these mobile vitals (and a few other important things like screen rendering time & screen loads) automatically. Check it out.
Slow apps frustrate users, which leads to bad reviews, or customers that swipe left to competition. Unfortunately, seeing and solving mobile performance issues can be a struggle and time-consuming.
Most developers use profilers within IDEs like Android Studio or Xcode to hunt for bottlenecks and automated performance tests to catch performance regressions in their code during development. However, testing an application before it ships is not enough.
To catch the most frustrating mobile performance issues, you need to explore what's happening on your users' devices. That means visibility into how fast your app starts, the duration of HTTP requests, the number of slow and frozen frames, how fast your views are loading, and more. With Sentry for mobile crash reporting, you can now easily monitor the mobile vitals and performance metrics your React Native, iOS, and Android app in real time without additional setup (or accumulating a pile of testing devices).
The Top Mobile Vitals to Track
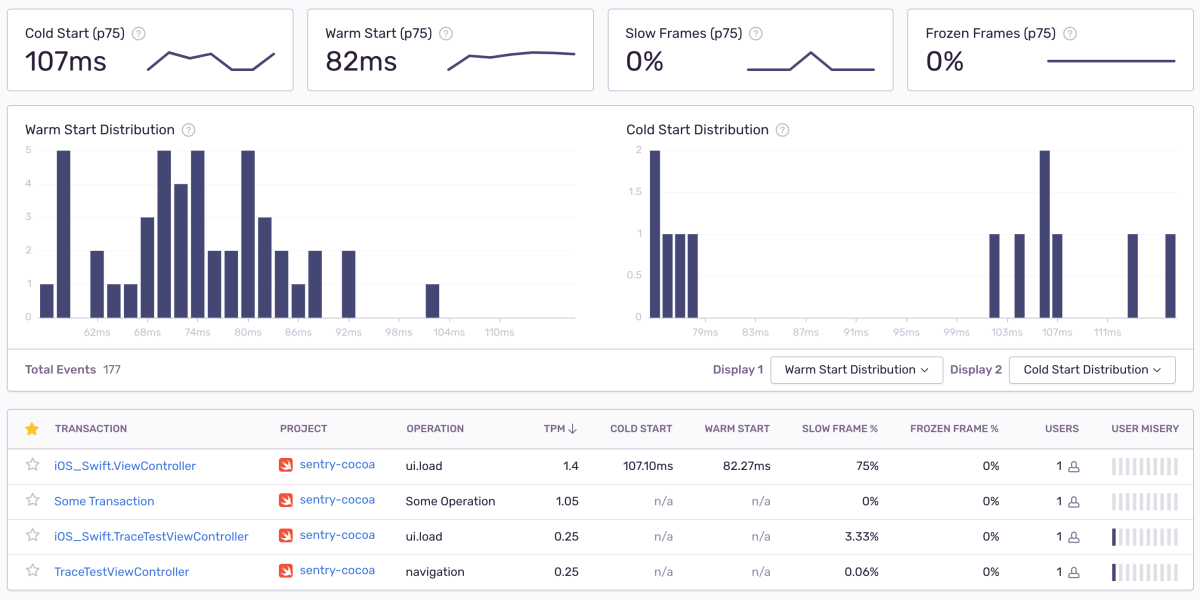
We believe there are four mobile performance vitals every mobile team should track to better understand how their app is performing: Cold starts, warm starts, slow frames, and frozen frames. These four mobile vitals, as a core part of Sentry's application performance monitoring, gives you the details you need to not only prioritize critical performance issues but trace the issue down to the root cause to solve them faster.
Measuring App Start: Cold vs. Warm
When a user taps on your app icon, it should start fast. On iOS, Apple recommends your app take at most 400ms to render the first frame. On Android, the Google Play Console warns you when a cold start takes longer than 5 seconds or a warm start longer than 2 seconds.
Cold start: App launched for the first time, after a reboot or update.
Warm start: App launched at least once and is partially in memory.
The exact definitions differ slightly per platform. For more details, please check out our iOS and Android docs.
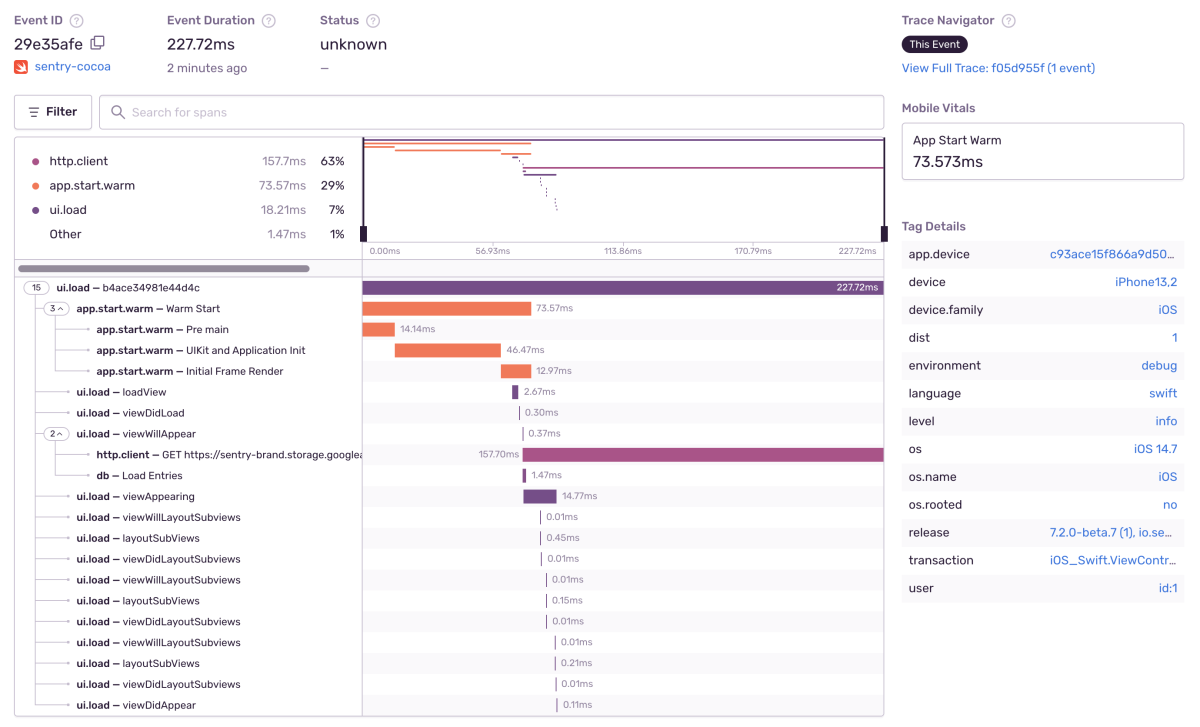
No matter the platform, it is crucial that your app starts quickly to provide a delightful user experience. That's why on iOS, Mac Catalyst, tvOS, and Android we track how long your app needs to draw your first frame. We grab this information and add spans for different phases of the app start. Here is an example from iOS:
On Android, it is trickier to hook into the initialization phases of the app start, and therefore we currently add one span from the application launch to the first auto-generated UI transaction. Still, this information is very useful and can help you to improve the duration of your app start.
Slow and Frozen Frames
Unresponsive UI, animation hitches, or just jank annoy users and degrade the user experience. Two measurements to track this unwanted experience are slow and frozen frames. A phone or tablet typically renders with 60 frames per second (fps).
The frame rate can also be higher, especially as 120 fps displays are becoming more popular. With 60 fps, every frame has 16.67 ms to render. If your app needs more than 16.67 ms for a frame, it is a slow frame.
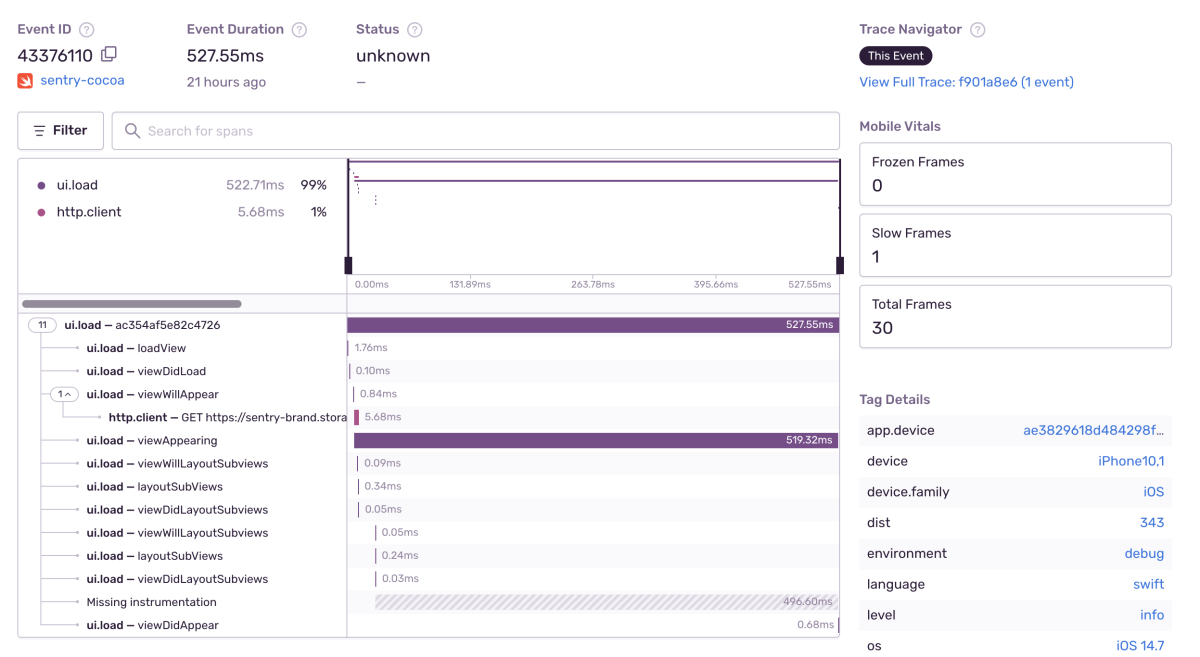
Frozen frames are UI frames that take longer than 700 ms. An app that is running smoothly should not experience either. That's why the SDK adds these two measurements to all transactions captured. The detail view of the transaction displays the slow, frozen, and total frames to the right.
Mobile Vitals are a core part of Sentry's performance monitoring for mobile and unlocks more ways to spot bottlenecks and speed up your apps.
Monitoring Mobile Vitals with Performance Monitoring
The purpose of Sentry's mobile performance monitoring is to track your application's performance across multiple services. To measure Mobile Vitals, the SDKs capture distributed traces consisting of transactions and spans.
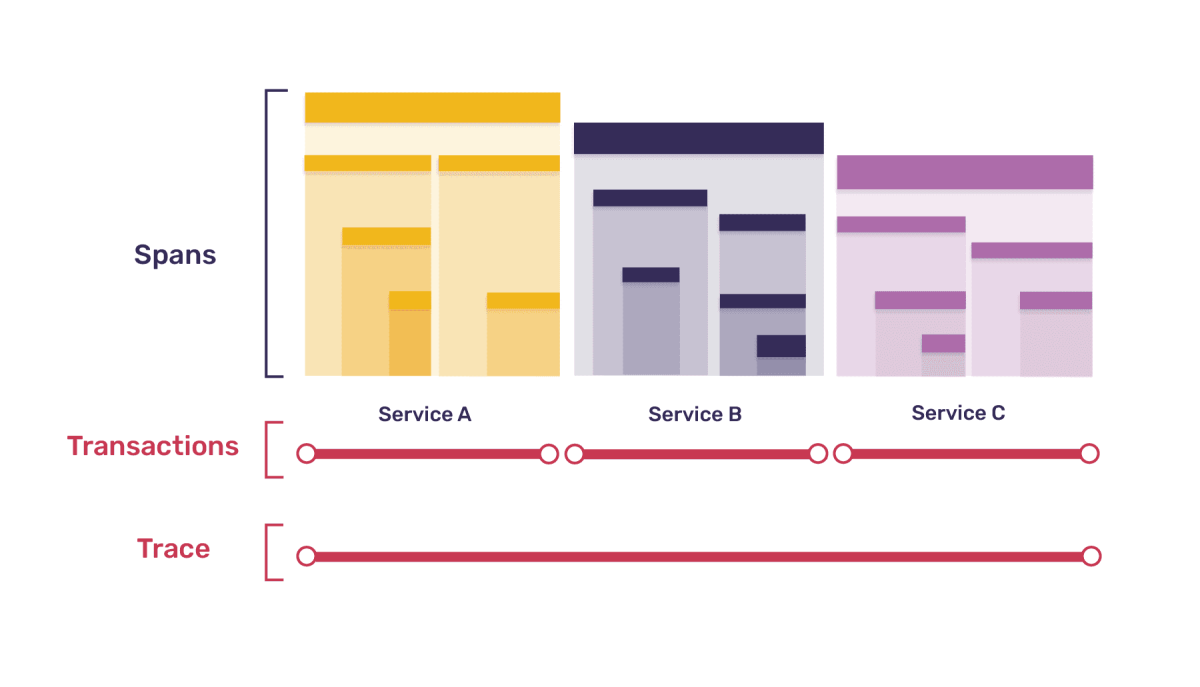
Distributed tracing is a standard technology used for understanding what's going on across distributed services, but it is still relatively new for mobile applications. A trace represents an operation you want to measure, like signing in or loading a view in your app. Both mentioned operations don't only involve your app but also backend actions. Each trace consists of one or more transactions, which can contain one or more spans. For example, the trace of a login could then include a transaction of your app and two transactions of your backend services.
Every transaction contains several spans representing a single unit of work, like reading a file or querying the database. The spans have a parent-child relationship, meaning a span can have multiple children and grandchildren. Here's an example trace, broken down into transactions and spans:
If you want to dig deeper into these concepts, check out Distributed Tracing 101 for Full Stack Developers by our very own, Ben Vinegar, VP of Engineering. For this blog post, let's focus on transactions and look at an example of creating a transaction with two child spans in Swift:
let transaction =
SentrySDK.startTransaction(name: "Load Messages", operation: "ui.load")
let getMessagesSpan =
transaction.startChild(operation: "http", description: "GET /my/api/messages")
getMessages()
getMessagesSpan.finish()
let renderMessagesSpan =
transaction.startChild(operation: "ui", description: "Render Messages")
renderMessages()
renderMessagesSpan.finish()
// Finishes the transaction and sends it to Sentry
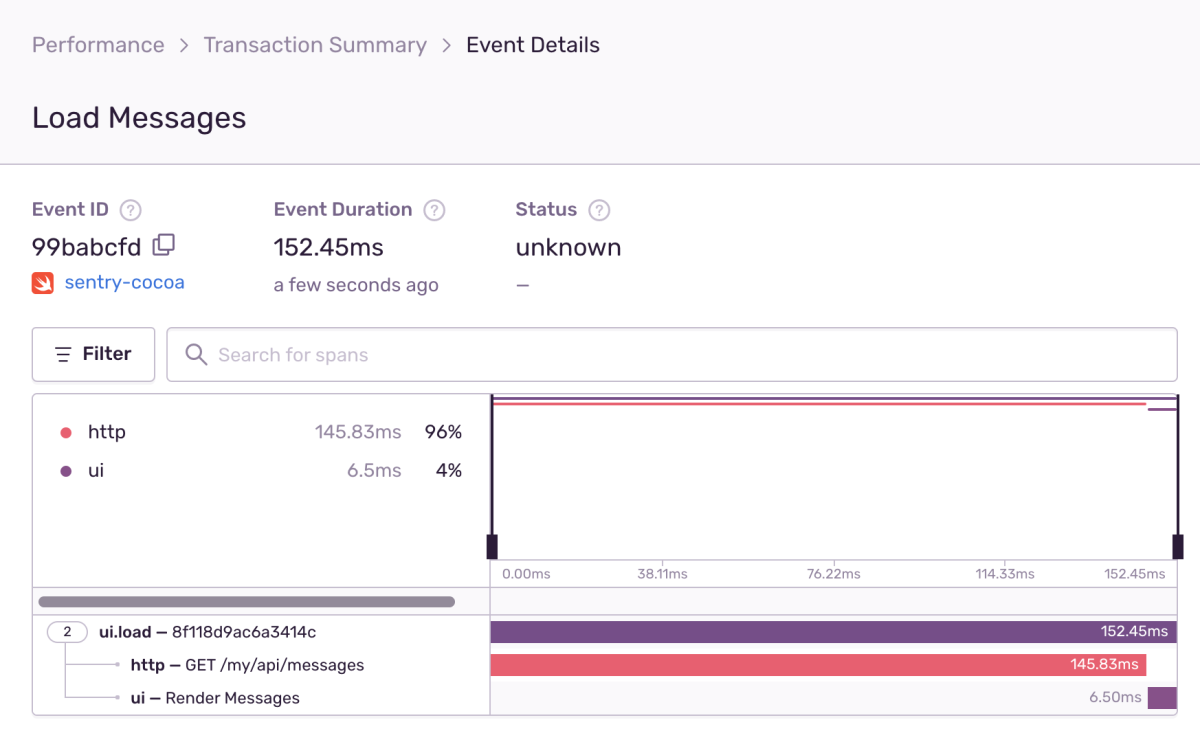
transaction.finish()After running the code we can take a look at the transaction in Sentry:
Creating rich transactions manually would require writing a lot of code. That's why we've made things easier with auto instrumentation. You can save yourself the headache of writing and maintaining code while still accessing the performance insights you need.
Automatic Instrumentation
The automatic instrumentation lets you explore how long your views take to render, and HTTP requests need to finish. The SDK for Apple generates transactions for UIViewControllers on iOS, tvOS, and Mac Catalyst and creates spans for outgoing HTTP requests on all platforms. The SDK for Android captures transactions for Activities and Fragments and provides an integration for OkHttp. Sentry SDK for React Native can capture transactions automatically when using React Navigation router and spans for both XHR and fetch requests. In the following months, we are working on adding support for Flutter.
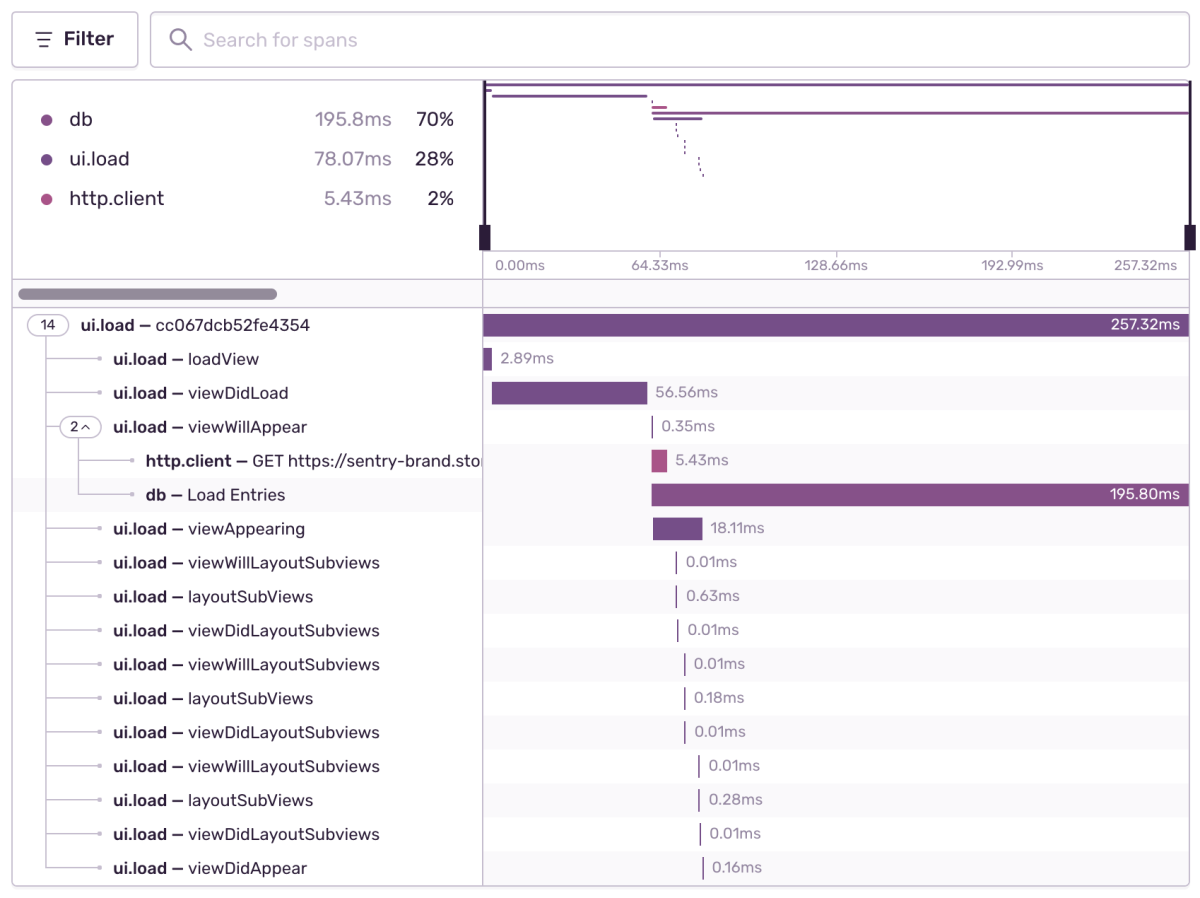
Here is an example of an auto-generated transaction on iOS for a UIViewController. As we can see in the screenshot below, the SDK creates spans for each lifecycle method. In viewWillAppear, we fire off an HTTP request for which a span is added. Our SDKs don't automatically add spans for querying the database (yet), but I'm interested in how long my query runs. Therefore I have to add a span manually. We can achieve this by using SentrySDK.span to access the current active span and call SentrySDK.span.startChild to create the desired child span.
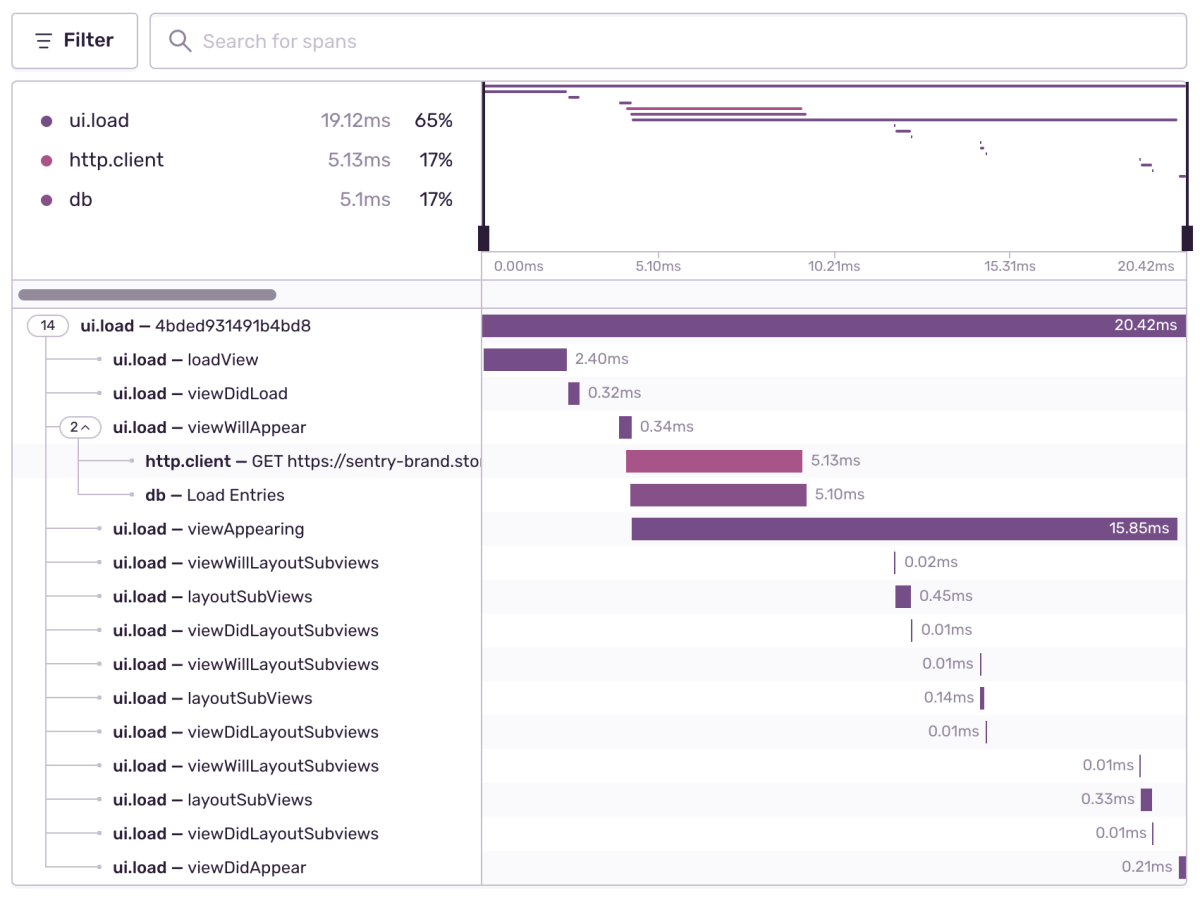
With the above transaction, I learn where my bottlenecks in the UIViewController are. The viewDidLoad method looks suspicious because it takes around 70 ms to complete, and I should investigate it. After looking at the code, I realize that I'm doing remarkable I/O on the main thread, which of course, is a no-go, and need to fix it immediately. Moreover, loading some entries from the database takes way longer than the HTTP request to finish, which also looks dubious and requires further investigation. After moving the I/O in viewDidLoad to a background thread and adding an index to speed up my database query, the transaction looks way better now. Of course, the speed of the HTTP request will vary depending on the network conditions, but I cleared out the controllable bottlenecks, which speeds up my transaction from 250ms to around 20ms. This is a huge improvement.
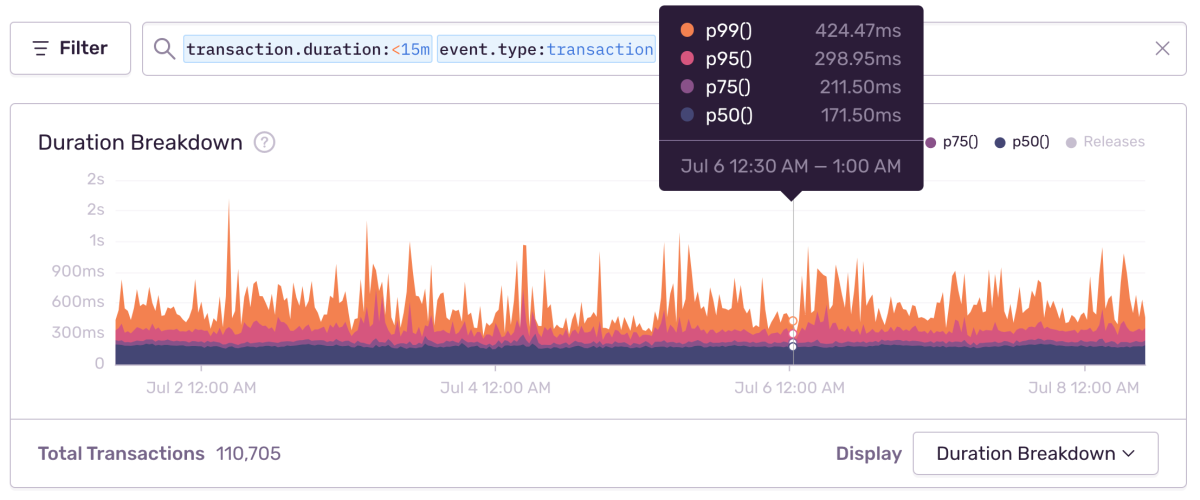
The duration of a transaction can vary greatly because of many circumstances. Stepping through individual transactions doesn't give you a clear picture to understand if your app gets faster or slows down. Therefore, we provide graphs to explore how the duration of a transaction changes over time.
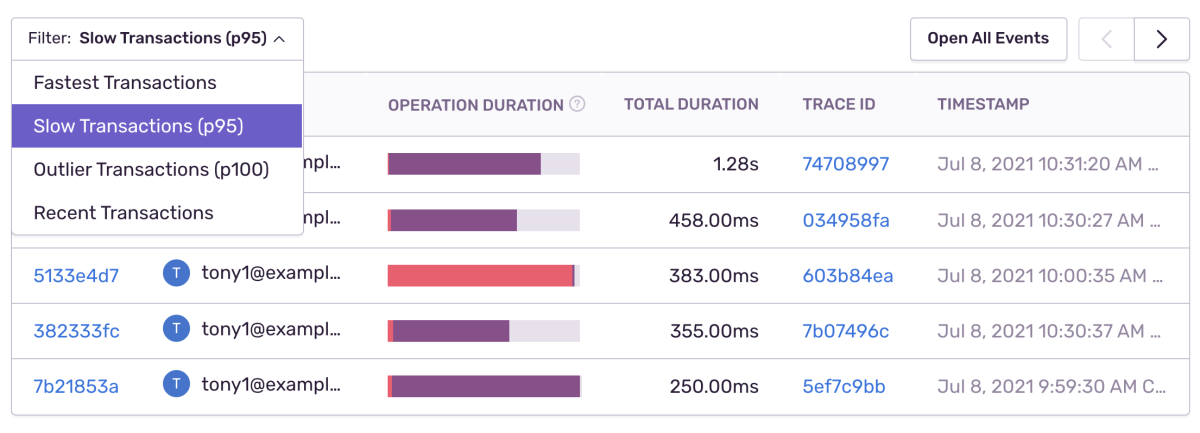
Sentry also offers the possibility to explore slow, fastest, outlier, or recent transactions to find the misery or delight your users experience quickly.
Along with many other possibilities to explore your transactions, Sentry links the related errors captured during a transaction at the bottom of the transaction summary page.
Auto-generated transactions combined with manual transactions unlocks rich data so you can see Mobile Vitals as well as other metrics such as User Misery to give you a complete view into the performance of your application.
To learn more, check out our docs for Apple, Android, and React-Native and give automatic performance instrumentation on mobile a try. Watch out for beta releases of the Flutter GitHub repo. We have plans to add these features to Flutter soon.

