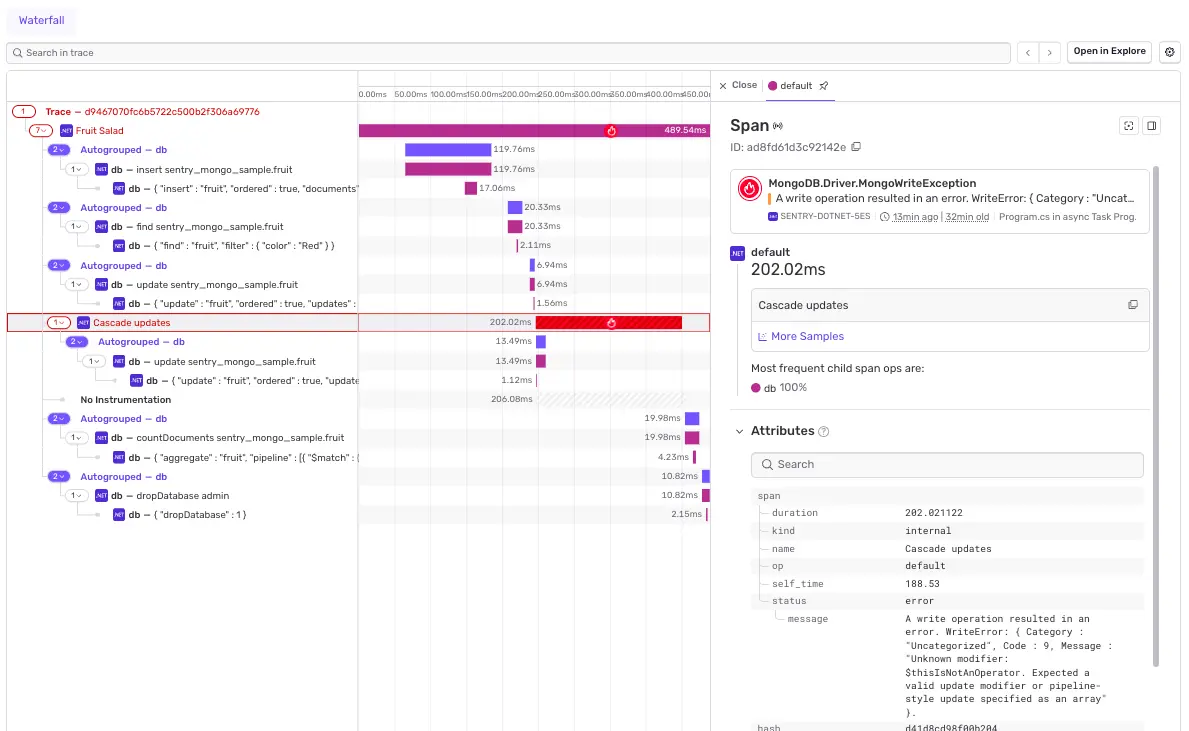
If your .NET app talks to MongoDB, you almost certainly want to be able to measure DB performance so that you can effectively debug any performance issues you might run into.
For that, you need to know which database command was running, how long it took, and whether this was a one-off blip or part of a broader pattern. Ideally, you also want to pivot from that trace to related errors and replays without stitching the story together by hand.
This post shows how to do exactly that using:
MongoDB’s built-in OpenTelemetry instrumentation
Sentry’s OTLP ingestion support in the .NET SDK
A small sample app that demonstrates the end-to-end flow
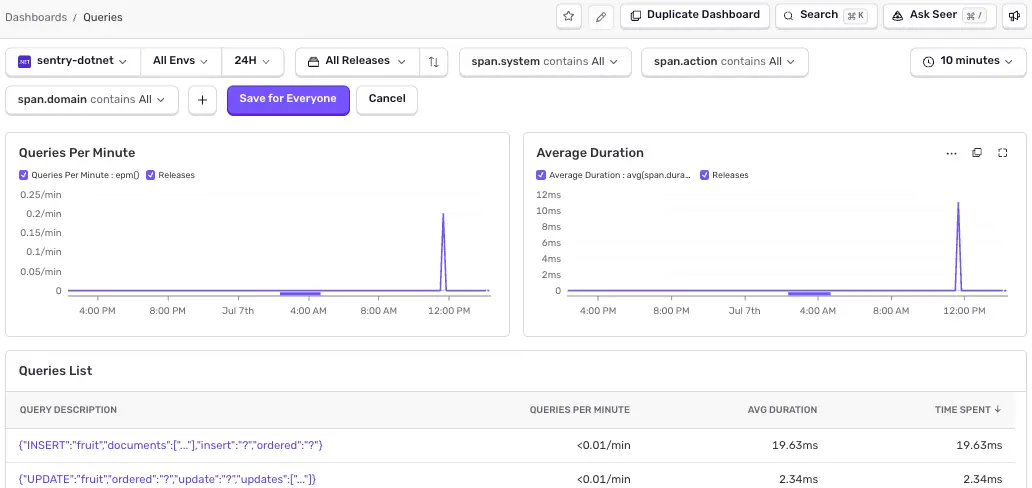
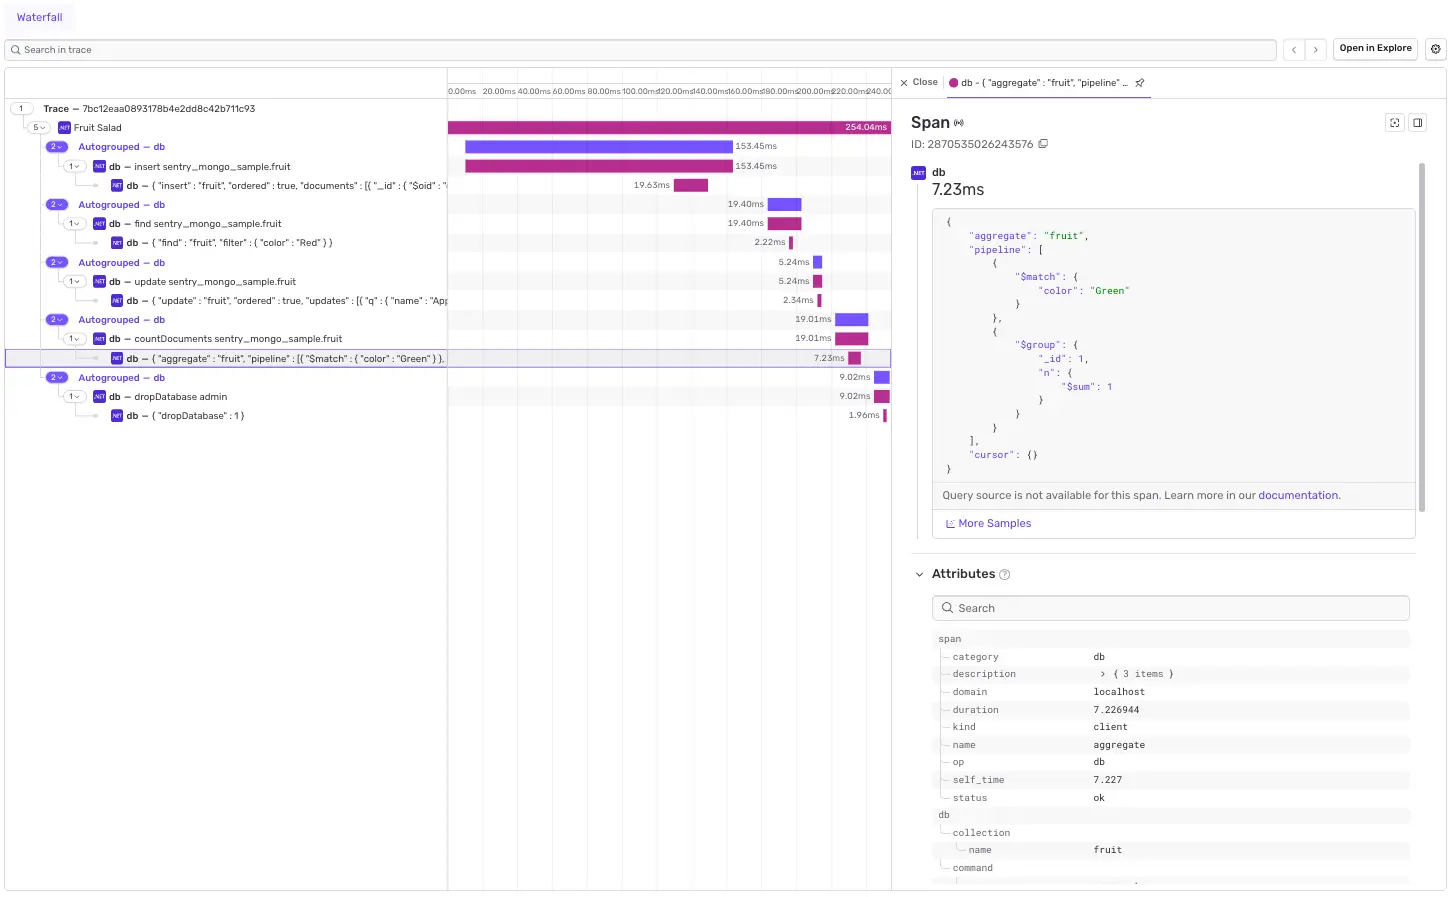
Once we’re done, you’ll be able to see your MongoDB spans and query data in Sentry and drill into these:
Why this approach
There were basically two ways we could have solved MongoDB instrumentation for Sentry users.
One option was to build and maintain a dedicated Sentry.MongoDB integration with its own ActivityListener and custom mapping logic.
That would work, but it also means more custom code to maintain, more translation between telemetry models, and one more special-case integration to explain.
The other option, and the one we chose, was to lean into OpenTelemetry and send spans to Sentry over OTLP. MongoDB already emits OpenTelemetry-compatible Activity data, and Sentry now accepts OTLP traces directly. So instead of building a bespoke bridge for each library, we can use the existing OpenTelemetry pipeline.
That is exactly why Sentry.OpenTelemetry.Exporter exists in sentry-dotnet: it wires OpenTelemetry exporting to Sentry’s OTLP endpoint while keeping Sentry-specific context propagation in place.
Quick refresher: MongoDB + Activity in .NET
In .NET, OpenTelemetry tracing is built on System.Diagnostics.Activity.
Instrumented libraries create activities when work starts and stops.
OpenTelemetry SDK components listen, process, and export those activities.
As of recent MongoDB driver releases, MongoDB operations can emit this telemetry out of the box when instrumentation is enabled. That means queries, commands, and transaction-related operations can flow through your existing OpenTelemetry setup without you writing your own listener.
Prerequisites
At a high level, you need:
A .NET app using MongoDB.Driver with OpenTelemetry instrumentation support
OpenTelemetry SDK packages for tracing
Sentry.OpenTelemetry.Exporter in your app
A Sentry DSN
If you are following along with our sample from sentry-dotnet, I would just use the package versions defined there since they are already validated together.
Enable OTLP mode so Sentry’s built-in tracing instrumentation does not duplicate spans.
Configure OpenTelemetry tracing.
Add MongoDB instrumentation.
Export traces to Sentry using AddSentryOtlp(...).
A simplified shape looks like this:
SentrySdk.Init(options =>{ options.Dsn = dsn; options.UseOtlp(); // <-- Configure Sentry to use OpenTelemetry trace information});using var tracerProvider = Sdk.CreateTracerProviderBuilder() .AddSource(MongoTelemetry.ActivitySourceName) // <-- Subscribe to the MongoDB driver's built-in instrumentation .AddSentryOtlp(builder.Configuration["SENTRY_DSN"]!) .Build();
The key idea is simple: OpenTelemetry is responsible for producing and exporting spans, while Sentry remains responsible for crash reporting and end-to-end observability correlation and UI exploration.
Note: Without UseOtlp(), you can end up with duplicate spans if both OpenTelemetry and Sentry’s built-in tracing hooks try to generate overlapping telemetry.
Capturing useful MongoDB query data
Getting spans is table stakes. The interesting bit is the context on those spans.
For MongoDB instrumentation, that includes command/query details so you can determine:
Which collection was involved?
Which operation type is slow?
Is this a repeated query pattern or a one-off spike?
The sample configures MongoDB and OpenTelemetry in a way that emits query command context and makes it visible in Sentry trace details and in the Queries experience.
What about PII in query data?
Query payloads can include user identifiers, emails, tokens, and other sensitive fields, which you may not be comfortable (or legally allowed) to store in Sentry.
When Sentry receives your MongoDB spans via OTLP, Relay derives a parameterized copy of the query, normalizes DB attributes and scrubs all the query values (replacing them with ?). That parameterized string is what is used to group and display queries in the Queries module.
However, Relay never removes or overwrites the original db.query.text. So the raw command, with real values like { "name": "Alice Smith" }, is retained verbatim on the stored span and shows in the span/exemplar detail view. So values are safe in the aggregate Queries view, but the raw PII is still stored and viewable per-span.
There are three different options for scrubbing this data:
Don’t capture query text at all
This is the simplest and most reliable. Although it means you miss out on capturing some potentially very useful context.
internal sealed partial class RedactSensitiveMongoData : BaseProcessor<Activity>{ [GeneratedRegex("(\"contributor\"\\s*:\\s*)\"[^\"]*\"")] private static partial Regex SensitiveField(); public override void OnEnd(Activity activity) { if (activity.GetTagItem("db.query.text") is string queryText) { activity.SetTag("db.query.text", SensitiveField() .Replace(queryText, "$1\"[Filtered]\"")); } }}
The scrubber above replaces any contributor field values with the text [Filtered] so that what is sent and stored in Sentry is the redacted version that doesn’t contain any PII:
The default rules only catch known-sensitive patterns (passwords, tokens, card numbers): they won’t parameterize arbitrary field values, so for general PII you’d add an explicit rule/selector.
Correlating traces with Sentry errors and replays
One important detail in the OTLP integration is propagation context bridging.
When traces are produced by OpenTelemetry Activity, Sentry still needs to inject and read the right trace headers (sentry-trace and baggage) so issues, transactions, and downstream services line up correctly.
That support is built into the exporter integration, so you get correlation across tracing and errors without extra wiring in your application code.
In practice, that means:
You can jump from a slow MongoDB span to related errors or logs in the same trace.
After running the sample and generating MongoDB activity, you can explore the data in a few places:
Explore -> Traces for end-to-end transaction timelines
Span samples to inspect individual MongoDB operations
Trace samples to view a waterfall showing how spans sit in the request lifecycle
Queries for searching and grouping span-level behavior
This is where the OTLP route really pays off. You are not looking at a custom side-channel integration; you are looking at first-class trace data that sits naturally with the rest of your Sentry observability workflow.
Closing thoughts
MongoDB already emits the right signals. OpenTelemetry already knows how to process them, and now Sentry ingests those traces natively via OTLP.
Instead of maintaining another bespoke SDK integration, we can use open standards, keep the setup simple, and still preserve Sentry’s correlation and data-safety story.
As usual, questions, feedback, or ideas for where we should take this next are all very welcome, so feel free to fire up a discussion at sentry-dotnet discussions.
We moved Android SDK operations to a worker isolate, then streamlined scope updates by removing duplicate normalization and encoding JSON directly into UTF-8 bytes.
The back/forward cache is one of the most impactful performance features on the web and one of the least observable, because success looks like silence. Here's how we made it measurable.



![Sentry span detail showing a MongoDB insert command with contributor fields redacted to [Filtered] by the client-side OTEL span processor](/_vercel/image?url=_astro%2Fspan-detail-filtered-pii-mongodb.CNxN7Tne.webp&w=750&q=100)