Monitorring & Debugging a Checkout Flow in Flask & React


When your checkout flow breaks, customers disappear faster than most ‘cutting-edge’ JS metaframeworks. Thankfully, setting up observability for your critical paths—like a customer checkout—is painless with Sentry. Let's walk through how we instrumented, monitored, and fixed a major issue, with minimal effort.
First, we wanted to track exactly how users interacted with our checkout process. Setting up a monitoring dashboard with Sentry’s Distributed Tracing was straightforward. All we had to do was turn on Tracing in our frontend & backend applications (in this case, our top level app.py & App.tsx files), set up Distributed Tracing by adding our /api/ endpoint to the tracePropagationTargets, and we were done.
Just like that, we're capturing performance metrics, errors, and tracing data across both Flask and React.
Once we had the data in Sentry, it was pretty easy to spin up a dashboard to monitor the most critical aspect of our eCommerce storefront: the checkout flow.
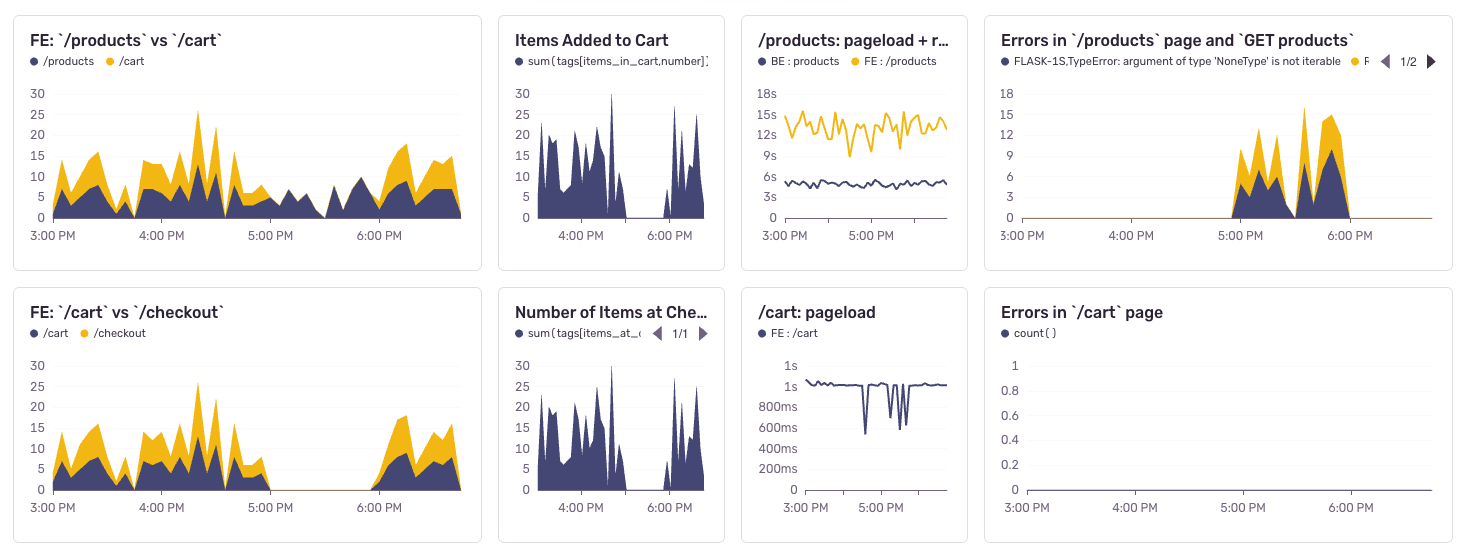
To get here, we enhanced our Span data with a few key attributes, which we could visualize and monitor in Sentry as Span Metrics. Whenever someone used our Cart.jsx component, our instrumentation in the Sentry SDK allowed us to attach the # of items added to their cart, and we could track that number by attaching it to the active Span. Essentially, it looked like this:
// Checkout.jsx async function handleSubmit(event) { Sentry.startSpan({ name: 'Submit Checkout Form', }, async (span) => { let hadError = false; try { await checkout(cart, span); } catch (error) { Sentry.captureException(error); } ... } } async function checkout (cart, checkout_span) { ... checkoutspan.setAttribute("items_at_checout, itemsInCart); ... }
First, we create a span with Sentry.startSpan(), then we add items_at_checkout as an attribute with checkoutspan.setAttribute. We could easily enrich this with other useful info like customer data for debugging & pattern analysis, but we decided to keep it simple here.
You might already be able to see how this can be so useful. Instead of having APM & Reliability data in one pane of glass, and basic user analytics in another… we can monitor for key signals in our users’ most critical journeys right where we can start debugging. This dramatically improves our ability to spot “outages” that aren’t just uptime or spikes in errors.
In this case, we saw a complete dropoff in the number of items people were adding to their carts. This would typically exist in a product analytics tool, which would be monitored by one team, and then we’d have to instantly escalate to a Sev1 incident and get a bunch of people on deck.
Instead, we could immediately see that there was a spike in errors on our /products and GET products endpoints at the same time that the dropoff occurred. Drilling into the errors, we could see we had 2 issues:
Flask (backend):
TypeError: Argument of type 'NoneType' is not iterableReact (frontend):
TypeError: Failed to Fetch
Again - thanks to Sentry - we could instantly see that there was a full stack issue that was breaking our user experience where it mattered the most.
Here’s where the real magic happened. We could see that the React issue didn’t have enough on its own to debug. But… clicking “View Full Trace” surfaced the underlying Flask backend error clearly:
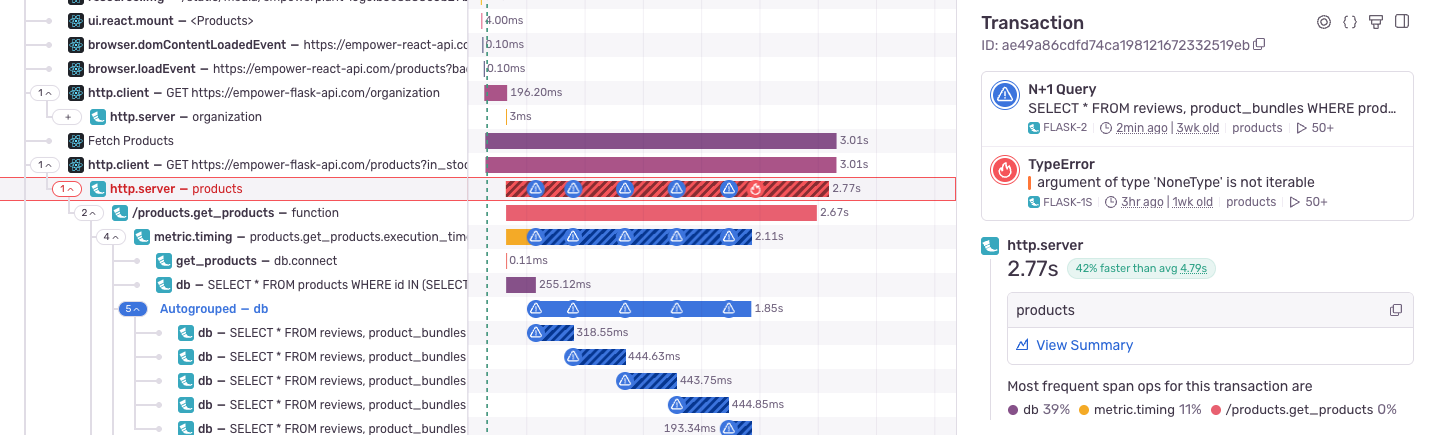
There was an upstream issue happening in the http.server request in our backend! We could click into that issue, and see the root cause pretty clear.y.
product_inventory = None

# later in the code...
if in_stock_only and productsJSON[i] not in product_inventory:
    continue
Classic. vibe coding slip up. We were initializing product_inventory to None, instead of giving it an empty array, making iteration impossible.
The fix involved a quick adjustment to properly initialize the inventory: product_inventory = []. This will pass an empty array to the frontend rather than throwing a type issue, so now we can properly handle an empty search result. We went from issue identification to triage and resolution in just a few minutes, without having to grep our backend codebase on our own or pull in teammates in different on call schedules.
But of this was still way too reactive for my taste. Instead of keeping our eyes on these dashboards, we should just set alerts on our span metrics and route them out to the right team. All we need to do is open the query for the Cart Value widget in the Trace Explorer, fine tune our query, and create an alert.
Instrumenting critical user experiences, monitoring your customer journeys, spotting issues, and debugging across your stack doesn't have to be painful. With just a few lines of code, Sentry gives you clarity—without the context switching chaos.
To get started with Distributed Tracing and Application Observability in Sentry, all you have to do is turn it on in code via Sentry.init() in both your frontend and backend, turn on the browser tracing integration, and you'll be ready to rock. Try it here in React and Python.
Give Distributed Tracing a try in your project and keep your customers (and your sanity) intact. If you have a high-throughput app, make sure to kick off a Tracing trial under Settings --> Billing. If you're new, kick off your Sentry free trial today!
Questions? Feedback? Challenges? Hit us up on Discord.