New Features, Greater Visibility

Sentry -
[Clever opening here.][Insert light humor poking fun at ourselves.][Contrast this by bragging about our recent accomplishments.][End on a serious note that transitions to the fantastic new features.]
Sentry’s newest features provide both macro- and micro-level perspective of trends in your errors and application's health. They're great — you'll see.
Cross-project Issues
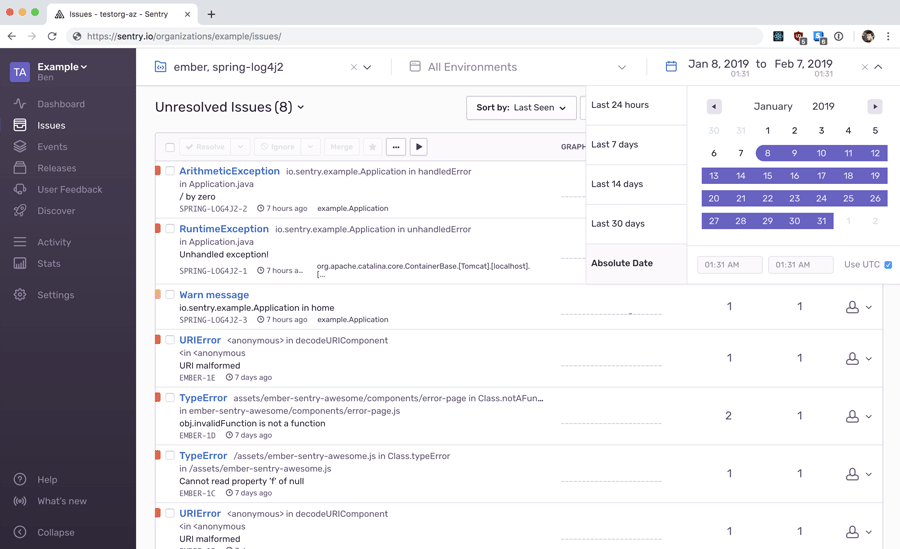
For the first time, you can navigate your Issues across multiple projects in a single view. See all Issues across your entire organization, or select a handful of related projects to surface correlated trouble spots.
[[small]][[italic]]You must be on the Business plan to navigate Sentry cross-project. Trial the Business plan.[[/italic]][[/small]]
Events View
By presenting a raw error stream, the Events View helps you understand the traces between multiple projects or issues.
Want to further investigate a spike? Select the spike in your Events View graph to narrow your timeframe. Drill down into any individual event to see the issue related to that event.
The Team plan allows one project on the Events feed, while the Business plan allows viewing of all projects.
New Search Capabilities
We've added some new powerful search capabilities to help you slice and dice your Issues and Events views.
Wildcards: use the
*operator as a placeholder for specific characters or strings, e.g.,user.email:*@example.comNegation: use the
!operator to exclude terms, e.g.,!user.email:user@example.comAdvanced properties: for the first time, search on advanced event properties like
stack(includingstack.filename,stack.module, etc.), as well asgeo(includinggeo.country_code,geo.city, etc.).
For a full list of syntax and searchable properties, see our Search Documentation.
Discover
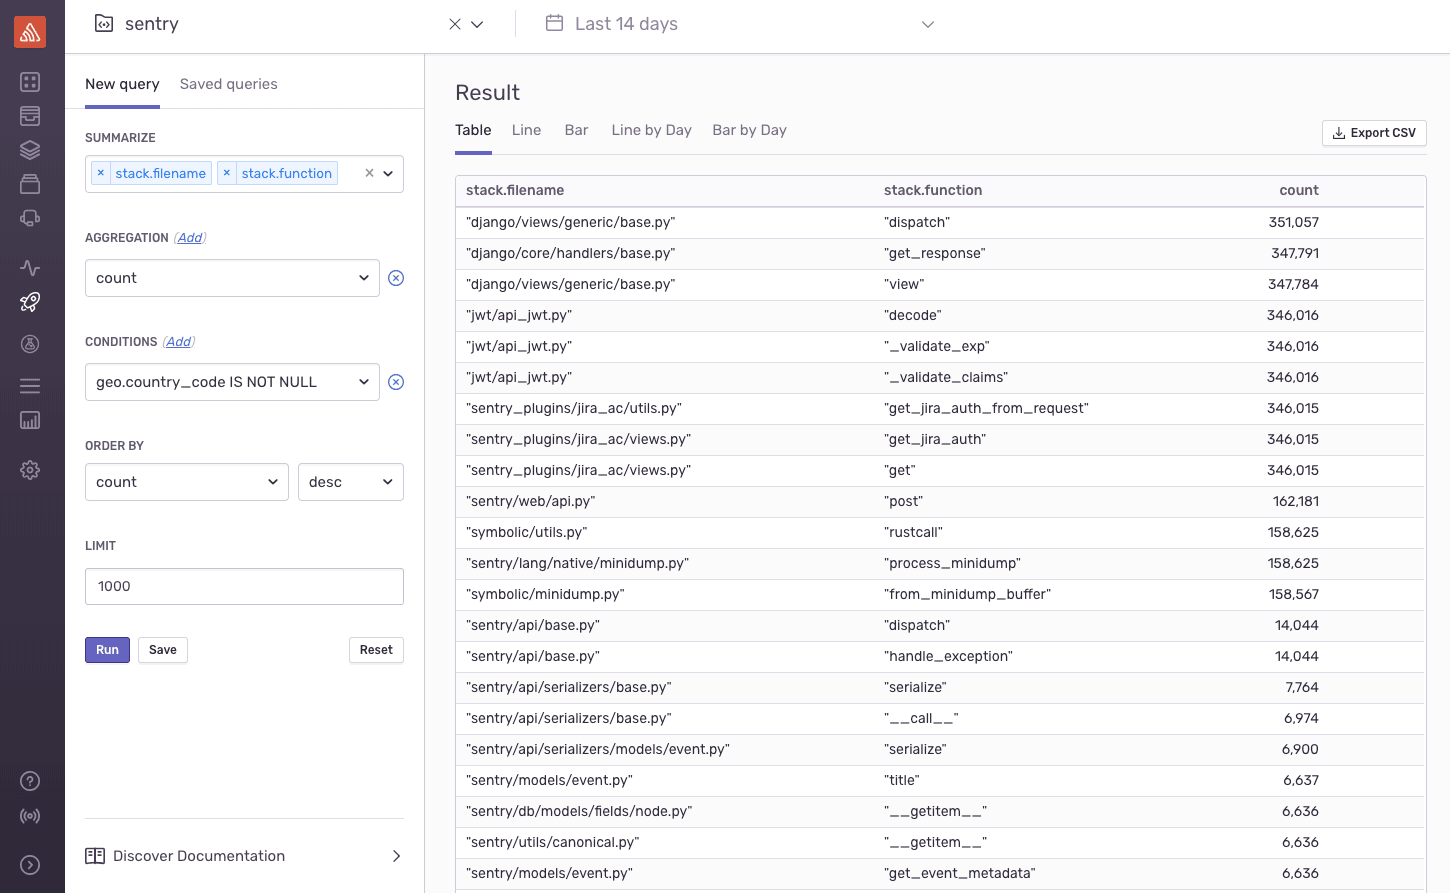
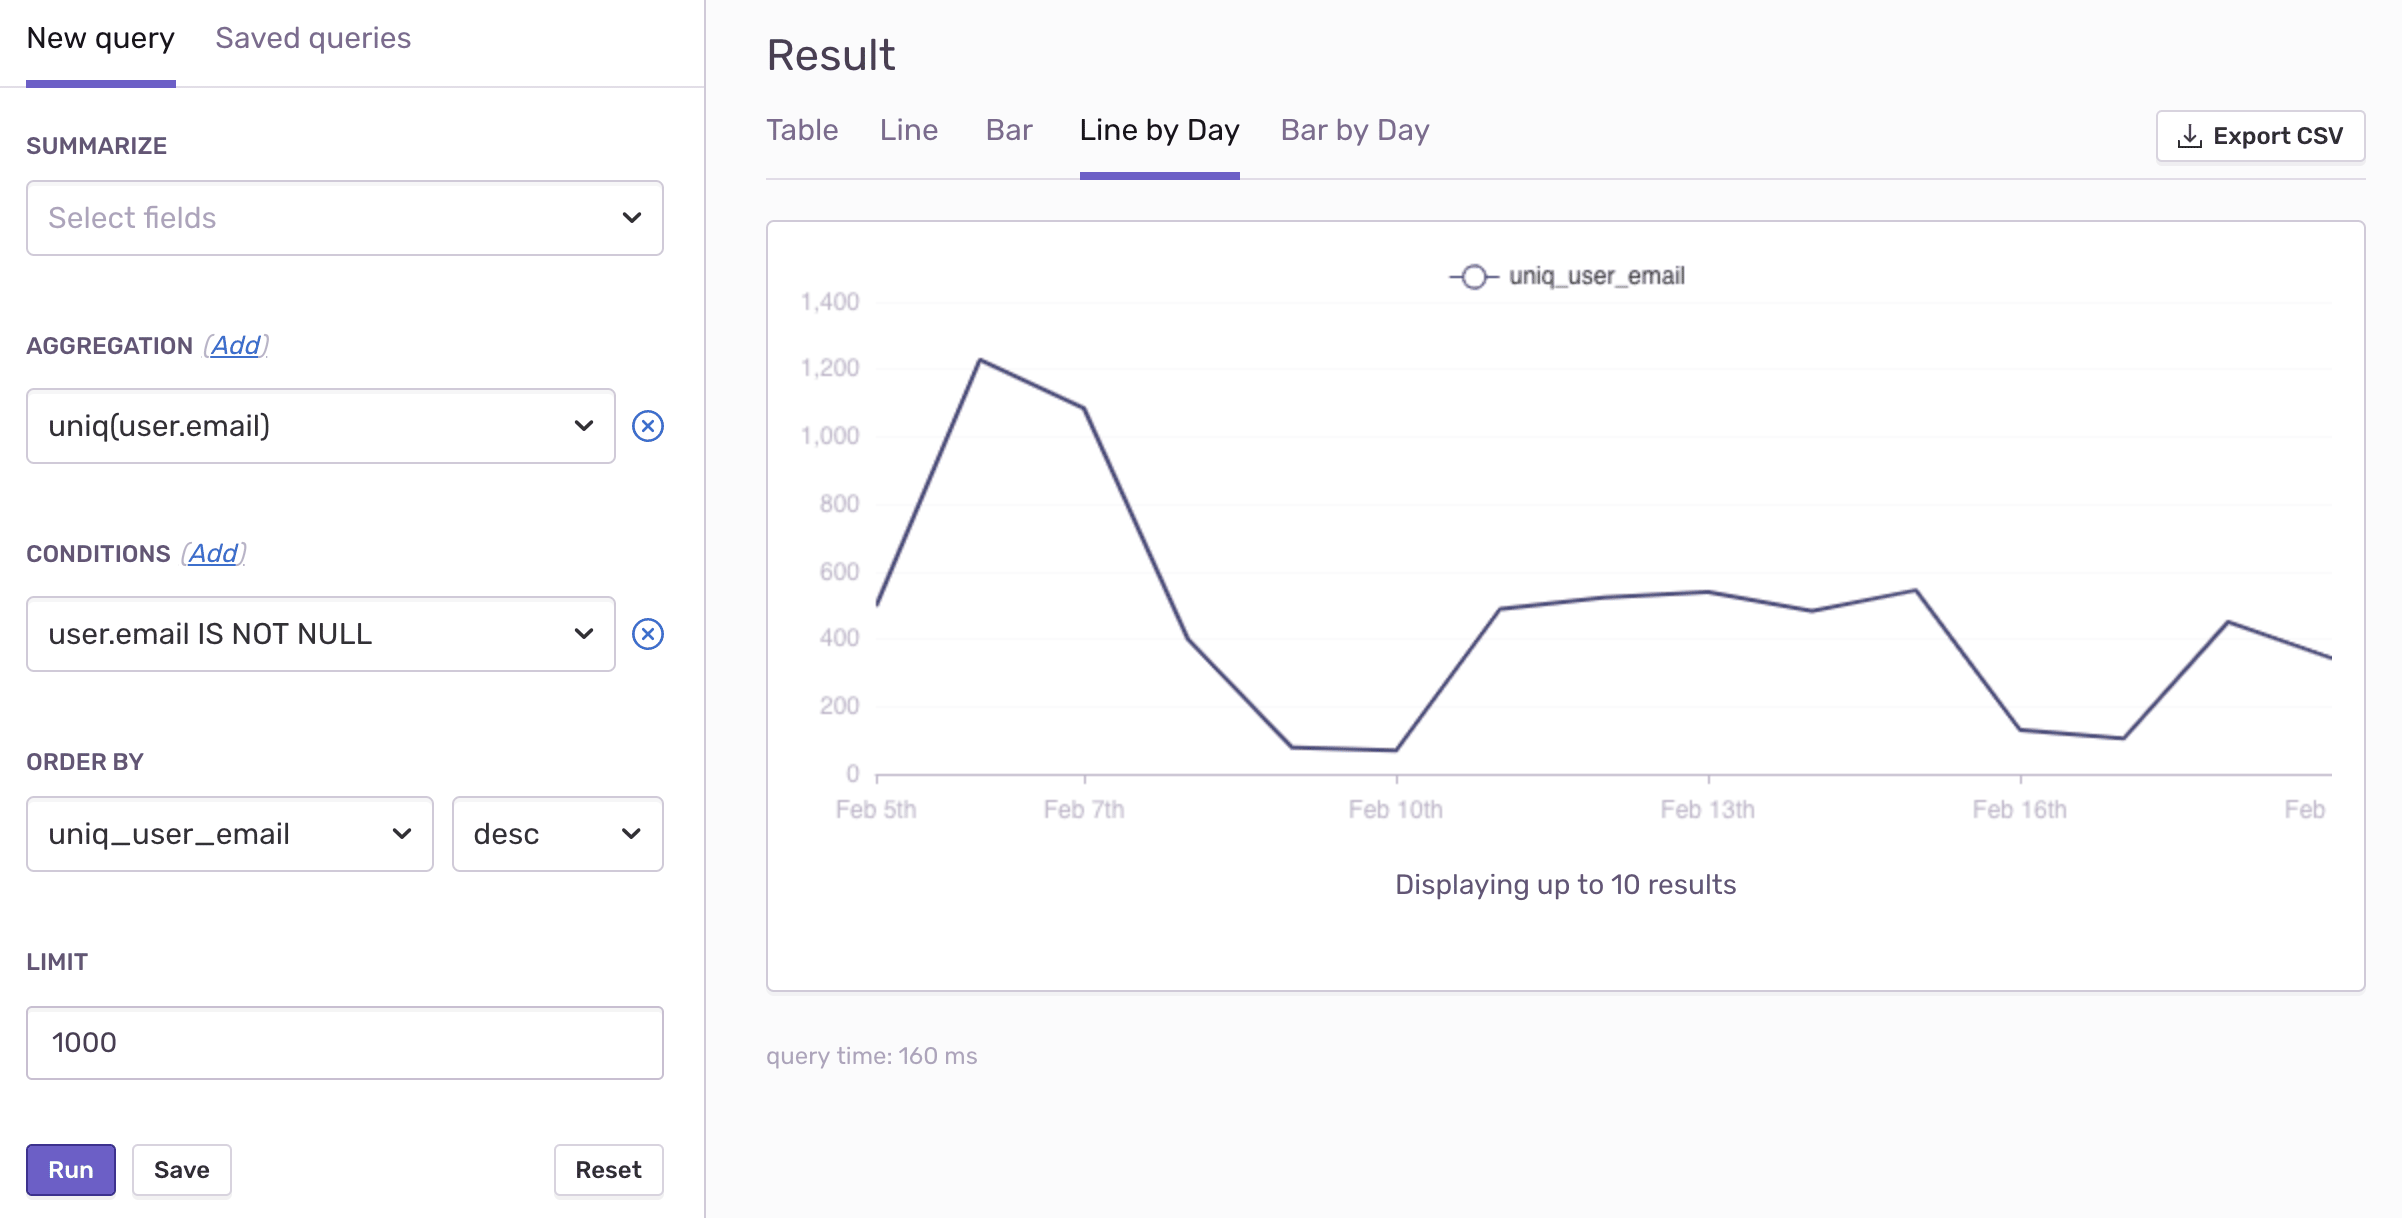
When you're ready to get your hands dirty, use Discover, Sentry's new query-builder, to query raw event data across your organization and uncover deeper insights.
For example, want to understand which parts of your code are responsible for triggering the most errors? Use Discover to aggregate event count by stack.filename and stack.function, as shown in the example below. You can browse the data as a table, as a line or bar chart, or export to CSV for further analysis.
[[small]][[italic]]Discover is available on Business plan. Want to try Discover today? Trial the Business plan.[[/italic]][[/small]]
Dashboards
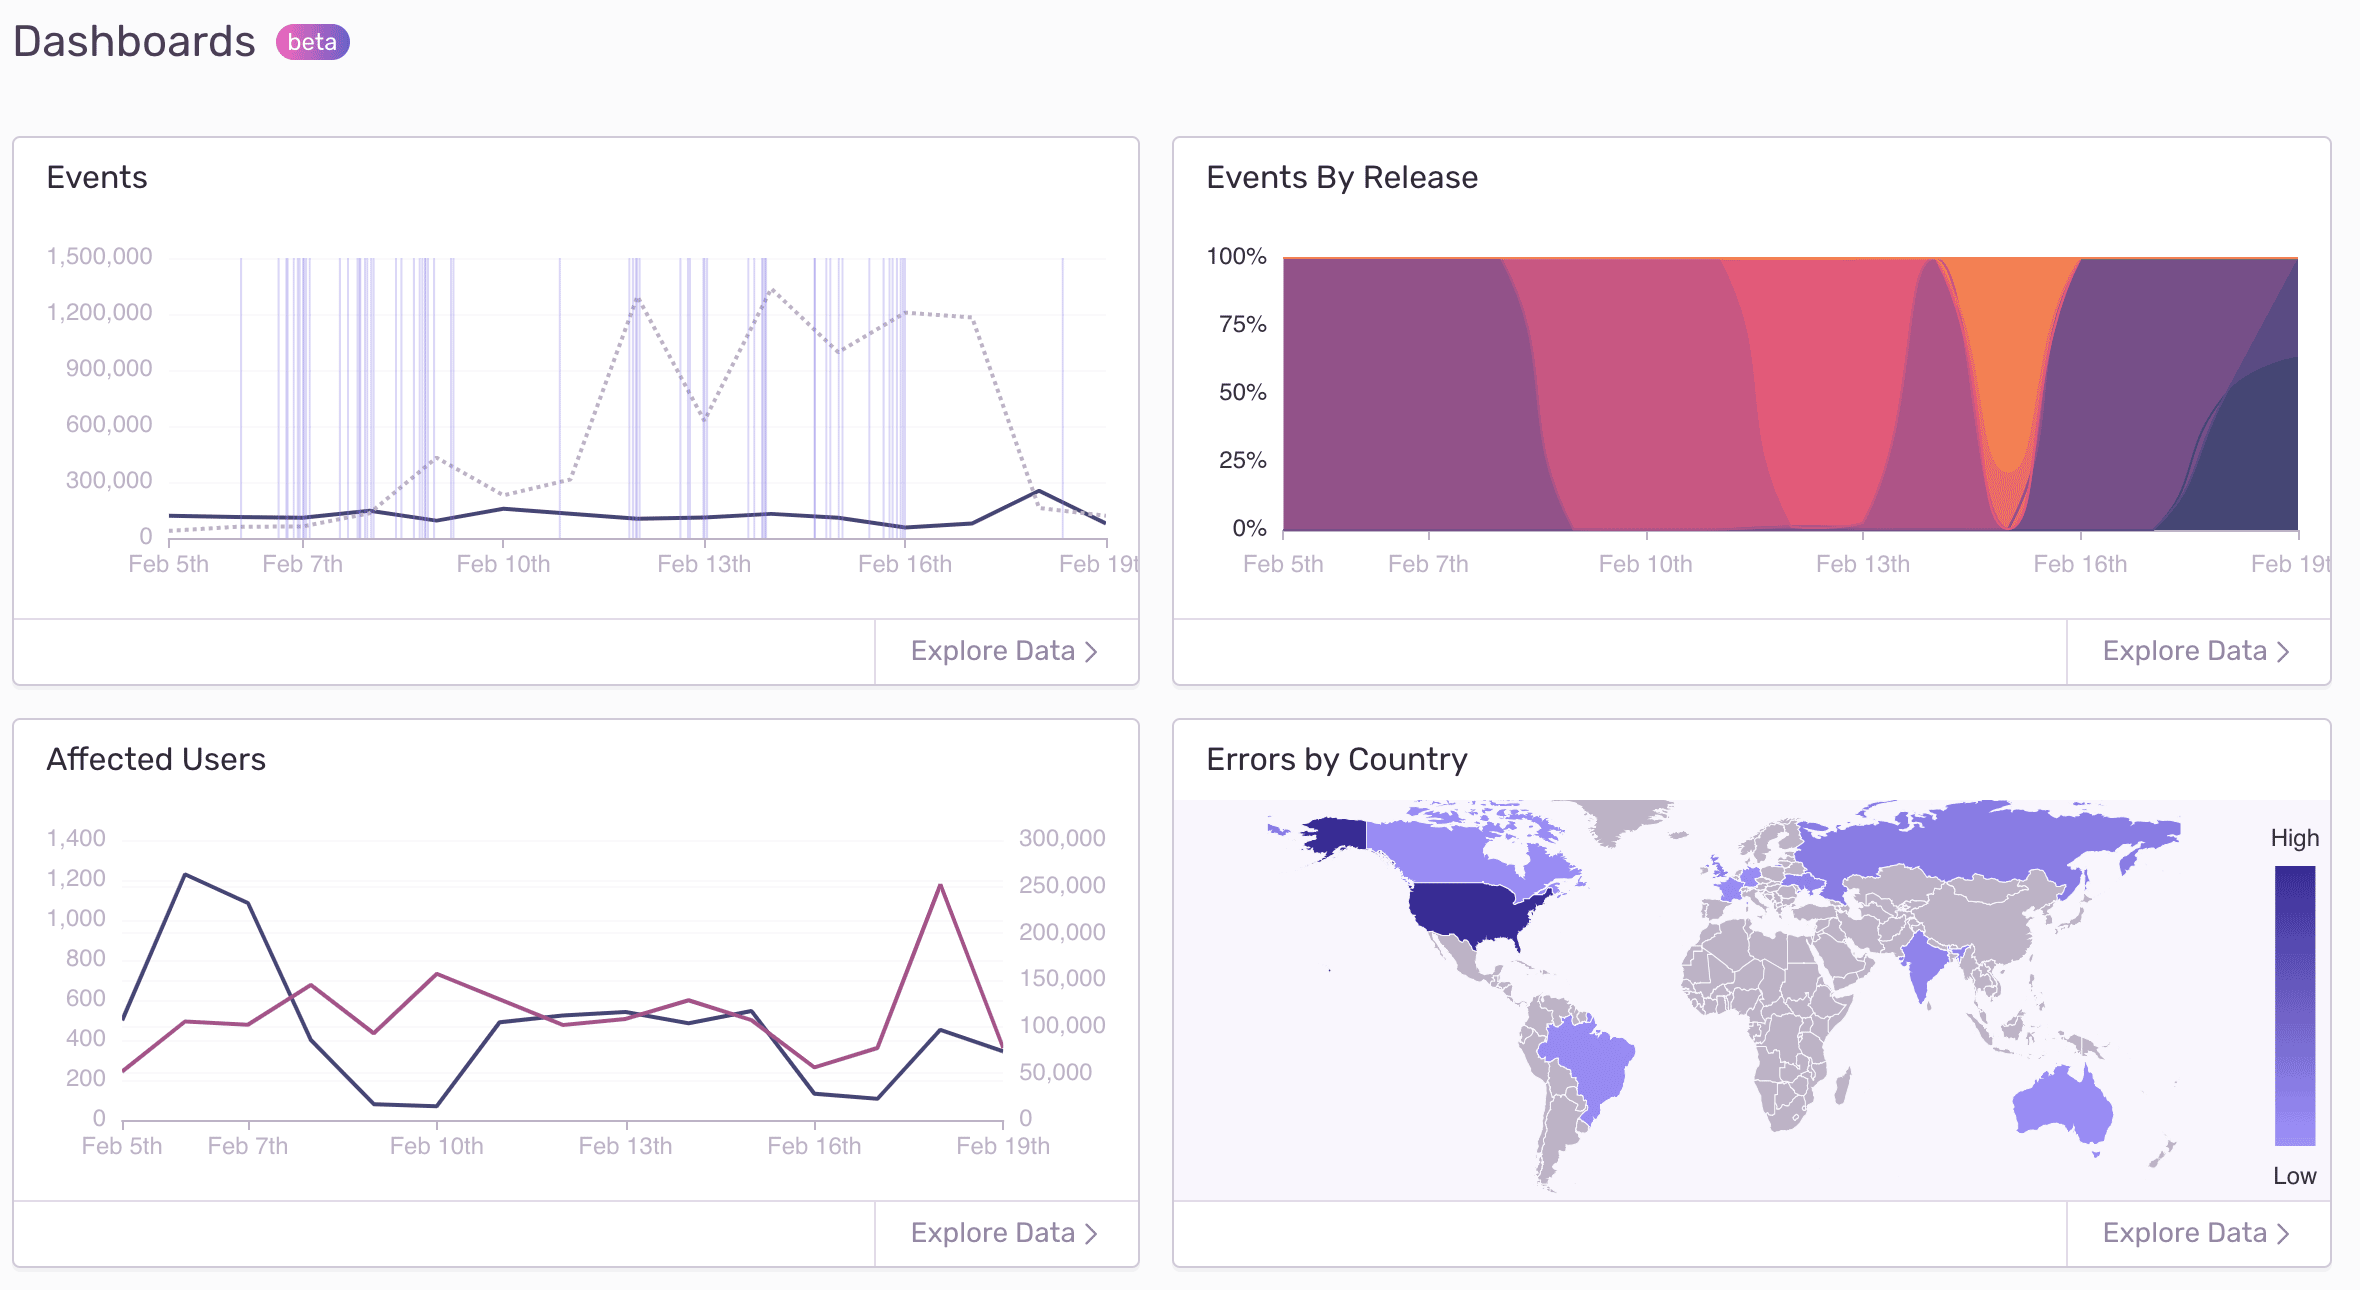
Some people do better with visuals than with lists — this feature is for those people. Dashboards give you a data visualization of errors throughout your organization, including graphs of your errors, geographic mapping, and errors and events by release.
Much like the Events View, Dashboards allow you to drill into data by selecting points of interest. Filters are also persistent, so you'll see visual representations of filters applied elsewhere.
Or dig deeper into any specific visualization with Discover via links to the auto-populated queries that power Dashboards.
[[small]][[italic]]Dashboards is available on Business plan. Want to try the Dashboards today? Trial the Business plan.[[/italic]][[/small]]
New navigation capabilities
Improved navigation and persistent filters make it easier for you to find the data you're looking for, quickly. Access Issues, Releases, User Feedback, and Settings from the sidebar.

You can dive into specific projects.

Select multiple environments.
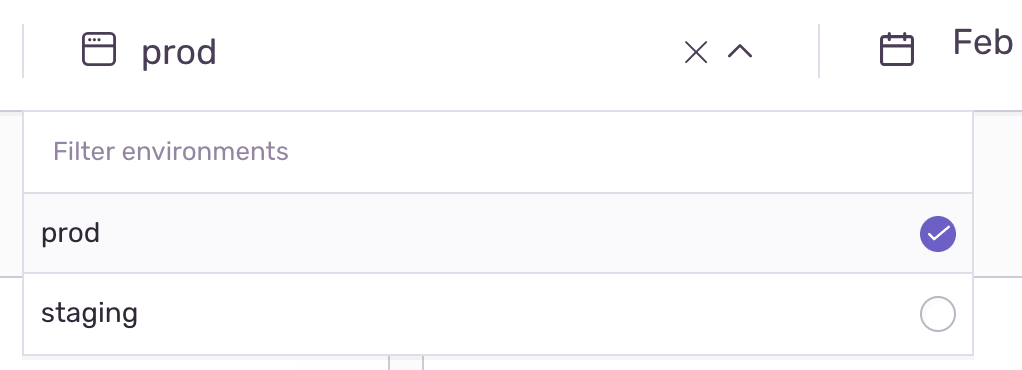
Or apply a date range filter.
We rolled out new plans in October that have slightly different pricing and feature sets. If you're on a legacy pricing plan, you'll need to choose one of the new plans to get access to some of the features listed above. See the Pricing page for more information, or go straight to your Subscription Settings to make changes.
