Performance Monitoring for Every Developer: Web Vitals & Function Regression Issues
Performance Monitoring for Every Developer: Web Vitals & Function Regression Issues
Extracting relevant insights from your performance monitoring tool can be frustrating. You often get back more data than you need, making it difficult to connect that data back to the code you wrote. Sentry's performance monitoring product lets you cut through the noise by detecting real problems, then quickly takes you to the exact line of code responsible. The outcome: Less noise, more actionable results.
Today, we’re announcing two new features to help web, mobile, and backend developers discover and solve performance problems in their apps: Web Vitals and Function Regression Issues.
Web Vitals: From performance scores to slow code
Web Vitals unify the measurement of page quality into a handful of useful metrics like loading performance, interactivity, and visual stability. We used these metrics to develop the Sentry Performance Score, which is a normalized score out of 100 calculated using the weighted averages of Web Vital metrics.
The Sentry Performance Score is similar to Google’s Lighthouse performance score, with one key distinction: Sentry collects data from real user experiences, while Lighthouse collects data from a controlled lab environment. We modeled the score to be as close to Lighthouse as possible while excluding components that were only relevant in a lab environment.
Web Vitals identify the biggest opportunities for improvement
To improve your overall performance score, you should start by identifying individual key pages that need performance improvements. To simplify this and help you cut to the chase, we rank pages by Opportunity, which indicates the impact of a single page on the overall performance score.
In this example, the highest opportunity page in Sentry’s own web app is our Issue Details page. Since this is the most commonly accessed page in our product, improving its performance would significantly improve the overall experience of using Sentry.
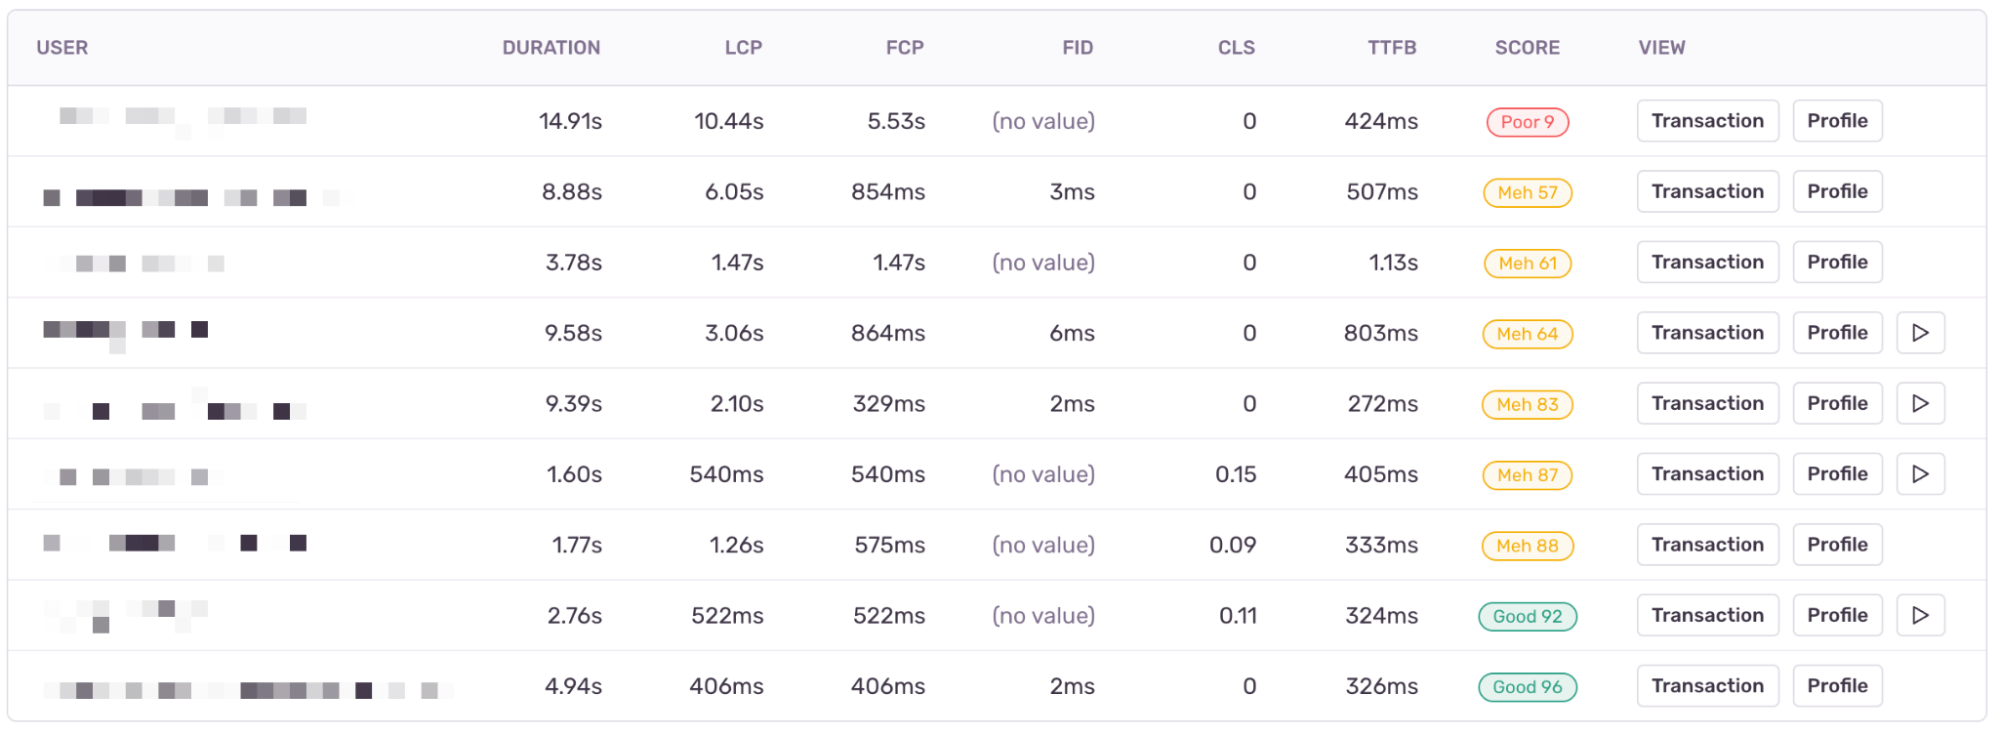
After identifying a problematic page, the next step is to find example events where users had a subpar experience. Below, you’ll see events that represent real users loading our Issue Details page, with many experiencing poor or mediocre performance:
In the above screenshot, you’ll see a user that experienced a performance score of 9 out of 100 (Poor), primarily driven by a 10+ second Largest Contentful Paint (LCP). Ouch. These worst-case events highlight performance problems not evident during local development or under ideal conditions (e.g. when users have a fast network connection, a high-spec device, etc.).
You’ll notice some of these events have an associated ▶️ Replay. When available, these let you see a video-like reproduction of a user’s real experience with that page. When optimizing your app’s performance, these replays can help you understand where users have a subpar experience–for example, when they struggle with 10-second load times.
Span waterfalls highlight your most expensive operations
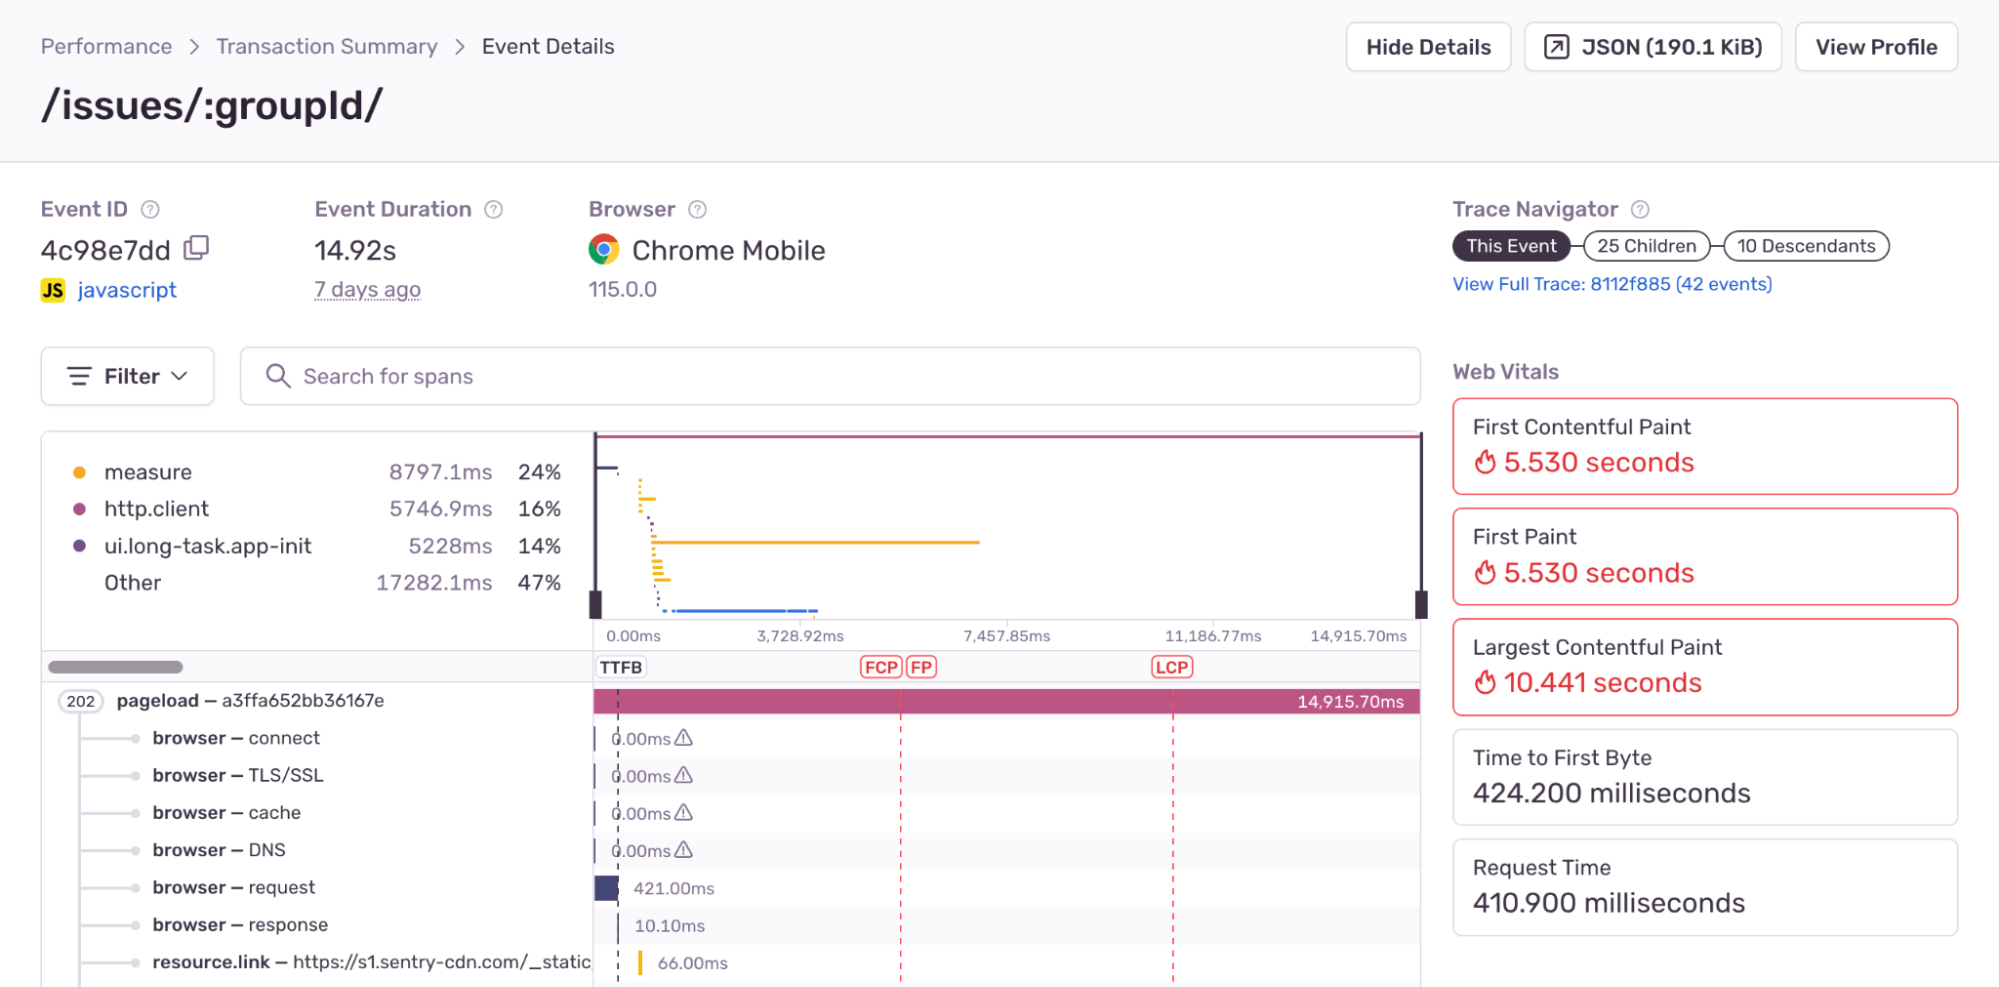
To find out what caused the slow LCP, you can click the event’s Transaction button, which provides a detailed breakdown of the operations that occurred during page load. We call these operations spans.
The most relevant spans are the ones that occur before the red LCP marker, as these spans are potentially LCP-blocking. Spans that occur after the LCP marker still impact overall page performance, but do not impact the initial page load.
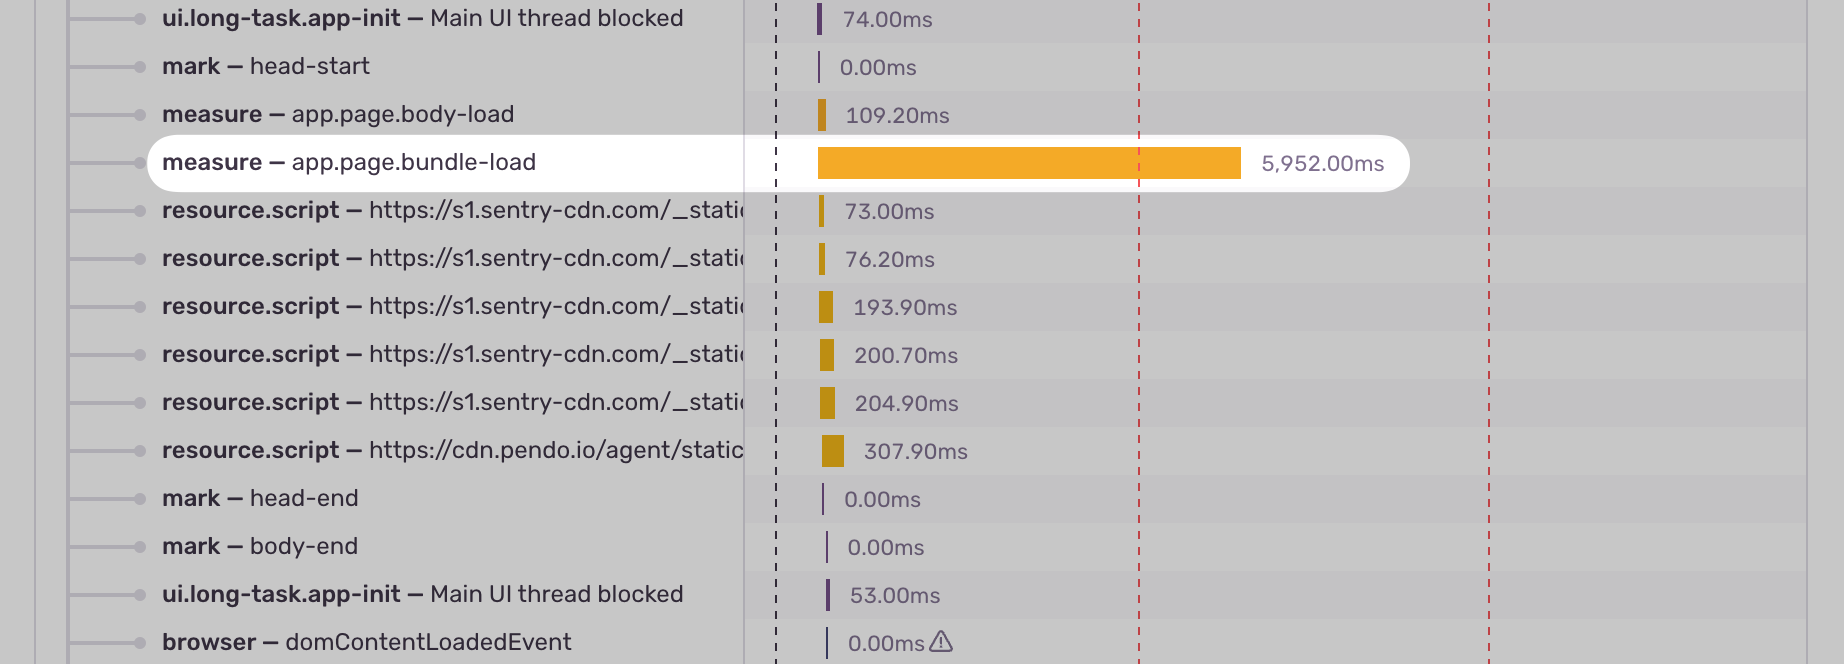
The first span that looks like a clear performance bottleneck is the app.page.bundle-load span, which measures how long it takes to load the JavaScript bundle. In this case, loading the bundle alone takes almost 6 seconds or about 60% of our total LCP duration.
The JavaScript bundle load time depends primarily on its size; reducing the bundle size would significantly improve page load speed. But, even if we reduced bundle load time by 50%, LCP would only drop from 12 to 7 seconds — which means we need to look for additional optimization opportunities.
The next clear opportunity is this ui.long-task.app-init span taking almost 1 second. Long task spans represent operations over 50 milliseconds where the browser is executing JavaScript code and blocking the UI thread. Since this is a pure JavaScript operation, let’s go deeper and find out what’s going on.
Browser Profiling takes you to the line of code responsible
Identifying the code causing a long task has traditionally been difficult, as you must reproduce the issue in a development environment with access to a profiler. To solve this, Sentry has launched new support for collecting browser JavaScript profiles in production (on Chromium-based browsers). This lets you debug real user issues and collect a wide range of sample profiles across your user base.
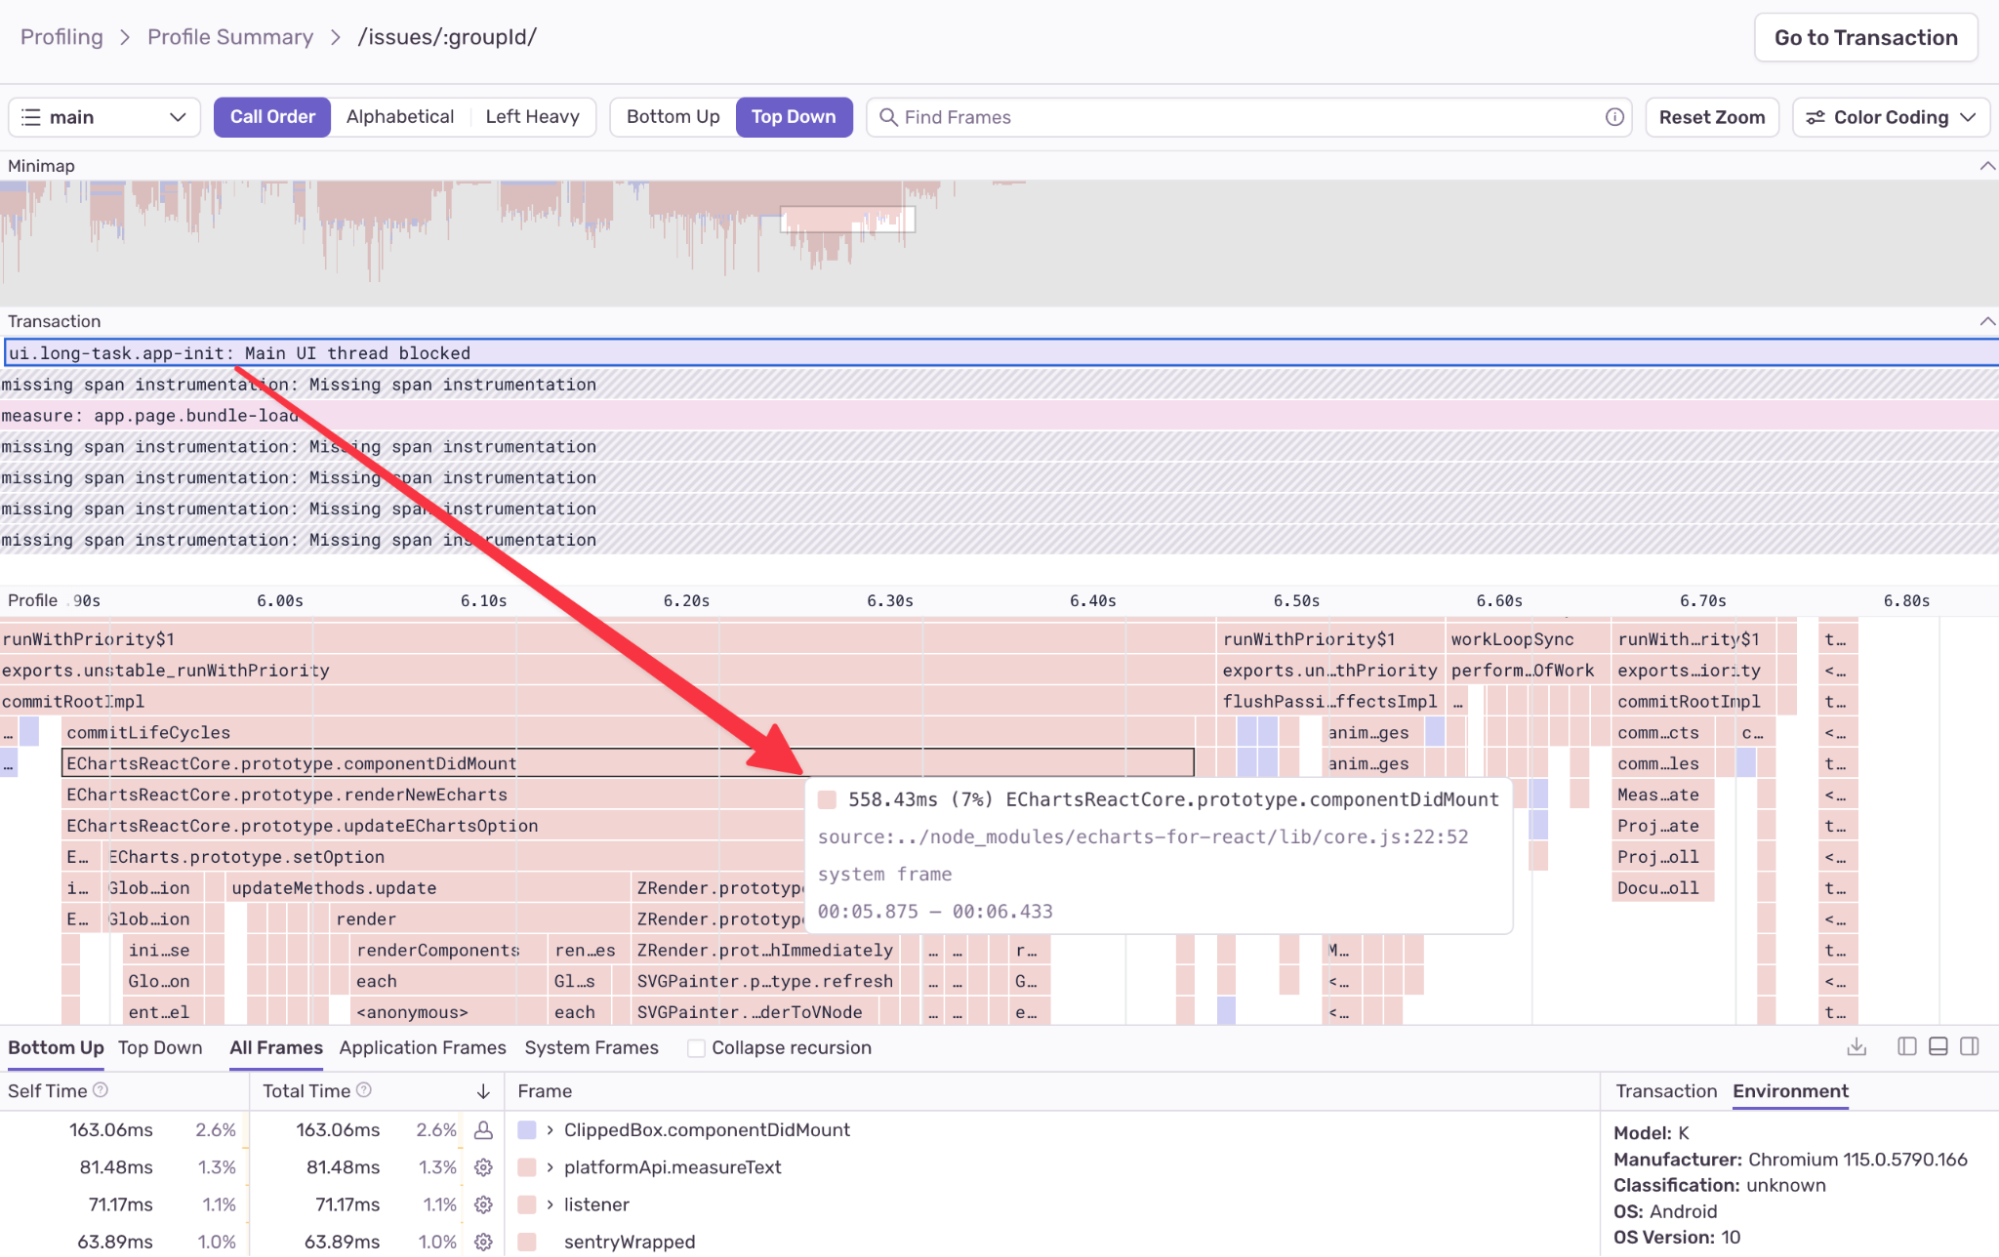
In this example, we can open the profile associated with the page load event and see the code that executed during the ~1-second long task span:
The EChartsReactCore.prototype.componentDidMount function takes 558 ms to execute, which is over half the duration of the long task span. This function is linked to a React component that renders a chart, provided by the open-source ECharts visualization library. This looks exactly like where we should focus our attention if we hope to bring our Issues Details pageload times down.
In summary, we first identified a page with a poor performance score, then determined that reducing the JavaScript bundle size and optimizing a specific React component could significantly improve the performance of our Issue Details page. By finding pages with high opportunity scores, breaking down page load events, and diving deep into JavaScript performance with profiles, you can enhance your product’s overall user experience.
Web Vitals are available to Sentry customers today. Profiling for Browser JavaScript is also now available in beta.
Function Regression Issues: more than just alerts
Recently, we launched the ability to view the slowest and most regressed functions across your application. Now, we can help you debug function-level regressions with a new type of Performance Issue. Function Regression Issues notify you when a function in your application regresses, but they do more than just detect the regression— they use profiling data to give you essential context about what changed so you can solve the problem.
Function Regression Issues can be detected on any platform that supports Sentry Profiling. Below, we’ll walk through a backend example in a Python project.
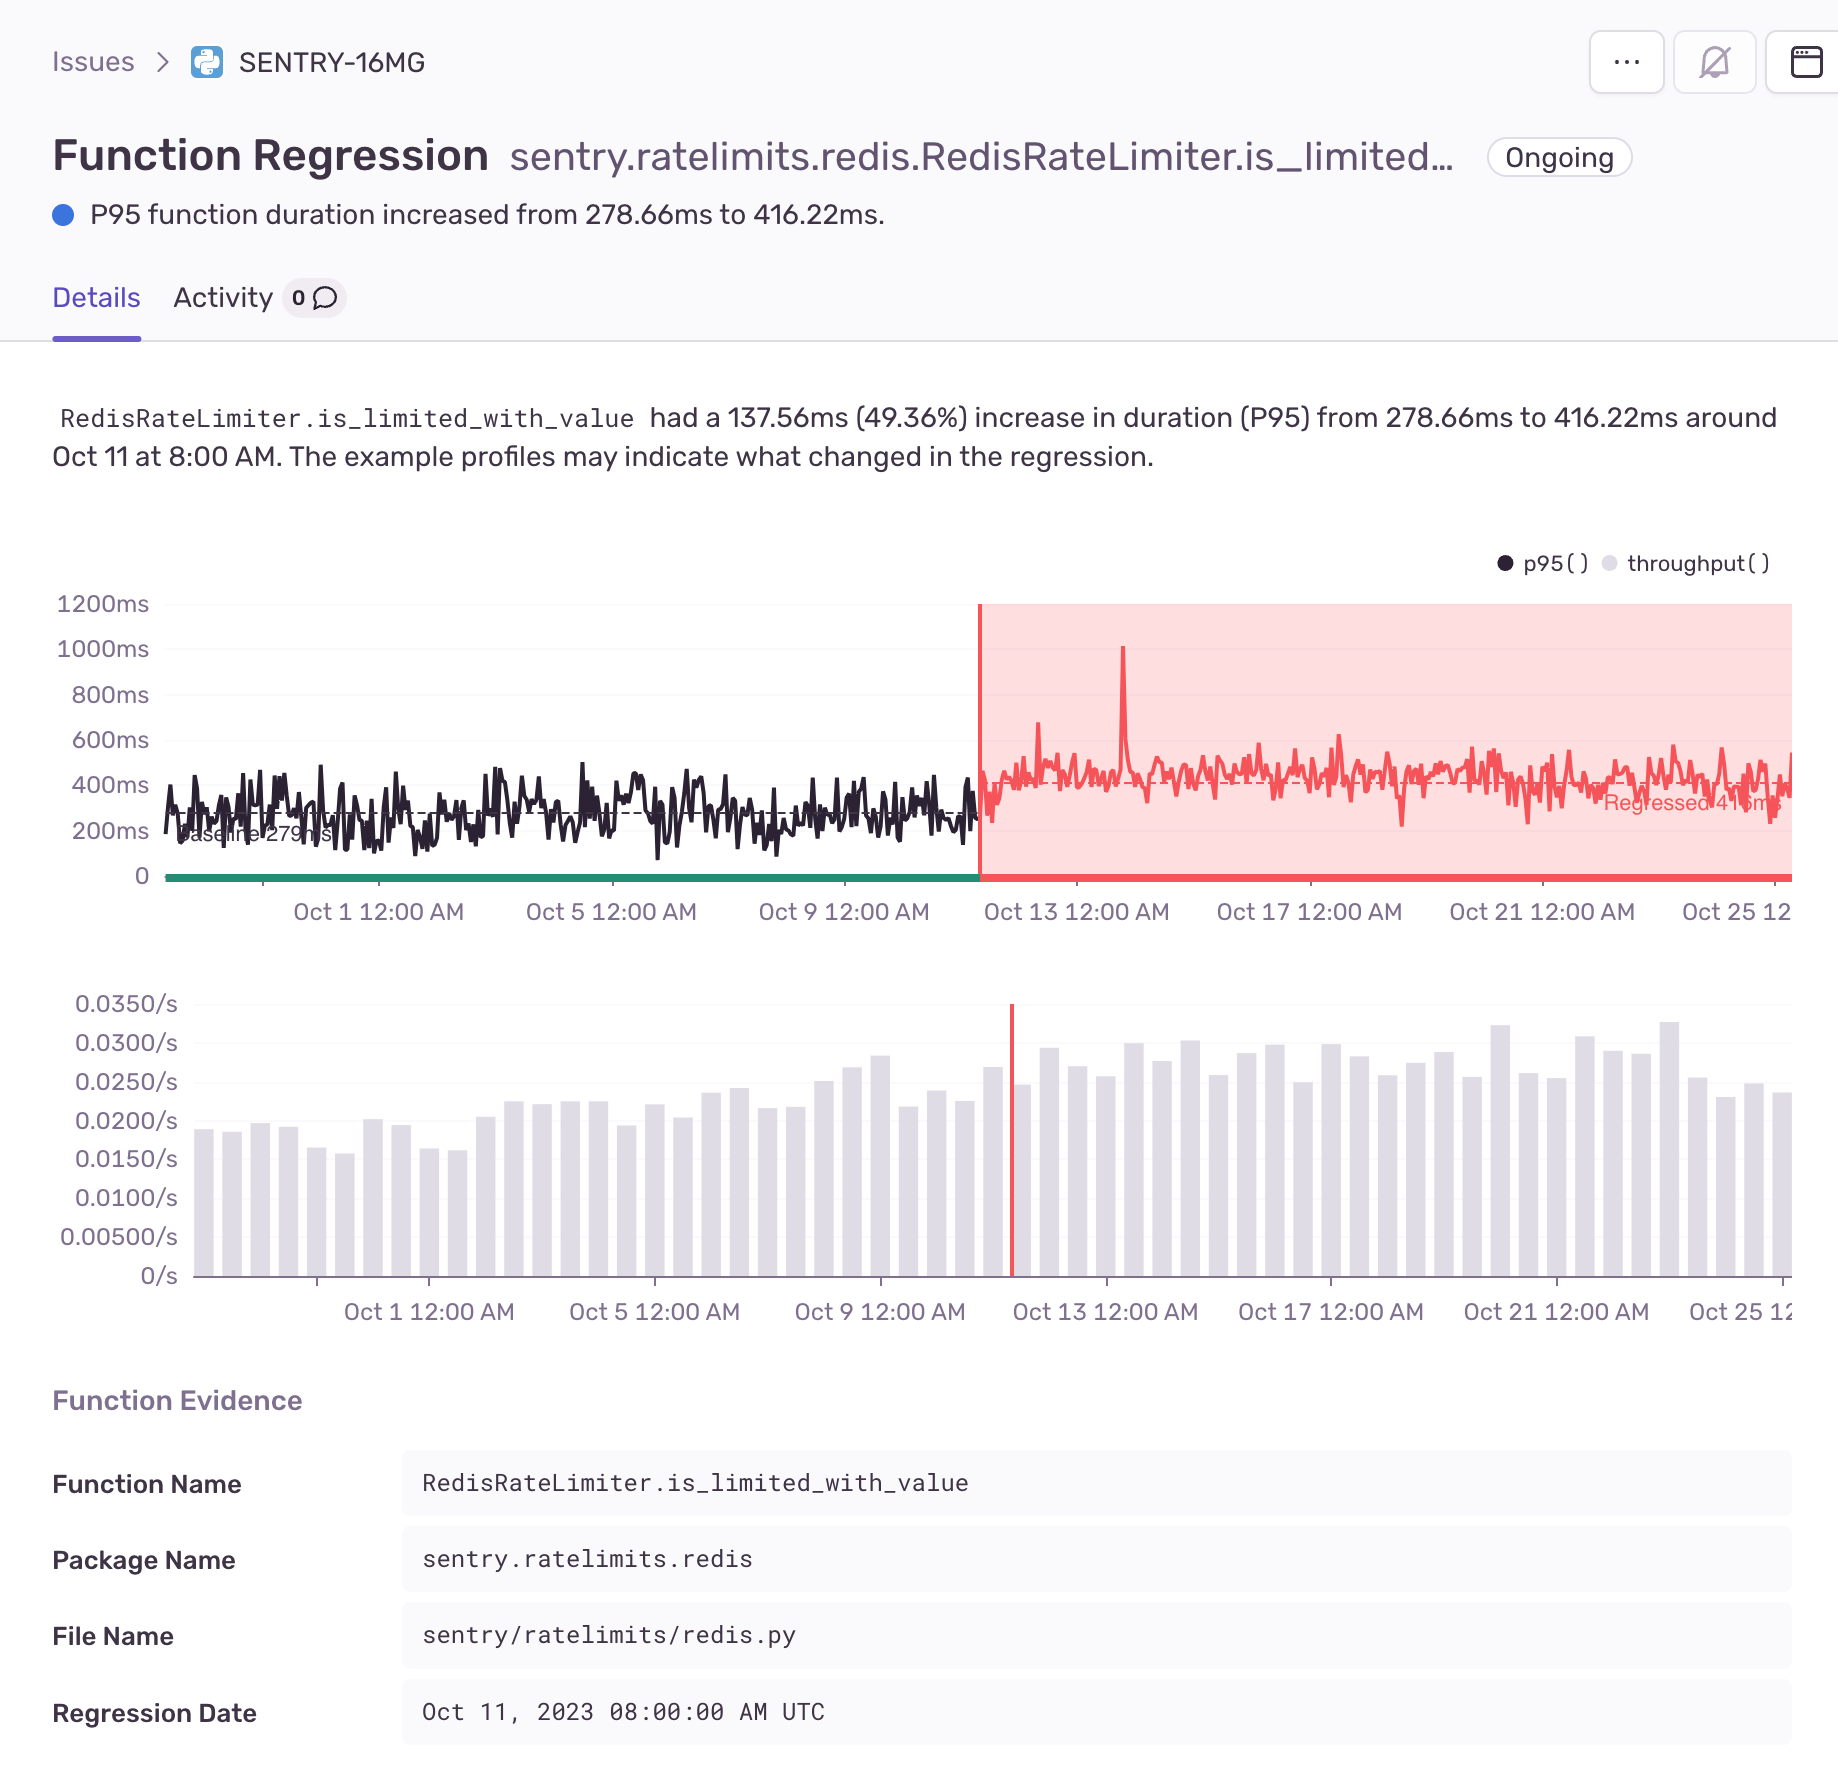
The screenshot above is a real Function Regression Issue that identified a slowdown in Sentry’s live-running server code. It triggered because the duration of a function that checks customer rate limits stored in Redis regressed by nearly 50%.
The top chart shows how function duration changed over time, while the bottom chart shows the number of invocations (throughput). You’ll notice that throughput also appears to increase during the slowdown period. This suggests that increased load might be one of the causes of this regression.
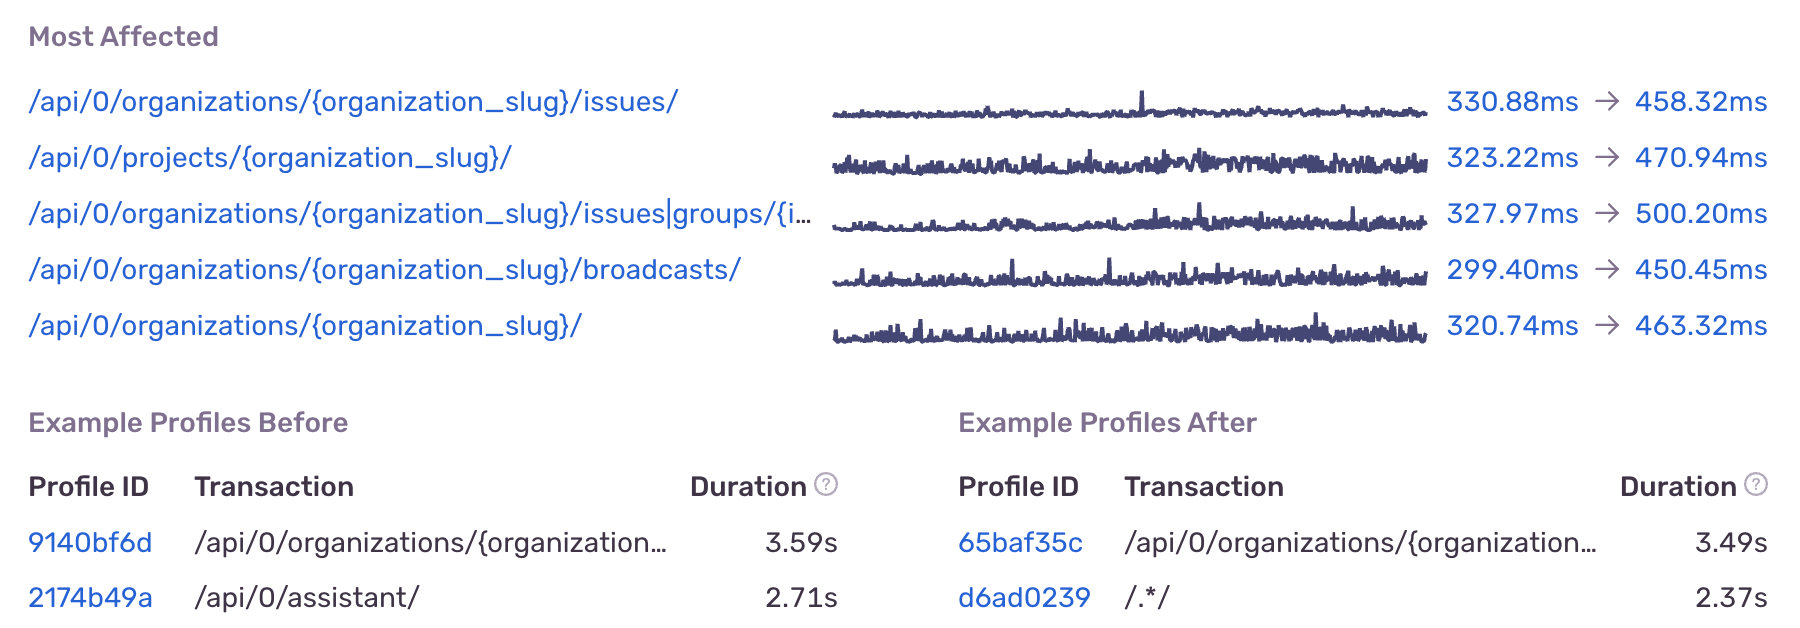
In the screenshot above, you’ll see that the same issue gives us other essential information like which API endpoints were impacted by the regression and how much they regressed. This data reveals that the rate-limiting function was widely used and called by many of our endpoints, resulting in a significant regression in overall backend performance.
Jump from Regression Issues to Profiles to find the root cause
The Function Regression Issue makes it easy to see the example profiles captured before and after the regression — they’re displayed right under the “Most Affected” endpoints. Comparing these profiles gives the most crucial context, revealing (at a code level) the change in runtime behavior that caused the regression.
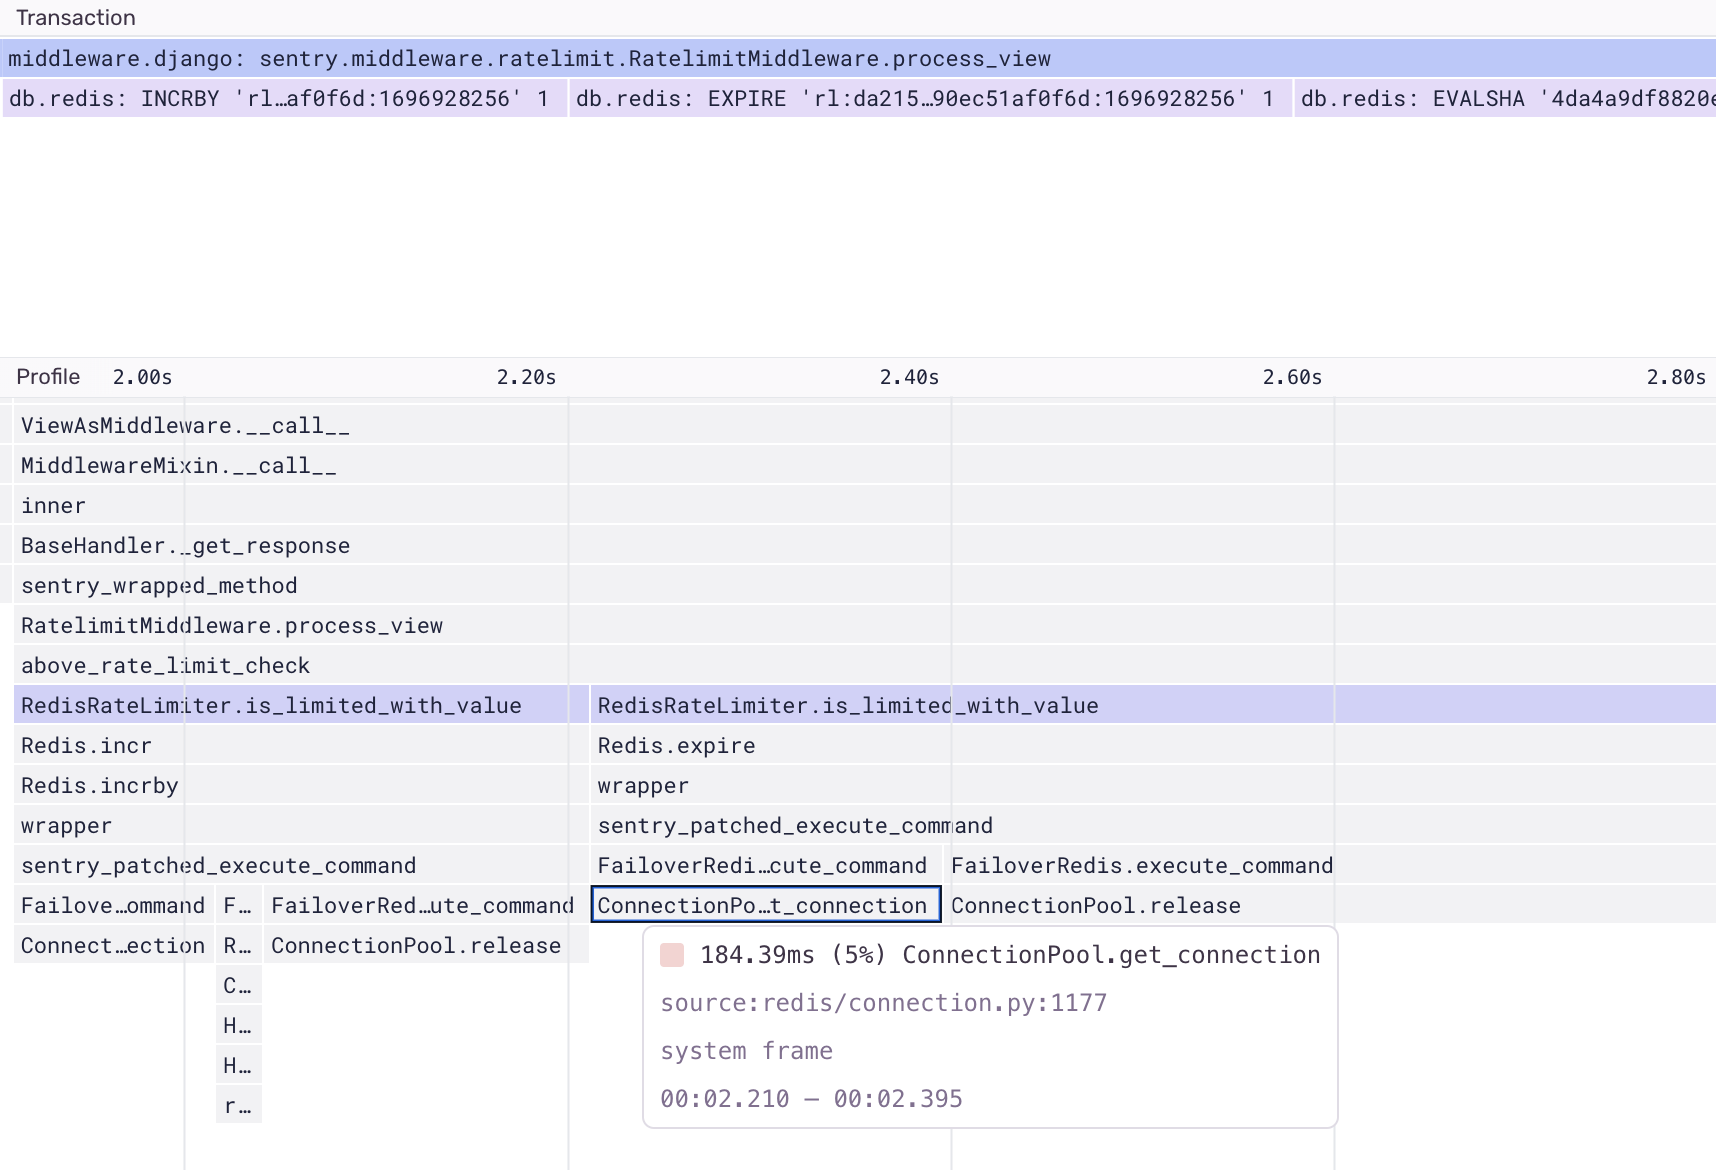
Here, we looked at an example profile event that was captured before the regression occurred. We noticed that our regressed function calls into two functions within the third-party redis module: ConnectionPool.get_connection and ConnectionPool.release.
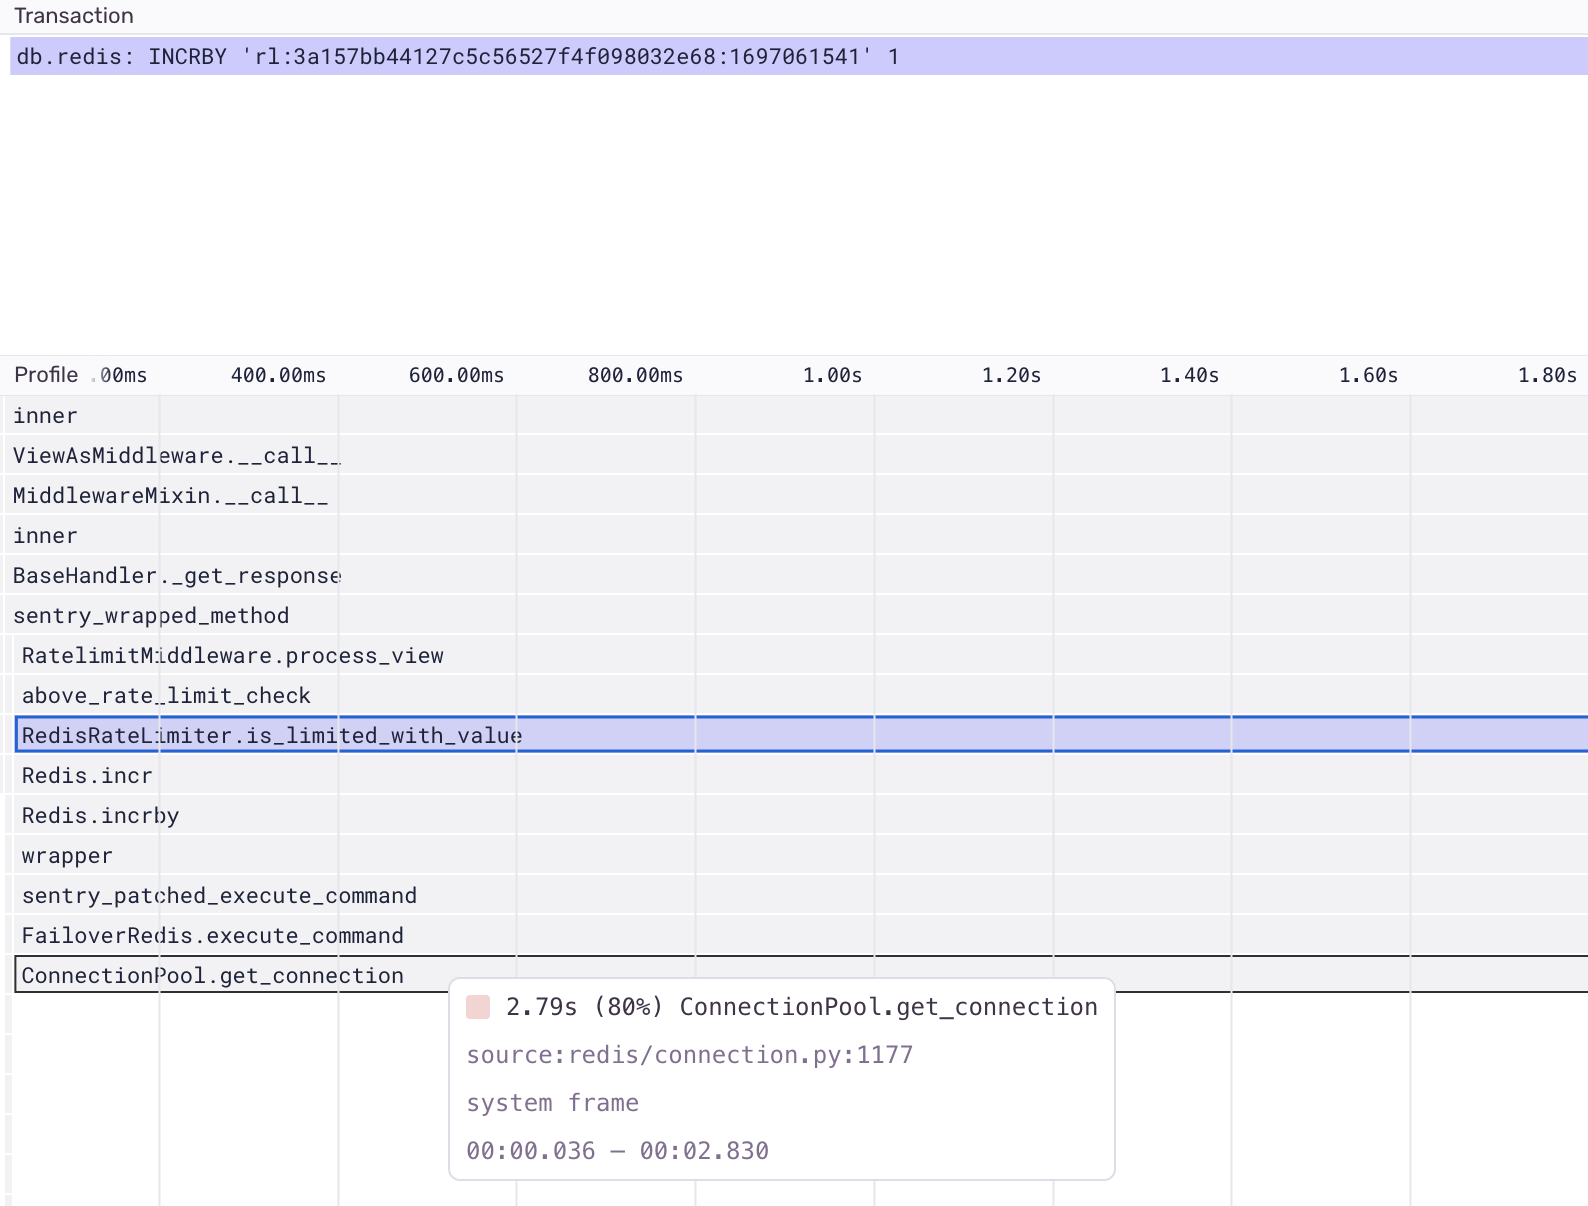
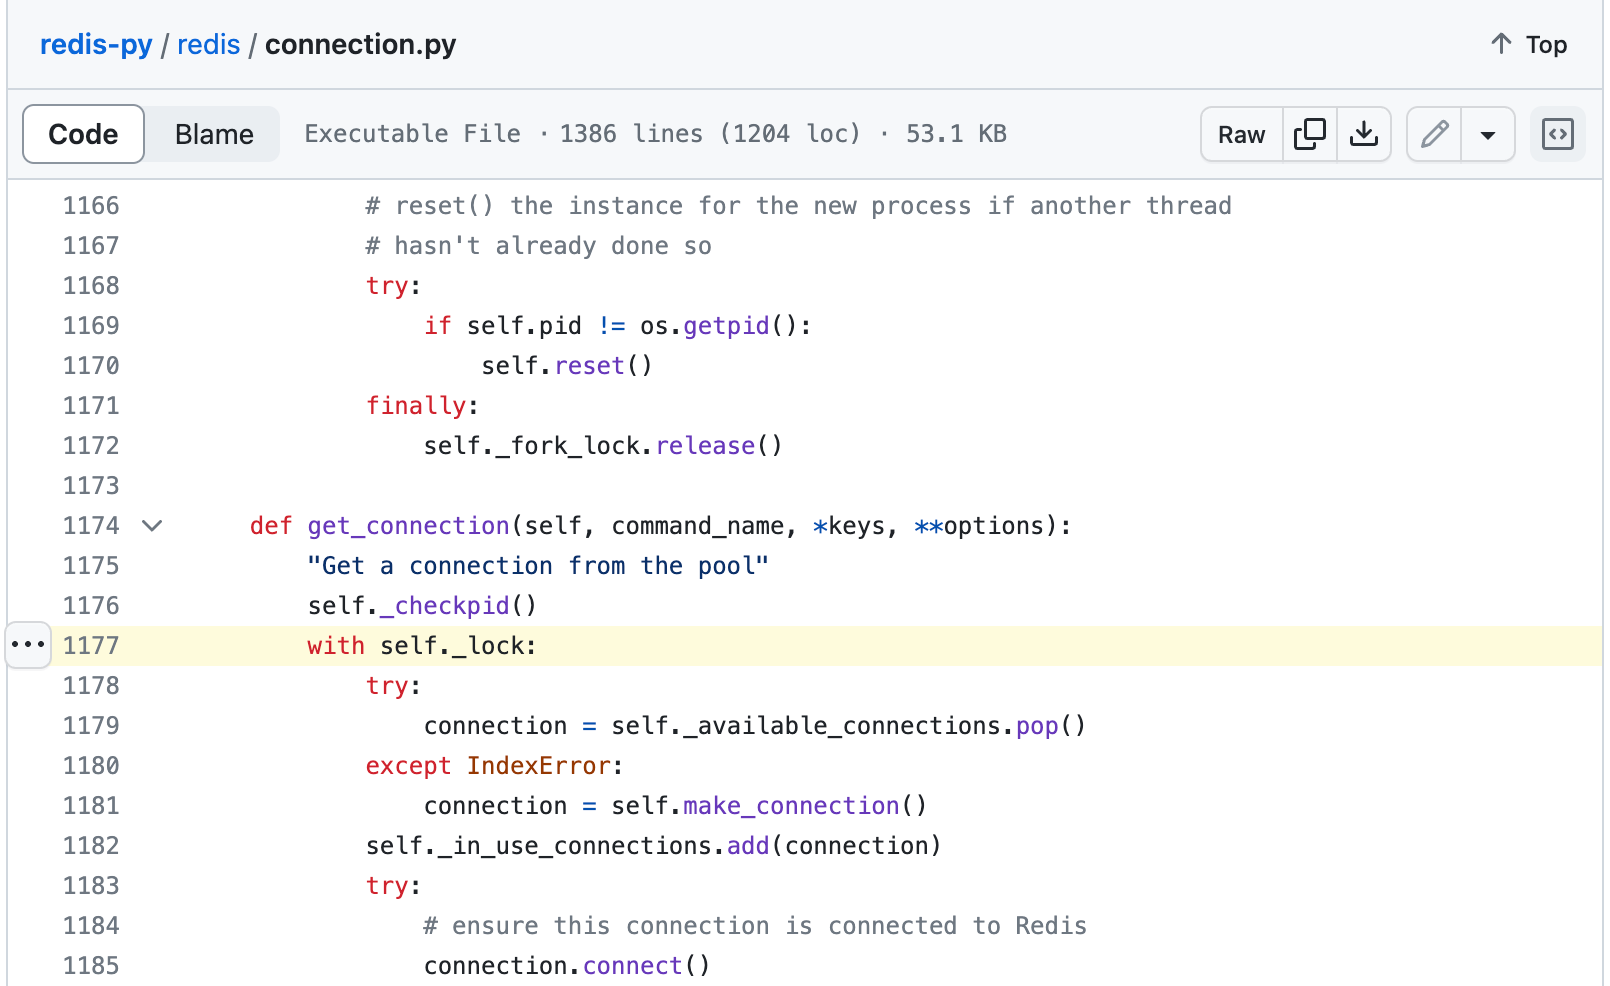
We compared this to a profile collected after the regression and noticed that one of those two functions, ConnectionPool.get_connection, was taking significantly longer than before. Each function frame in a profile offers source context for where the function was defined and the executed line number. In this case, opening this source location in the redis module yielded the following line:
This line attempts to acquire a lock — and the significant wall-time duration increase when executing this line suggests that multiple processes or threads are trying to acquire the lock simultaneously. This lock contention is the code-level reason for the regression.
This lock contention issue also aligns with what we saw earlier in the throughput graph – increased throughput makes contention more likely. Through additional investigation, we discovered that the increased throughput for this function corresponded to an increase in the number of Redis connections starting around the time of the regression; our next step is to isolate the source of the additional connections.
Using this example, we’ve illustrated how Function Regression Issues can help you link performance regressions directly to the code causing the regression with profiling data. While this specific example focused on a backend use case, this capability works on any platform that supports Sentry Profiling.
Function Regression issues are available today to Early Adopters and will become generally available over the next 2 weeks.
Conclusion
A high-performance bar is critical for building differentiated products that people want to use. With Web Vitals and Function Regression Issues, we’ve provided more ways for all developers to solve performance problems by connecting them to code.
Tune in for more exciting product announcements with Sentry Launch Week. To set up Sentry Performance today, check out this guide. You can also drop us a line on Twitter or Discord, or share your Web Vitals feedback with us on GitHub.
And, if you’re new to Sentry, you can try it for free or request a demo to get started.


