Application Profiling for Python
Application Profiling for Python
Profiling is an important tool in every developer’s toolkit because it provides a granular view into the execution of your program from your production environment. This is an important concept, as performance bottlenecks can often be very hard or even impossible to reproduce locally due to external constraints or loads only seen in a production environment.
Python is one of the most popular programming languages available, and it is one of the core technologies we use at Sentry. Today, we are excited to announce that the alpha release of Python profiling is available for WSGI applications in sentry-sdk==1.11.0 to provide code-level insights into your application’s performance in production. Profiling is free to use while in alpha -- we'll post updates on our progress on social and Discord when we get closer to GA.
To get started with Python profiling, simply set the profiles_sample_rate on the SDK.
sentry_sdk.init(
dsn="https://examplePublicKey@o0.ingest.sentry.io/0",
traces_sample_rate=1.0,
_experiments={
"profiles_sample_rate": 1.0,
},
)Under the hood, the SDK runs a separate thread capturing samples at a sampling frequency of ~100Hz. At the end of a profile, the samples are sent to Sentry where the profile is visualized as a flame graph. Flame graphs allow the user to quickly spot hot code paths and optimize resource consumption (e.g. CPU) at endpoints or in slow traces.
Improving Sentry with Sentry Profiling
We have been running an internal version of the Python profiler on Sentry for some time now, and we’ve been able to optimize Sentry using it.
Working with Date Times
Everyone loves a good time series, and we do too. That’s why we have time series graphs in various parts of Sentry. But we’ve noticed that sometimes the time series take a long time to generate.
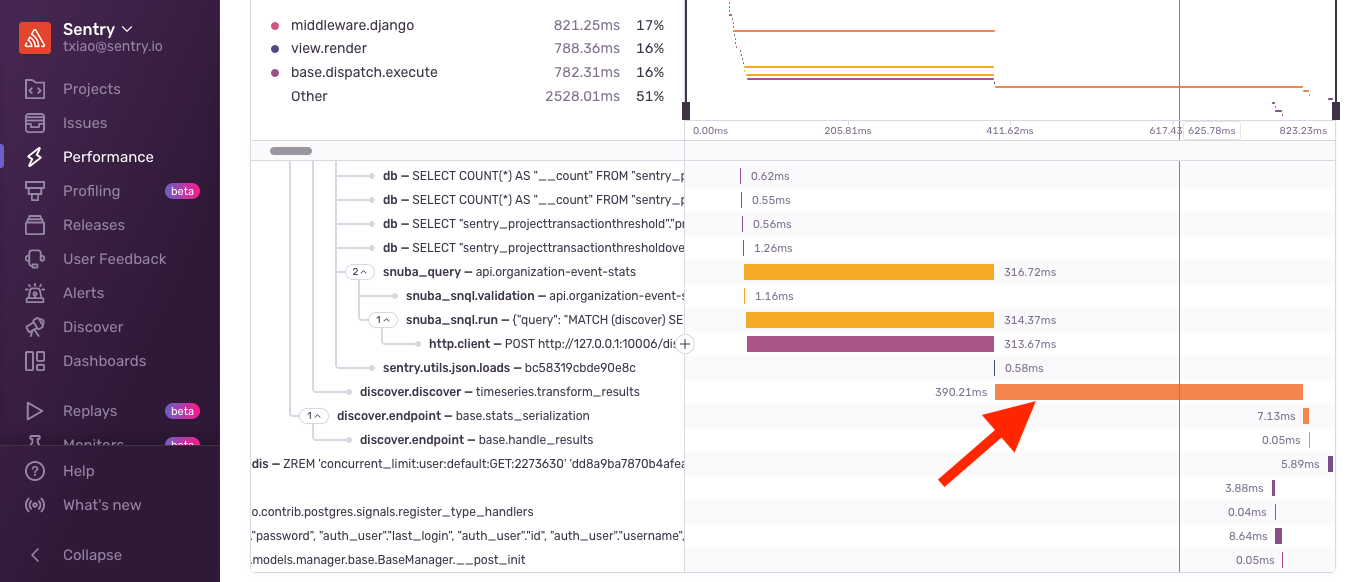
While investigating this delay, we were able to identify that the most likely candidate was the discover.discover - timeseries.transform_results using our suspect spans feature. And with further investigation, we realized that while this function is usually pretty fast, it can get really slow — in this case, hundreds of milliseconds slow. This meant it was slower than the query to get the data!
The post-processing is actually slower than the query!
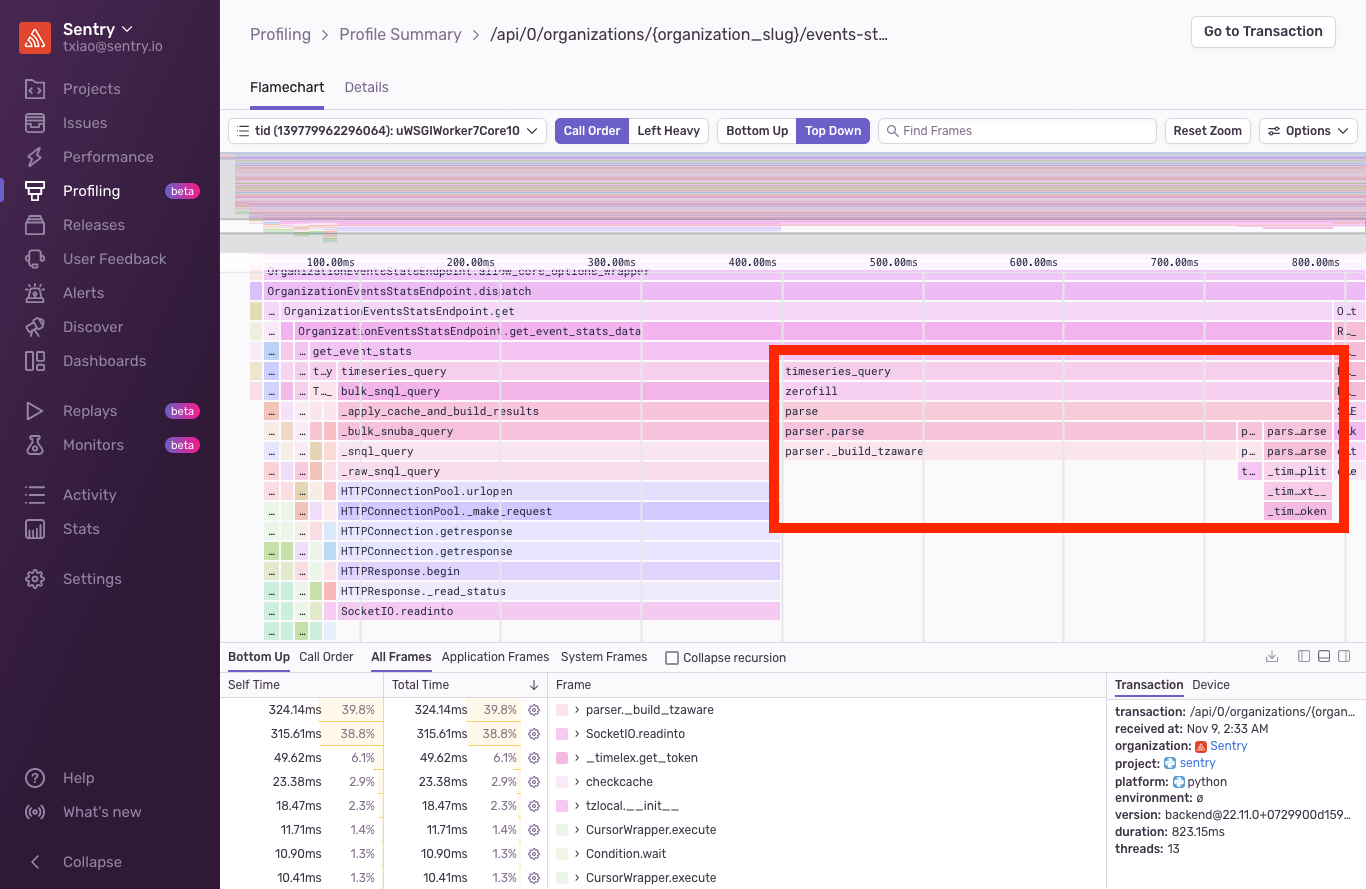
Looking at the code, it was just iterating through the results and doing simple transformations. It wasn't immediately clear what was going on, but the profile revealed that almost half of the request was parsing dates inside of the zerofill function.
It was the date time parser inside of the zerofill!
This finding surprised us. Naturally, we did some simple benchmarking to verify the findings and compared a few ways of parsing date time strings.
>>> from dateutil import parser
>>> from datetime import datetime
>>> from timeit import timeit
>>>
>>> ts = "2022-11-09T16:15:00+00:00"
>>>
>>> number = 1_000_000
>>>
>>> print(timeit("parser.parse(ts)", number=number, globals=globals()))
85.08067758600001
>>>
>>> print(timeit("datetime.strptime(ts, '%Y-%m-%dT%H:%M:%S+00:00')", number=number, globals=globals()))
9.526757356999994
>>>
>>> print(timeit("datetime.fromisoformat(ts)", number=number, globals=globals()))
0.1656539809999913
The difference shocked us. Changing from dateutil.parser.parse to datetime.datetime.fromisoformat made it potentially hundreds of times faster!
Now, datetime.datetime.fromisoformat isn't a complete ISO 8601 parser source (not until Python 3.11 anyways), but we were satisfied with the inverse of datetime.datetime.isoformat. Making this simple one-line change, we saw that the worst case significantly improved.
Django: To prefetch or not to prefetch
Prefetching is a common technique employed in Django to prevent excessive database queries caused by accessing related objects. Instead of making one query per object when it’s accessed, prefetching allows us to make a single query to fetch all the related objects at once.
We employ this very technique in various places in Sentry. However, on the users endpoint, we noticed that it was still very slow despite us doing the necessary prefetching on the various related objects.
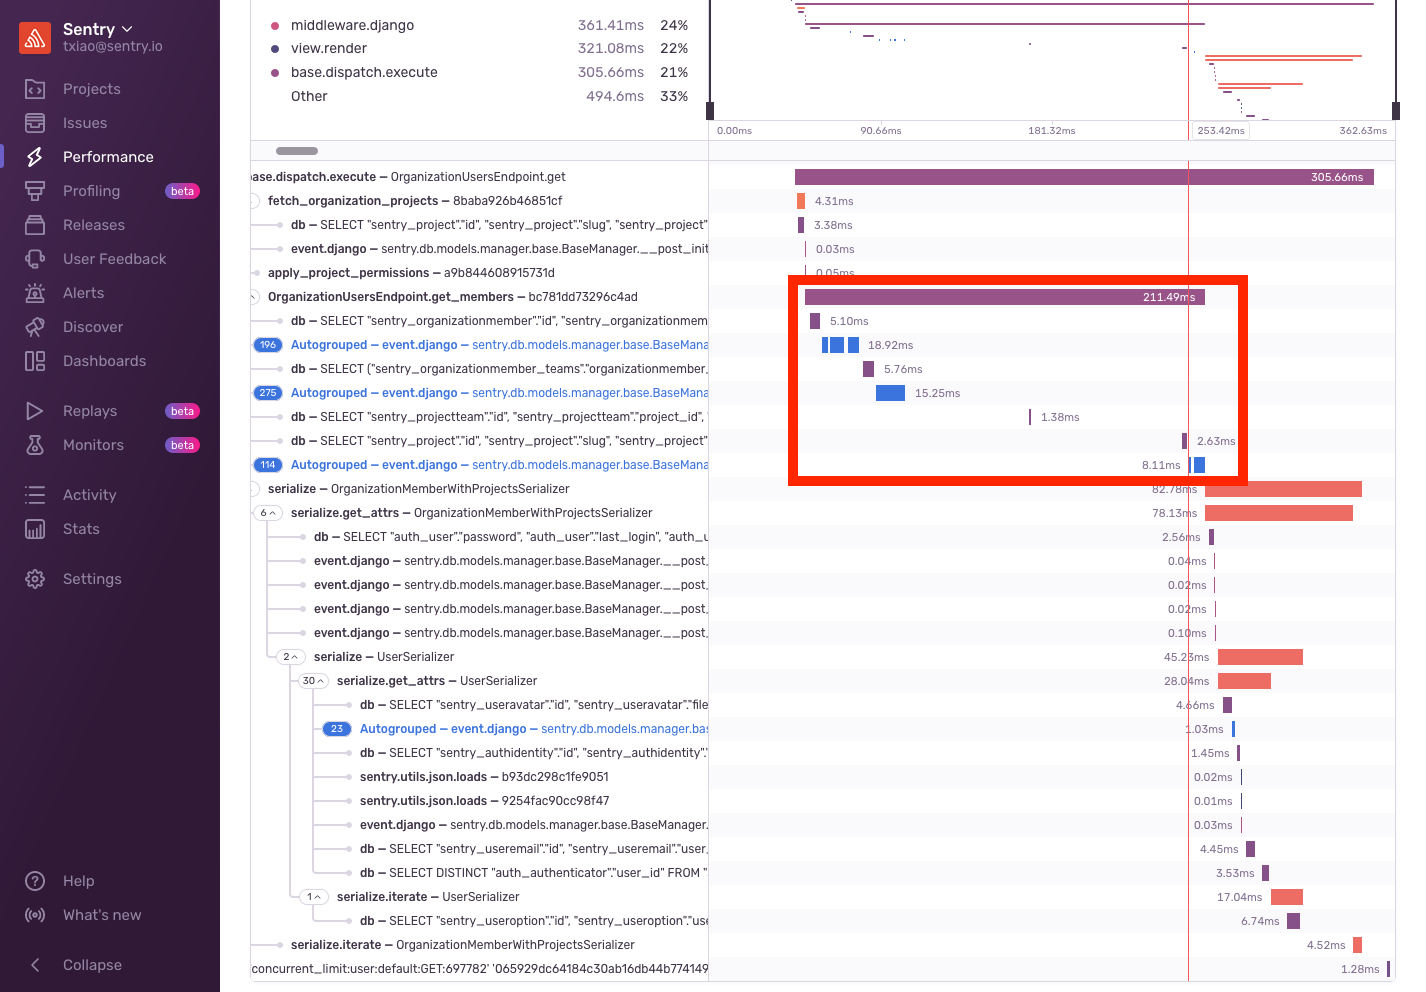
Looking at some example transactions, we saw something interesting. There were a few periods of time where we have no instrumentation. Most interestingly, they were scattered in between some db spans.
Digging into the code, we realized that these db spans corresponded to the following query. The first query is for OrganizationMember and the 3 queries that followed were for the 3 lookups specified within the prefetch_related.
OrganizationMember.objects.filter(
    user__is_active=True,
    organization=organization,
    id__in=OrganizationMemberTeam.objects.filter(
        team_id__in=ProjectTeam.objects.filter(project_id__in=projects)
        .values_list("team_id", flat=True)
        .distinct(),
    ).values_list("organizationmember_id", flat=True),
)
.select_related("user")
.prefetch_related(
    "teams", "teams__projectteam_set", "teams__projectteam_set__project"
)
.order_by("user__email")
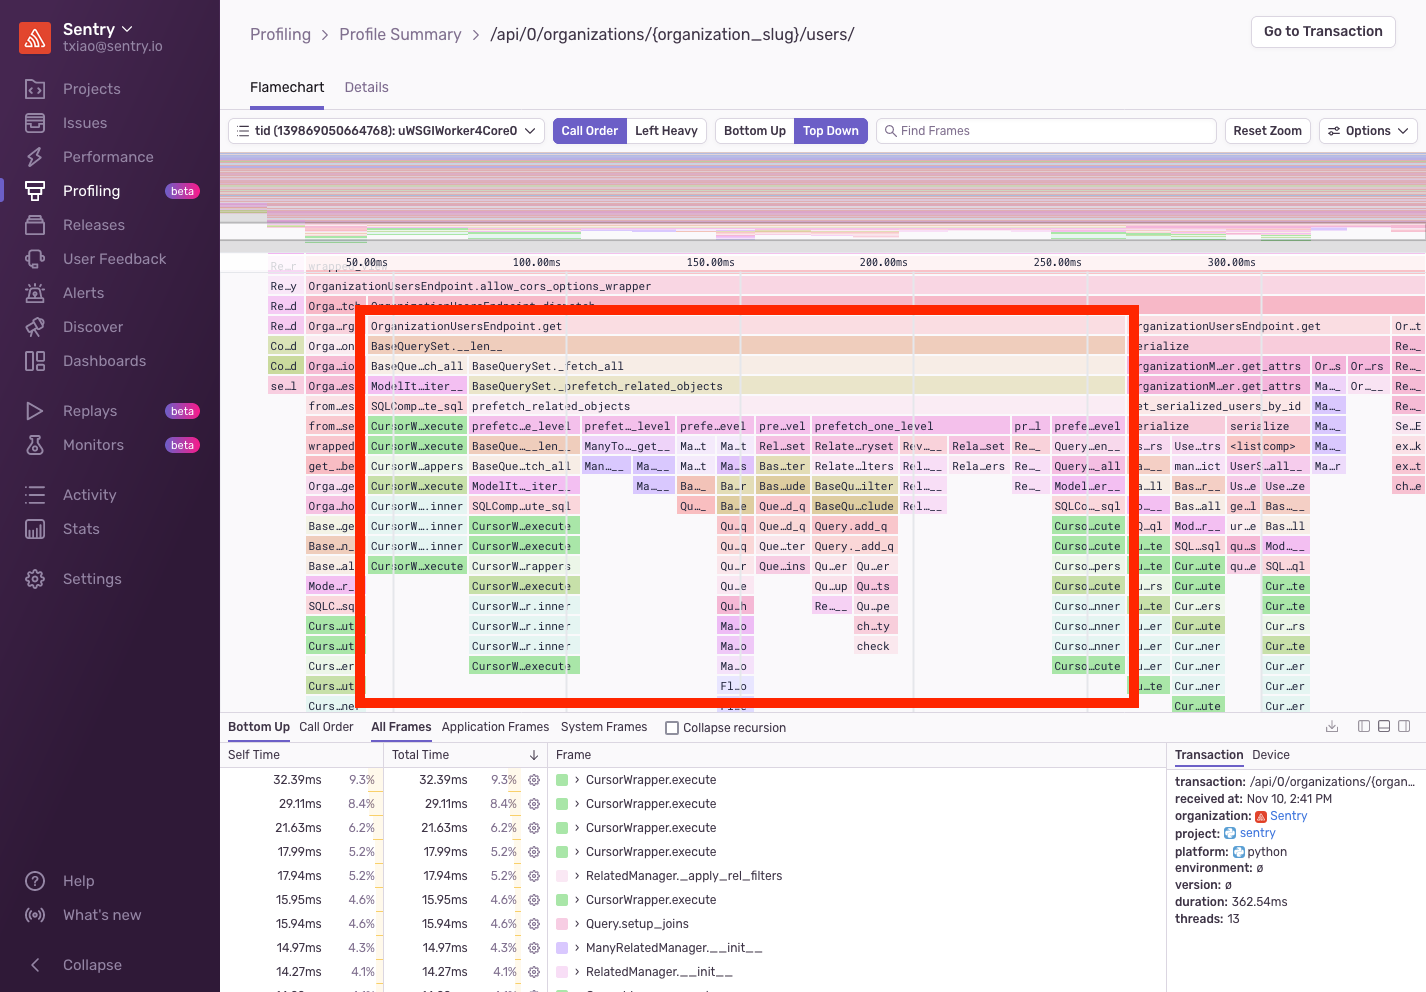
What was happening between each of these queries? Looking into the profile, we were drawn toward prefetch_related_objects, an internal Django call, which is taking up a large portion of the request.
It turns out that we were querying a many to many relationship between the OrganizationMember and Team, then from Team to Project. While the queries triggered by prefetch_related were fast, Django was performing the join in Python. This meant that even though we had only fetched a handful of teams and projects, Django was iterating over every OrganizationMember, every Team, and every Project — and then setting the related object as an attribute.
With this knowledge, we set out to rewrite the queries to avoid performing this join in Python. And we were able to accomplish this by removing the prefetch_related, manually fetching the related objects, and carefully constructing the response. This decreased the p95 by nearly 50%!
Profiling complements Performance
Profiling is the perfect complement to Sentry Performance. Where Performance gives us a high-level view of the problem, profiling lets us drill down to the exact line number to fix it with ease.
To successfully profile our code, we first ensured that all our services were instrumented with Sentry’s Performance product. Because Sentry traces your latency issues across services, you’ll be able to easily correlate profiles with transactions and identify the root cause of your slow requests. Going into our Performance dashboard also helped us establish a baseline for how our application was performing — since we could clearly track our p75 durations, throughput, etc., and see how they compared prior to us implementing profiling versus after.
Get started with profiling today. Pro-tip: make sure you have Performance instrumented first (it takes just 5 lines of code).
And, as we expand Profiling to more SDK communities and users, we want to hear your feedback. Reach out in Discord or even email us directly at profiling@sentry.io to share your experience.


