React Native performance tactics: Modern strategies and tools
React Native performance tactics: Modern strategies and tools


This is a guest post by Simon Grimm, founder of Galaxies.dev, a platform dedicated to helping developers master React Native through hands-on courses, expert guidance, and personal support.
React Native performance matters more in 2025 than ever before.
With the New Architecture now stable and apps competing against lightning-fast native experiences, users expect sub-second load times and buttery-smooth 60fps interactions. A slow app doesn’t just frustrate users—it directly impacts your bottom line, with studies showing that even a 100ms delay can reduce conversion rates by 7%.
The good news?
React Native 0.80+ with the New Architecture, combined with modern tools like Expo Router, Reanimated 4, and comprehensive monitoring from Sentry, gives us developers power to build performant apps. But with great power comes the need for great technique.
This guide will walk you through proven strategies to optimize every aspect of your React Native app’s performance, from that critical first impression during startup to maintaining smooth animations under heavy load.
We'll be walking through:
Each tip includes real code examples and practical tooling recommendations you can implement today.
On top of that, we’ll look into signals that Sentry can give you to help you understand what’s happening in your app and how to fix it.
Let’s turn your React Native app into a performance powerhouse.
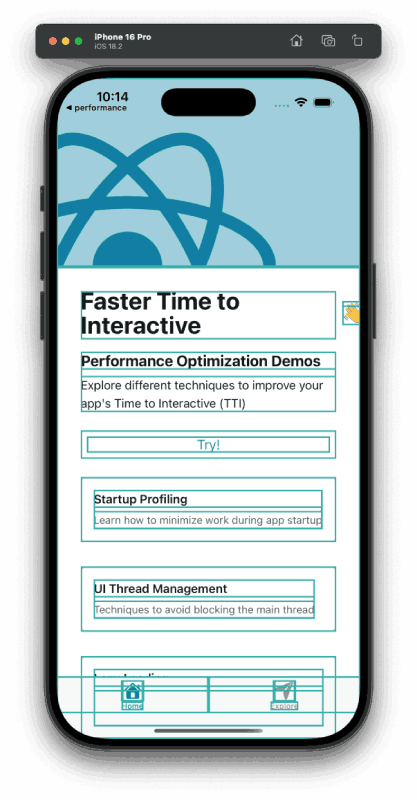
1. Faster Time to Interactive (TTI)
TTI measures how quickly your app becomes usable after launch. It’s the time from tapping the app icon to when the user can actually interact with the UI without lag or blocking spinners.
Minimize work during startup
The biggest performance killer? Doing too much work before your users can interact with your app. Every millisecond during startup counts toward that crucial TTI metric.
// ❌ Bad: Heavy computation blocking app startup
function App() {
  const [data, setData] = useState(null);

  useEffect(() => {
    // This blocks the main thread during startup
    const processedData = heavyDataProcessing(largeDataSet);
    initializeAnalytics();
    setupNotifications();
    configureDeepLinking();
    preloadImages();
    syncUserPreferences();
    setData(processedData);
  }, []);

  return <MainScreen data={data} />;
}
While this code is simple, it’s a classic example of doing too much work during startup. The heavyDataProcessing function blocks the main thread, delaying the app from becoming interactive.
But sometimes it’s not that simple, and that’s when you need to use profiling tools to understand what’s happening.
With the new React Native DevTools you can simply hit j to open the tools and navigate to the “Profiler” tab, from which you can see how long each function and component took to execute.
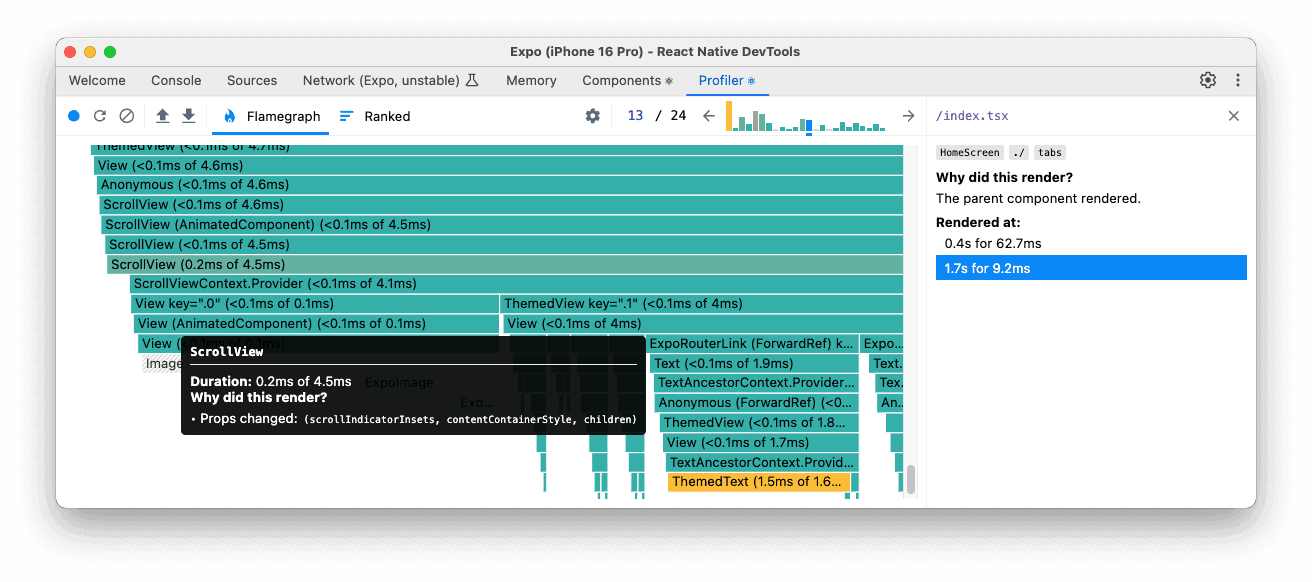
It’s not always trivial to understand the profiler, but React Native has a great guide on Profiling!
If you are using Sentry, you can also use the React Native Profiling feature to understand what’s happening in your app - in production.
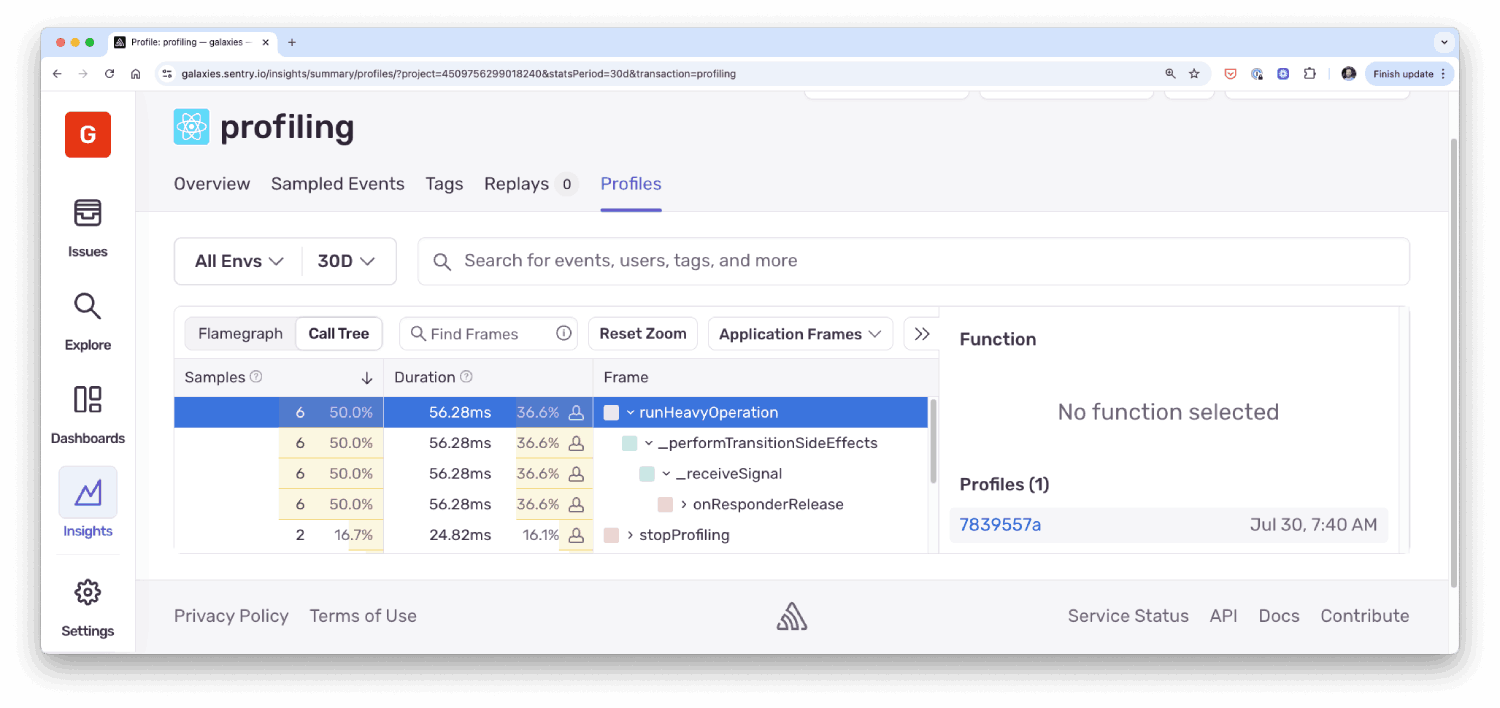
This is a great way to understand which functions of your app are taking the most time to execute for real users, not just during development. You can also see how your code improves execution time over time, or regressions in your code.
Use Lazy Loading with Expo Router
Expo Router makes code-splitting trivial, as you naturally create a route or component for each screen in your app.
But beyond that, Expo Router can also automatically split your JavaScript bundle based on routes using React Suspense when using async routes.
While it’s still an experimental feature, you can enable it through your app.json file:
// Or export your app and open the atlas report
EXPO_ATLAS=true npx expo export --platform ios
npx expo-atlas{
"expo": {
"plugins": [
[
"expo-router",
{
"asyncRoutes": {
"web": true,
"default": "development"
}
}
]
]
}
}When switching routes, you can now see a little loading spinner (during development) and notice that your components are only mounted when they’re needed.
Decrease App Bundle Size through Expo Atlas
Bundle size directly impacts startup time, especially on slower devices and networks.
Once again Expo has you covered with a tool called Expo Atlas, which helps to analyze your app bundle size and identify the biggest contributors.
You can run it locally by setting the EXPO_ATLAS environment variable to true and running or exporting your app, or simply by pressing Shift+M the terminal where you’re running your app and then selecting “Open expo-atlas” from the DevTools.
// Run your app with atlas enabled
EXPO_ATLAS=true bunx expo start// Or export your app and open the atlas report
EXPO_ATLAS=true npx expo export --platform ios
npx expo-atlasYou’ll be able to see a report like this:
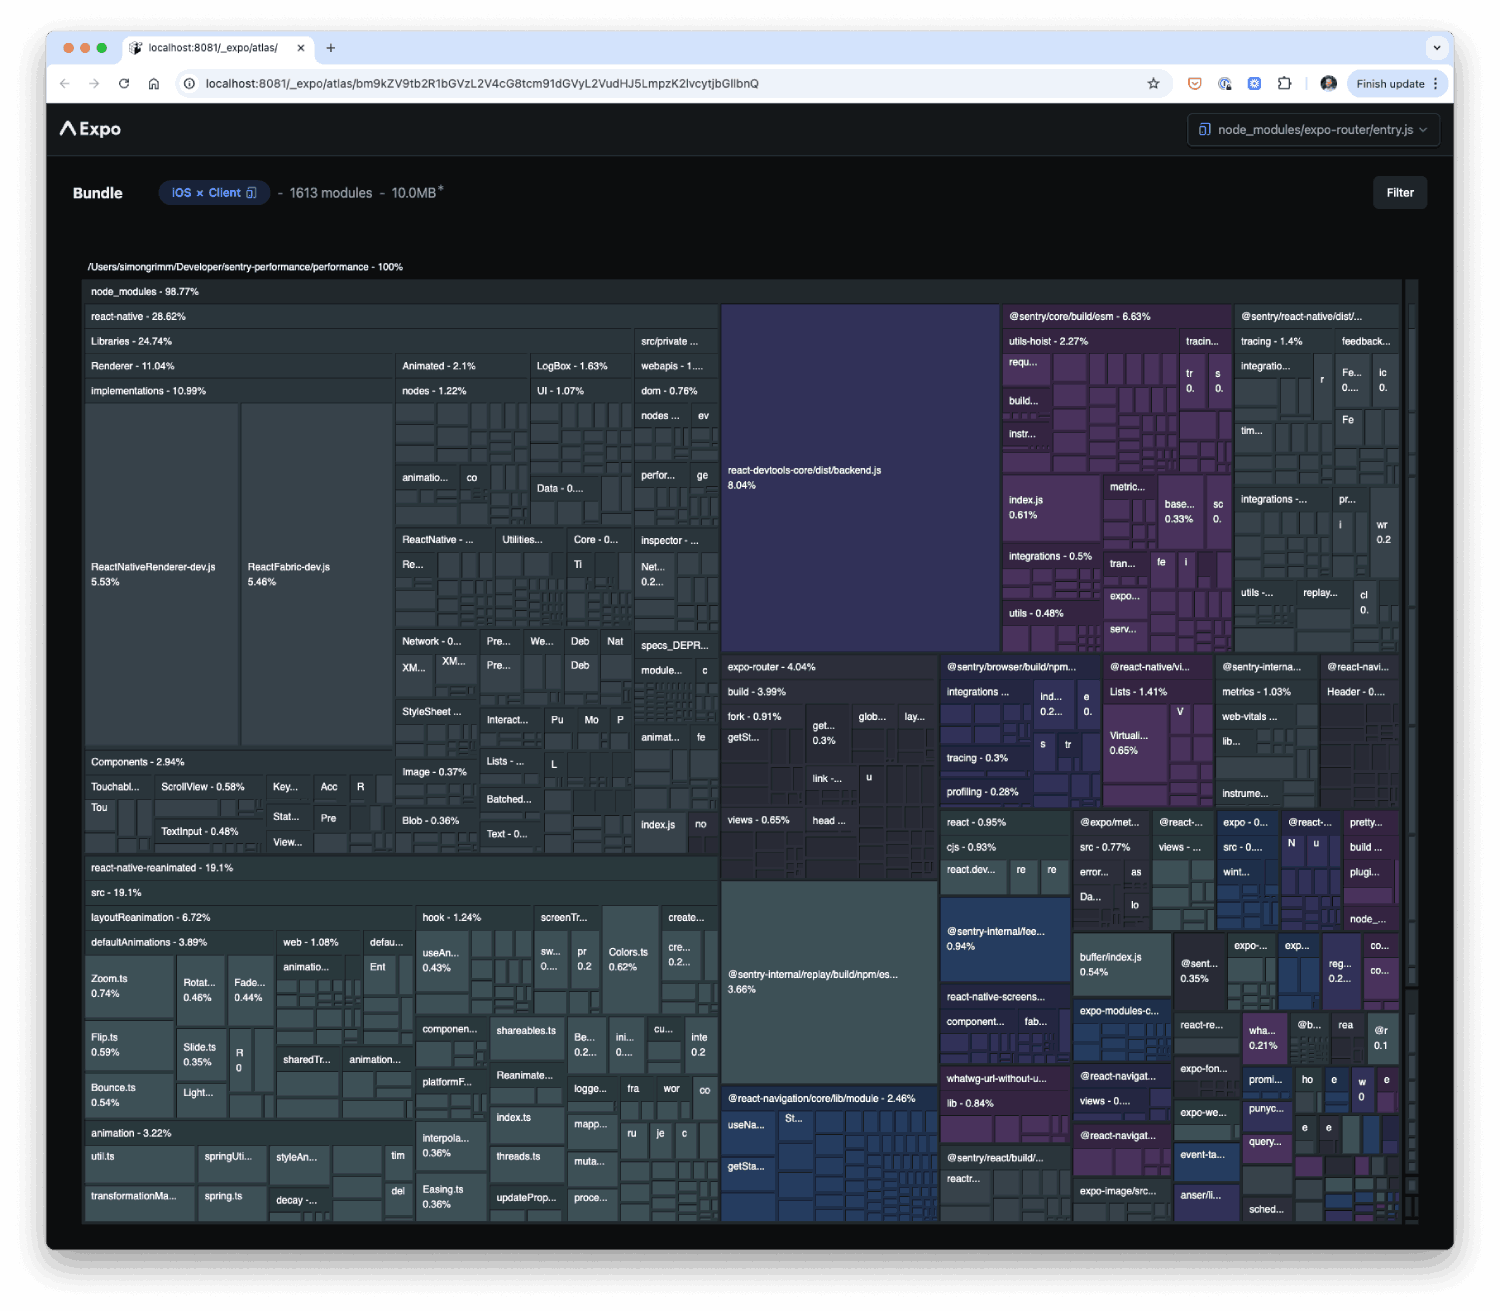
This is a great way to understand which parts of your app are taking the most space in the bundle and how to optimize them.
2. React Optimizations
React Native apps are still React apps at their core, which means React-specific performance principles apply just as much on mobile.
The challenge is that mobile devices are more resource-constrained than desktop browsers, making inefficient React patterns even more costly. A component that re-renders unnecessarily might cause a slight slowdown in a web browser, but on a mid-range Android device, it could drop your frame rate below 60 FPS.
The good news is that React Native gives us powerful tools to identify and fix these issues. From the visual profiler that shows exactly which components are re-rendering, to memory leak detection, to the upcoming React Compiler that automatically optimizes your code.
This section covers the React-specific optimizations that will have the biggest impact on your app’s performance.
Highlight Updates When Components Render
Your first move should always be to understand what’s happening in your app, and the Profiler in the React Native DevTools is a great way to do that.
You want to see which components are re-rendering, so turn on the “Highlight Updates” option in the Profiler.
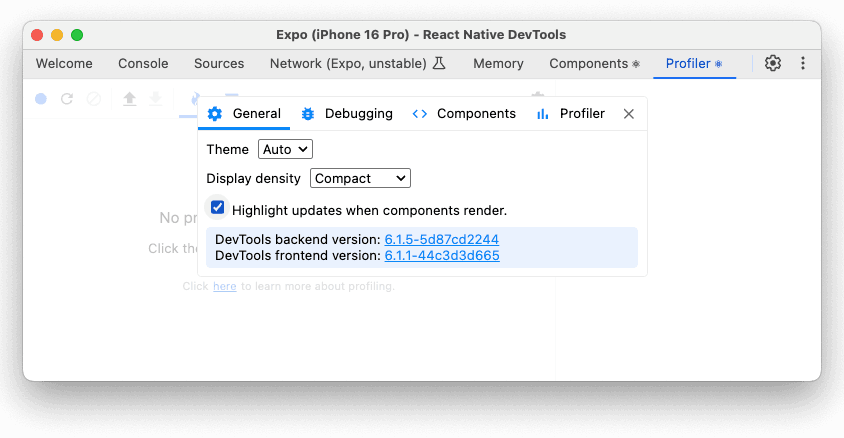
This will highlight the components that are re-rendering in the UI.
Use this feature while navigating your app to spot components that are re-rendering more often than they should.
If a component is constantly re-rendering, or elements re-render for no reason, you can dive deeper into the Profiler like described before to understand why.
To recap, make sure:
Use the Settings > Profiler > “Record why each component rendered” to see exactly what props or state changed
Enable “Highlight updates when components render” to visually see which components are re-rendering
The Flamegraph view shows the component hierarchy and render times - look for tall flames indicating slow components
Enable React Compiler
Manual memoization with useMemo and useCallback has been the standard way to optimize React performance, but it’s error-prone and verbose.
React compiler changes the game by automatically optimizing your components, but until it’s stable, strategic memoization is still crucial.
If you are still on Expo SDK 53 you can install the package like this:
npx expo install babel-plugin-react-compiler@betaHowever, starting with SDK 54, this won’t be needed anymore.
All you need to do now is just enable it in your app.json file:
{
  "expo": {
    "experiments": {
      "reactCompiler": true
    }
  }
}
You can then remove your manual memoization and let the compiler do its magic.
Fix JavaScript Memory Leaks
Memory leaks in React Native apps are subtle but deadly. Unlike web browsers that clean up when you navigate away, mobile apps stay in memory much longer. A small leak can compound over time, eventually causing your app to crash or become sluggish.
This is a common issue in React Native apps, and it’s often caused by:
Event listeners that are not removed
Intervals that are not cleared
WebSocket connections that are not closed
Here’s an example of a component that has multiple memory leaks:
// ❌ Bad: Multiple memory leaks waiting to happen
const ChatScreen = ({ userId }) => {
  const [messages, setMessages] = useState([]);
  const [isTyping, setIsTyping] = useState(false);

  useEffect(() => {
    // Leak 1: Event listener never removed
    const handleKeyboard = (event) => {
      setIsTyping(event.keyboardHeight > 0);
    };
    Keyboard.addListener('keyboardDidShow', handleKeyboard);
    Keyboard.addListener('keyboardDidHide', handleKeyboard);

    // Leak 2: Interval never cleared
    const typingInterval = setInterval(() => {
      if (isTyping) {
        // Send typing indicator
        socket.emit('typing', { userId, isTyping: true });
      }
    }, 1000);

    // Leak 3: WebSocket connection never closed
    const ws = new WebSocket('ws://chat.example.com');
    ws.onmessage = (event) => {
      const newMessage = JSON.parse(event.data);
      setMessages(prev => [...prev, newMessage]);
    };

    // Leak 4: Async operation not cancelled
    fetchInitialMessages(userId).then(initialMessages => {
      setMessages(initialMessages);
    });

    // ❌ Missing cleanup - all these will leak!
  }, [userId]);

  return (
    <View>
      <MessageList messages={messages} />
      {isTyping && <TypingIndicator />}
    </View>
  );
};
Now, I’m sure you could spot and fix all of them, but for clarity, here’s how you could make sure your app is free of memory leaks:
// ✅ Good: Comprehensive cleanup prevents memory leaks
const ChatScreen = ({ userId }) => {
  const [messages, setMessages] = useState([]);
  const [isTyping, setIsTyping] = useState(false);

  useEffect(() => {
    // Use AbortController for fetch requests or use Tanstack Query
    const abortController = new AbortController();

    // Event listeners with cleanup
    const handleKeyboardShow = (event) => setIsTyping(true);
    const handleKeyboardHide = (event) => setIsTyping(false);

    const keyboardShowListener = Keyboard.addListener('keyboardDidShow', handleKeyboardShow);
    const keyboardHideListener = Keyboard.addListener('keyboardDidHide', handleKeyboardHide);

    // Interval with cleanup
    const typingInterval = setInterval(() => {
      if (isTyping) {
        socket.emit('typing', { userId, isTyping: true });
      }
    }, 1000);

    // WebSocket with cleanup
    const ws = new WebSocket('ws://chat.example.com');
    ws.onmessage = (event) => {
      // Check if component is still mounted
      if (!abortController.signal.aborted) {
        const newMessage = JSON.parse(event.data);
        setMessages(prev => [...prev, newMessage]);
      }
    };

    // Fetch with cancellation
    const fetchMessages = async () => {
      try {
        const initialMessages = await fetchInitialMessages(userId, {
          signal: abortController.signal
        });

        if (!abortController.signal.aborted) {
          setMessages(initialMessages);
        }
      } catch (error) {
        if (error.name !== 'AbortError') {
          Sentry.captureException(error);
        }
      }
    };

    fetchMessages();

    // ✅ Cleanup function prevents all leaks
    return () => {
      // Cancel any pending requests
      abortController.abort();

      // Remove event listeners
      keyboardShowListener?.remove();
      keyboardHideListener?.remove();

      // Clear intervals
      clearInterval(typingInterval);

      // Close WebSocket
      if (ws.readyState === WebSocket.OPEN) {
        ws.close();
      }

      // Send final typing indicator
      socket.emit('typing', { userId, isTyping: false });
    };
  }, [userId, isTyping]);

  return (
    <View>
      <MessageList messages={messages} />
      {isTyping && <TypingIndicator />}
    </View>
  );
};
While these were some concrete examples of memory leaks and JavaScript optimizations, it comes without saying that you should write clean JavaScript and therefore React code in the first place.
3. Achieving 60 Frames per Second (FPS)
Smooth animations and interactions are what separate good React Native apps from great ones. At 60 FPS, each frame has just 16.67 milliseconds to render—and that includes JavaScript execution, native bridge communication, and UI updates.
Drop below this threshold and users immediately notice the stuttering, especially during critical interactions like scrolling, navigation, or gesture-driven animations.
The New Architecture in React Native helps significantly by reducing bridge communication overhead, but you still need to be strategic about keeping work off the main JavaScript thread. This is where modern tools like Reanimated 4, performance monitoring, and careful thread management become essential.
This section covers the techniques and tools you need to maintain that buttery-smooth 60 FPS experience, even under heavy load.
Use React Performance Monitor for live FPS
Real-time FPS monitoring helps you catch performance regressions immediately during development. It’s a very simple way to see if your app is running at 60 FPS, and if not, why.
Simply open up the tools sheet in your Expo app using CMD + Control + Z (Mac) or Ctrl + Shift + Z and enable the Performance Monitor.
The first step to achieving 60 FPS is to understand what’s happening in your app.
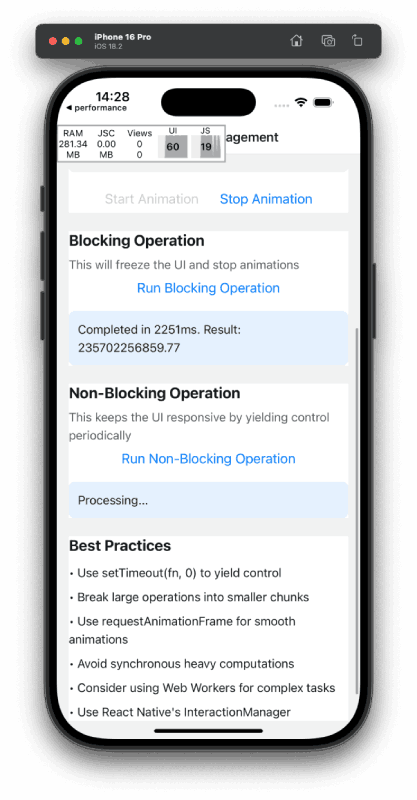
Avoid blocking the JavaScript thread
The biggest enemy of smooth performance is blocking the JavaScript thread with heavy computations. Unlike web browsers with Web Workers, React Native’s JavaScript thread handles both your app logic AND UI updates. Block it, and your entire app freezes.
// ❌ Bad: Heavy computation blocking UI updates
const ProcessingScreen = () => {
  const [result, setResult] = useState(null);
  const [progress, setProgress] = useState(0);

  const handleProcess = () => {
    // This will freeze the UI for seconds
    const data = [];
    for (let i = 0; i < 1000000; i++) {
      data.push(expensiveCalculation(i));

      // Even trying to update progress blocks the UI
      if (i % 10000 === 0) {
        setProgress(i / 1000000);
      }
    }
    setResult(data);
  };

  return (
    <View>
      <TouchableOpacity onPress={handleProcess}>
        <Text>Process Data</Text>
      </TouchableOpacity>
      <ProgressBar progress={progress} />
      {result && <Results data={result} />}
    </View>
  );
};
While you should generally try to offload heavy computations to your backend, there are cases where you need to do it in the app. In those cases, you could benefit from Transition API of React 18:
// ✅ Better: Use React 18's concurrent features + proper chunking
import { startTransition, useDeferredValue } from 'react';
import * as Sentry from '@sentry/react-native';

const ProcessingScreen = () => {
  const [result, setResult] = useState(null);
  const [progress, setProgress] = useState(0);
  const [isProcessing, setIsProcessing] = useState(false);
  const deferredResult = useDeferredValue(result);

  const handleProcess = () => {
    setIsProcessing(true);

    // Track the processing performance
    const transaction = Sentry.startTransaction({
      name: 'Heavy Data Processing',
      op: 'task.processing'
    });

    // Use startTransition for non-urgent updates
    startTransition(() => {
      const processChunk = (startIndex, chunkSize = 1000) => {
        const span = transaction.startChild({
          op: 'processing.chunk',
          description: `Processing chunk ${startIndex}-${startIndex + chunkSize}`
        });

        const chunk = [];
        const endIndex = Math.min(startIndex + chunkSize, 1000000);

        for (let i = startIndex; i < endIndex; i++) {
          chunk.push(expensiveCalculation(i));
        }

        setResult(prev => prev ? [...prev, ...chunk] : chunk);
        setProgress(endIndex / 1000000);

        span.finish();

        if (endIndex < 1000000) {
          // Schedule next chunk, yielding control back to React
          setTimeout(() => processChunk(endIndex), 0);
        } else {
          setIsProcessing(false);
          transaction.finish();
        }
      };

      processChunk(0);
    });
  };

  return (
    <View>
      <TouchableOpacity onPress={handleProcess} disabled={isProcessing}>
        <Text>{isProcessing ? 'Processing...' : 'Process Data'}</Text>
      </TouchableOpacity>
      <ProgressBar progress={progress} />
      {deferredResult && <Results data={deferredResult} />}
    </View>
  );
};
Another way would be to use React Native Worklets Core from Margelo, or the new React Native Worklets package, which was extracted from the core of Reanimated 4.
With worklets, you can run your code in a separate thread, meaning you could execute the heavy computation in a background thread instead of blocking the main thread.
Use Flashlight on Android for metrics
Another great way to understand what’s happening in your app is to use Flashlight. It’s a tool that gives you a Lighthouse-like score for your app, and it’s currently only available for Android, but they are working on iOS support as well.
Just like the profiling tools in the React Native DevTools, you can use Flashlight to see a live view of your app’s performance.
Using Sentry Tracing
Besides making sure you write performant React code, you can also use Sentry’s tracing feature to understand what’s happening in your app.
In addition to capturing errors, you can monitor interactions between multiple services or applications by enabling tracing, which is crucial for React Native apps that often communicate with multiple backend services, third-party APIs, and native modules.
Unlike traditional debugging tools that only show you what’s happening in development, Sentry’s tracing gives you real-world performance data from your actual users across different devices, network conditions, and app versions.
The power of Sentry tracing lies in its ability to connect the dots between different performance issues. When a user reports that your app feels slow, Sentry can show you whether it’s due to a slow API call, an inefficient React component, a memory leak, or a combination of factors. This holistic view is impossible to get from React DevTools alone, which only shows you the React layer of your application.
// Custom hook for component-level performance tracking
const useComponentPerformance = (componentName) => {
  useEffect(() => {
    const transaction = Sentry.startTransaction({
      name: `${componentName}.mount`,
      op: 'component.lifecycle'
    });

    return () => {
      transaction.finish();
    };
  }, [componentName]);
};

// Usage in components
const ChatScreen = ({ userId }) => {
  useComponentPerformance('ChatScreen');
  // ... rest of component
};
Besides transactions, another way to measure the time for a specific action to occur are Spans.
The most basic usage of a span could look like this:
const result = await Sentry.startSpan(
  { name: "Important Function" },
  async () => {
    const res = await doSomethingAsync();
    return updateRes(res);
  },
);
With spans, you could also trace time for operations like API calls to your backend, or even the time it takes to render a list item. Ultimately, all of this can give you a signal of what’s happening in your app, and where you can improve.
4. Better List Performance
Lists are where React Native performance problems become most obvious. A poorly optimized list with just 100 items can drop your app to 30 FPS, while a well-optimized list can smoothly handle thousands of items at 60 FPS.
The difference comes down to understanding how React Native renders lists and choosing the right tools for the job.
The built-in FlatList is good for simple cases, but modern alternatives like FlashList and LegendList are specifically designed for mobile performance. Combined with proper render optimization and smart data handling, you can build lists that feel instantly responsive even with complex data.
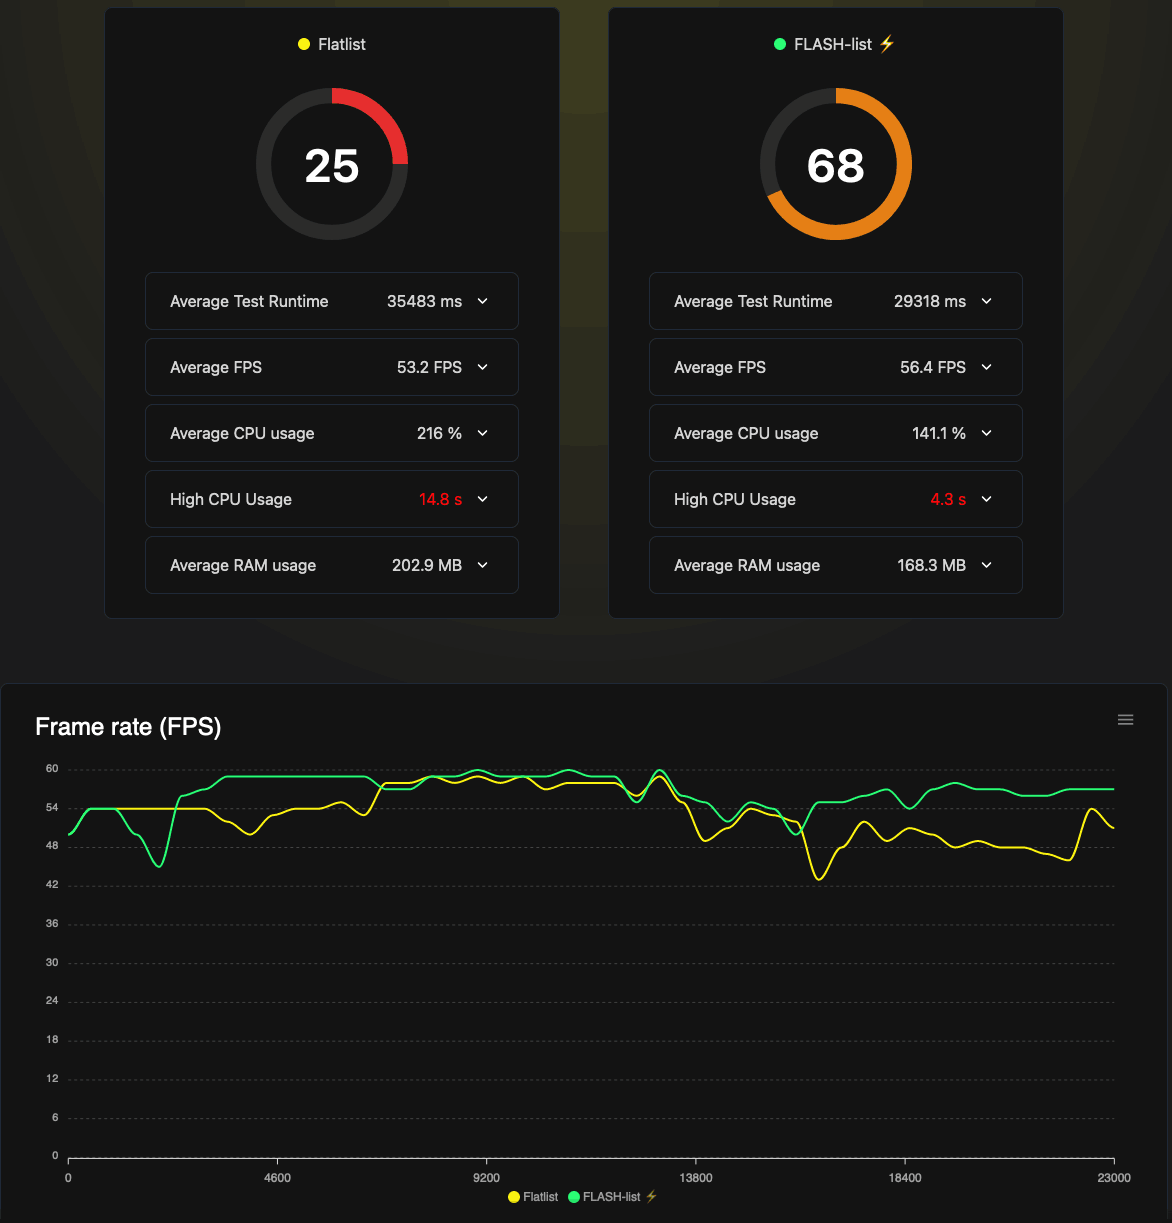
Use FlashList/LegendList
You should almost never just map over your data in a ScrollView, and while FlatList is good for simple cases, you should consider using FlashList or LegendList most of the time.
Their APIs are almost identical, but FlashList is optimized for performance, and LegendList is optimized for memory usage.
Both of them are a drop-in replacement for FlatList, so you won’t have to change much in your code.
// ✅ Good: FlashList with optimized rendering
import { FlashList } from '@shopify/flash-list';

const FastProductList = ({ products }) => {
  // Pre-calculate expensive data
  const processedProducts = useMemo(() =>
    products.map(item => ({
      ...item,
      discountPercent: calculateDiscount(item.originalPrice, item.price),
      ratingStars: '⭐'.repeat(item.rating) + '☆'.repeat(5 - item.rating)
    })), [products]
  );

  return (
    <FlashList
      data={processedProducts}
      renderItem={({ item }) => <ProductCard item={item} />}
      estimatedItemSize={120} // Crucial for FlashList performance
    />
  );
};
But it’s not just about using the right list component, it’s also about how you render your list items.
Efficient List render functions
The key to fast lists is making render functions as lightweight as possible.
// ❌ Bad: Doing too much work in renderItem
const HeavyList = ({ items }) => (
  <FlatList
    data={items}
    renderItem={({ item, index }) => {
      // Heavy work happening on every render
      const formattedDate = new Date(item.timestamp).toLocaleDateString();
      const isEven = index % 2 === 0;
      const statusColor = item.status === 'active' ? '#green' : '#red';

      return (
        <TouchableOpacity
          style={[
            styles.item,
            { backgroundColor: isEven ? '#f0f0f0' : '#white' }
          ]}
          onPress={() => navigation.navigate('Detail', { id: item.id })}
        >
          <Text style={styles.title}>{item.title}</Text>
          <Text style={styles.date}>{formattedDate}</Text>
          <View style={[styles.status, { backgroundColor: statusColor }]} />
        </TouchableOpacity>
      );
    }}
  />
);
In this example, date formatting and style calculations happen on every scroll, causing frame drops.
// ✅ Good: Pre-process data, memoize components
const EfficientList = ({ items }) => {
  // Do heavy work once, not on every render
  const processedItems = useMemo(() =>
    items.map((item, index) => ({
      ...item,
      formattedDate: new Date(item.timestamp).toLocaleDateString(),
      isEven: index % 2 === 0,
      statusColor: item.status === 'active' ? '#green' : '#red'
    })), [items]
  );

  return (
    <FlashList
      data={processedItems}
      renderItem={ListItem}
      estimatedItemSize={80}
    />
  );
};

// Separate, memoized component with minimal props
const ListItem = React.memo(({ item }) => (
  <TouchableOpacity
    style={[styles.item, item.isEven && styles.evenItem]}
    onPress={() => navigation.navigate('Detail', { id: item.id })}
  >
    <Text style={styles.title}>{item.title}</Text>
    <Text style={styles.date}>{item.formattedDate}</Text>
    <View style={[styles.status, { backgroundColor: item.statusColor }]} />
  </TouchableOpacity>
));
All expensive calculations happen once in useMemo, and the render function just displays pre-computed values.
In this example, the heavy work is done once, and the list item is memoized, so it won’t re-render unless the props change.
And if you read this article carefully, you know that you can soon drop the React.memo and let the compiler do its magic.
Understand mutating lists and re-renders
How you update list data dramatically affects performance. It’s super easy to overlook this, and it’s a common source of performance issues.
// ❌ Bad: Mutating arrays causes full list re-renders
const MutatingList = () => {
  const [items, setItems] = useState([]);

  const addItem = (newItem) => {
    // This mutates the existing array
    items.push(newItem);
    setItems(items); // React doesn't detect the change!
  };

  const updateItem = (id, changes) => {
    // This causes the entire list to re-render
    const updatedItems = items.map(item =>
      item.id === id ? { ...item, ...changes } : item
    );
    setItems(updatedItems);
  };

  return <FlashList data={items} renderItem={ListItem} estimatedItemSize={60} />;
};
Mutations don’t trigger re-renders properly, and full array updates cause every item to re-render.
A better way to update your data could look like this:
// ✅ Good: Immutable updates with smart re-rendering
const OptimizedList = () => {
  const [items, setItems] = useState([]);

  const addItem = useCallback((newItem) => {
    // Create new array, React detects the change
    setItems(prev => [...prev, newItem]);
  }, []);

  const updateItem = useCallback((id, changes) => {
    setItems(prev =>
      prev.map(item =>
        item.id === id ? { ...item, ...changes } : item
      )
    );
  }, []);

  const removeItem = useCallback((id) => {
    setItems(prev => prev.filter(item => item.id !== id));
  }, []);

  return (
    <FlashList
      data={items}
      renderItem={MemoizedListItem}
      estimatedItemSize={60}
    />
  );
};

// This component only re-renders when its specific item changes
const MemoizedListItem = React.memo(({ item }) => (
  <View style={styles.item}>
    <Text>{item.title}</Text>
    <Text>{item.subtitle}</Text>
  </View>
), (prevProps, nextProps) => {
  // Custom comparison - only re-render if this specific item changed
  return prevProps.item.id === nextProps.item.id &&
         prevProps.item.updatedAt === nextProps.item.updatedAt;
});
Immutable updates ensure React detects changes correctly, and custom memo comparison prevents unnecessary re-renders of unchanged items.
As you can see, the code becomes a bit more challenging to read, but when you optimize for list performance, you’ll be glad you did.
5. Careful State Management
State management is often the silent performance killer in React Native apps. Poorly structured state can trigger unnecessary re-renders across your component tree, leading to janky animations and sluggish user interactions.
Let’s explore how to optimize your state management for better performance.
Use Context carefully
React Context is convenient, but it’s also a common source of performance issues.
When a Context value changes, every component that consumes it will re-render - even if they only use a small part of that state.
// This will cause ALL consumers to re-render when ANY value changes
const AppContext = createContext();

function AppProvider({ children }) {
  const [user, setUser] = useState(null);
  const [notifications, setNotifications] = useState([]);
  const [theme, setTheme] = useState('light');
  const [cart, setCart] = useState([]);

  const value = {
    user, setUser,
    notifications, setNotifications,
    theme, setTheme,
    cart, setCart
  };

  return (
    <AppContext.Provider value={value}>
      {children}
    </AppContext.Provider>
  );
}

// This component re-renders whenever ANY context value changes
function UserProfile() {
  const { user } = useContext(AppContext);
  return <Text>{user?.name}</Text>;
}
A better way to use the Context API would be to split your context into smaller contexts, and only pass the data that is needed to the components that need it.
// Separate contexts for different concerns
const UserContext = createContext();
const ThemeContext = createContext();
const CartContext = createContext();

function UserProvider({ children }) {
  const [user, setUser] = useState(null);
  return (
    <UserContext.Provider value={{ user, setUser }}>
      {children}
    </UserContext.Provider>
  );
}

// Now this only re-renders when user changes
function UserProfile() {
  const { user } = useContext(UserContext);
  return <Text>{user?.name}</Text>;
}
But if you are open to using a library, there are some great choices out there.
Use Jotai/Zustand for atomic state when possible
For complex state management, consider atomic state libraries like Jotai or Zustand. These libraries provide fine-grained reactivity, meaning components only re-render when the specific state they depend on changes.
An example of using Jotai could look like this:
import { atom, useAtom } from 'jotai';

// Define atoms for different pieces of state
const userAtom = atom(null);
const cartCountAtom = atom(0);
const themeAtom = atom('light');

// Derived atoms for computed values
const cartTotalAtom = atom((get) => {
  const items = get(cartItemsAtom);
  return items.reduce((sum, item) => sum + item.price, 0);
});

function UserProfile() {
  const [user] = useAtom(userAtom);
  // Only re-renders when userAtom changes
  return <Text>{user?.name}</Text>;
}

function CartBadge() {
  const [count] = useAtom(cartCountAtom);
  // Only re-renders when cartCountAtom changes
  return <Badge>{count}</Badge>;
}
With small Atoms, you can also use the useAtomValue hook to get the value of an atom without re-rendering the component when the atom changes.
Besides that, Zustand was the 2024 Rising Star of State Management, and it’s a great choice for pretty much any use case.
Smart state management is about choosing the right tool for the job. Context is great for rarely-changing, widely-needed data like theme or user authentication. For complex, frequently-changing states, atomic libraries like Jotai or Zustand will give you much better performance with less code complexity.
Wrapping Up: Your Path to Lightning-Fast React Native Apps
Building performant React Native apps isn’t about applying every optimization technique at once—it’s about understanding where your bottlenecks are and applying the right solutions systematically.
Your Performance Optimization Checklist
Start with profiling first, optimizing second. Use React Native DevTools and Sentry’s Performance Monitoring to identify your actual performance issues rather than guessing. Many developers spend time optimizing the wrong things while their real bottlenecks go unnoticed.
Focus on the fundamentals that move the needle:
Minimize startup work and lazy load what you can
Keep your bundle size in check with Expo Atlas
Never block the UI thread — leverage Reanimated 4 and worklets for smooth animations
Replace FlatList with FlashList for better list performance
Choose your state management strategy based on your app’s complexity
Tools That Make the Difference
The React Native ecosystem has evolved tremendously. Modern tools like the React Compiler, Expo Router, and FlashList aren’t just nice-to-haves — they’re game-changers that can dramatically improve your app’s performance with minimal code changes.
For monitoring and debugging, integrate the Sentry React Native SDK early in your development process. Performance issues are much easier to catch and fix when you have real user data and detailed error tracking from day one.
The 60 FPS Goal
Remember, 60 FPS isn’t just a nice number — it’s the threshold where your app feels truly native to users. Use React Perf Monitor during development and Flashlight for detailed Android profiling. When your animations are smooth and your interactions are immediate, users notice.
Keep Learning and Measuring
Performance optimization is an ongoing process, not a one-time task. As your app grows and the React Native ecosystem evolves, new bottlenecks will emerge and better solutions will become available.
The key is building a culture of performance awareness in your team. Make profiling part of your development workflow, set performance budgets for your features, and always measure the impact of your optimizations.
Your users will thank you with better reviews, longer session times, and fewer abandoned interactions. In a world where app store ratings can make or break your product, these performance improvements aren’t just technical nice-to-haves - they’re business essentials.
Ready to implement these optimizations?
Start with profiling your current app, pick the lowest-hanging fruit from this guide, and measure your improvements.
Performance optimization is a journey, but with these tools and techniques, you’re well-equipped to build React Native apps that truly shine.