Rich Error Logging & Reports with Redux Middleware
Rich Error Logging & Reports with Redux Middleware
If you're a client-side developer, you've probably heard of Redux, a JavaScript library that helps manage application state in complex applications. It has become increasingly popular since its introduction in 2015, especially among React developers.
Redux can be pretty tricky to understand, but it works something like this:
your entire application state is saved in a single object called a store
you dispatch actions on the store to describe state changes (e.g.
ADD_ROW)you implement functions called reducers to transform the state of your store as a result of an action
your views render the current state of the store
Redux itself provides utility objects and functions to implement this architecture. It's a surprisingly simple library, totaling just 6.7 kb minified.
Want to learn more about Redux? We recommend watching the free "Learn Redux" video series.
Redux Error Logging
Architecting your application this way has a handful of benefits, but what makes it particularly nice is how it impacts error logging and crash reporting. Specifically, Redux makes it easy to know:
the state of your app at the time of the crash (via the store)
the action(s) that preceded the crash
If you are working on a Redux app, it's possible to write middleware to automatically capture these values from your application at crash time so you have more detail for JavaScript error tracking. "Middleware" sounds intimidating, but it's just a function that is registered with Redux to be invoked as an action is dispatched.
Below is an example middleware function, crashReporter. When registered with Redux, it is invoked every time an action is triggered.
import Raven from 'raven-js';
const crashReporter = store => next => action => {
try {
return next(action); // dispatch
} catch (err) {
console.error('Caught an exception!', err);
Raven.captureException(err, { // send to crash reporting tool
extra: {
action,
state: store.getState() // dump application state
}
});
throw err; // re-throw error
}
}If an error is thrown during dispatch, it is caught and passed to our crash reporting service, including a dump of the current application state and the action that was being triggered.
To register crashReporter in your application, use Redux's applyMiddleware utility function when first initializing your store:
import {createStore, applyMiddleware} from 'redux';

let store = createStore(
  myApp,  // initial reducer
  applyMiddleware(crashReporter)
);
Redux and Sentry
If you are a Redux and Sentry user, this middleware already exists via a project named raven-for-redux, available via npm:
npm install --save raven-for-reduxLike the example from earlier, it is initialized via applyMiddleware when creating your store:
import Raven from "raven-js"; // Or, you might already have this as `window.Raven`.
import { createStore, applyMiddleware } from "redux";
import createRavenMiddleware from "raven-for-redux";

import { reducer } from "./myReducer";

Raven.config("your-sentry-dsn").install();

const store = createStore(
    reducer,
    applyMiddleware(
        createRavenMiddleware(Raven)
    )
);
_NOTE: RavenMiddleware should be the first argument passed to applyMiddleware, ahead of other middleware like Redux Thunk.
Besides just capturing errors, raven-for-redux does two powerful things:
logs actions as error tracking breadcrumbs
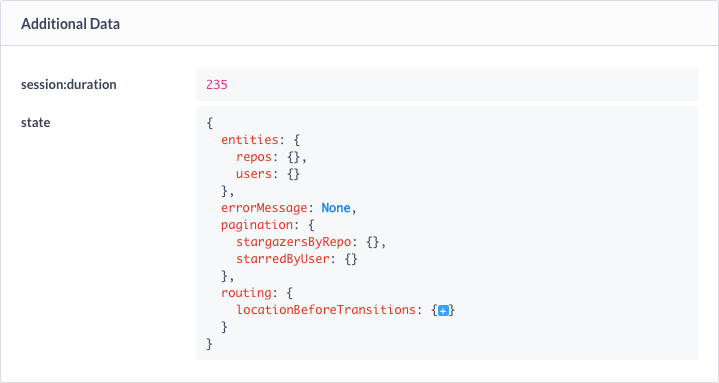
attaches the contents of your Redux store and your last dispatched action as
extradata
An example of extra data as it appears in Sentry:

Use Sentry for Error Logging in Redux
If you're using Redux, you owe it to yourself to start logging rich application errors using middleware. If you're a Sentry user, this is really easy via raven-for-redux. However you choose to track errors and monitor performance, there's no better time than now to get started.


