Replaying Backend Errors using Sentry’s Session Replay
Replaying Backend Errors using Sentry’s Session Replay
Session Replay is a powerful visual tool that captures user interactions, providing insights into the actions that resulted in errors. It records various activities, such as mouse movements, clicks, scrolling, and keyboard inputs, enabling developers to recreate the exact user experience. Tools like Sentry’s Session Replay enhance the debugging process significantly by offering this detailed view. In essence, Sentry’s Session Replay serves as an exceptional integration for addressing frontend errors effectively.
Session Replay creates a visualization of how users interact with various elements in an app or website. In the case of a web application running in a web browser, it will only show issues if they happen during the user’s webpage browsing session. As a backend developer, I thought it was a great feature, although I didn’t get to use it much. Most of my Sentry Issues and stack traces occur on the backend, which replays don’t observe.
Realizing that I wasn’t alone, Sentry shipped Backend Error linking, which allows the frontend session recordings to link to your backend errors. This works by integrating replays with our tracing data model so that when you have Sentry wired up on your frontend and backend, we have data connectivity end-to-end on your APIs and can link replays to backend endpoints.
How to Use Session Replay to Identify Backend Errors
To get started with Session Replay, make sure you are using the minimum SDK required for your specific setup. This requirement may vary based on the projects you have installed. Ensuring that your SDK version meets these minimum specifications will help guarantee optimal functionality and performance of the Session Replay tool.
JavaScript (or related framework) 7.51.0
Python 1.20.0
Node 7.48.0
PHP 3.18.0
NET 3.31.0
Java 6.17.0
Ruby 5.9.0
Go 0.21.0
Set Up Session Replay and set your trace propagation.
Sentry.init({
tracePropagationTargets: ["third-party-site.com", /^https:\/\/yourserver\.io\/api/],
});Session Replay in Action
At Sentry, we have a React frontend, and Django backend. On our Django backend, we saw a pesky Google Cloud Platform permissions issue infrequently. We had it deep within our backlog, but we were unsure if users were actually affected by it.
After we released the Replay <> Backend Error linking feature, I noticed that there was now a replay associated with the issue.
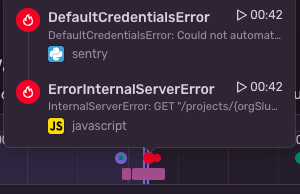
I clicked the play button and drilled into the replay. It took me right to the timestamp where the error occurred, and I could see an accompanying JS error along with it.
After reviewing the session replay, I noticed that the user became super confused at one point, moved their mouse around, and then refreshed the page. I can empathize with their frustration, as this clearly contributes to a negative experience. Observing what the user went through prompted me to prioritize this issue, elevate its importance in my triage list, and work on resolving this frustrating experience.
As a backend engineer, there are instances where certain anomalies may seem peculiar, yet we might choose to sideline them temporarily. However, with tools like error monitoring and Session Replay, we’re able to gain more insight into our users’ experiences, which significantly accelerates our capacity to identify, prioritize, and address issues.
Check out the original thread this blog post was based on.
How to Get Started with Session Replay
Session Replay is available on all web-based platforms, with a base allotment of replays included in every plan. If you are using Session Replay for the first time, follow these steps to get up and running:
1. Enable Session Replay in Your Sentry Project
If you’re using the Loader Script, you will need to make sure to enable Session Replay in your project settings:
Log in to Sentry: Go to your Sentry.io account and navigate to your settings.
Go to a specific Project’s Settings: In the settings for the project you want to use Session Replay with, look for the “Session Replay” toggle under Loader Script.
Enable the feature: Turn on Session Replay for your project. You may need the appropriate permissions or plan level to access this feature.

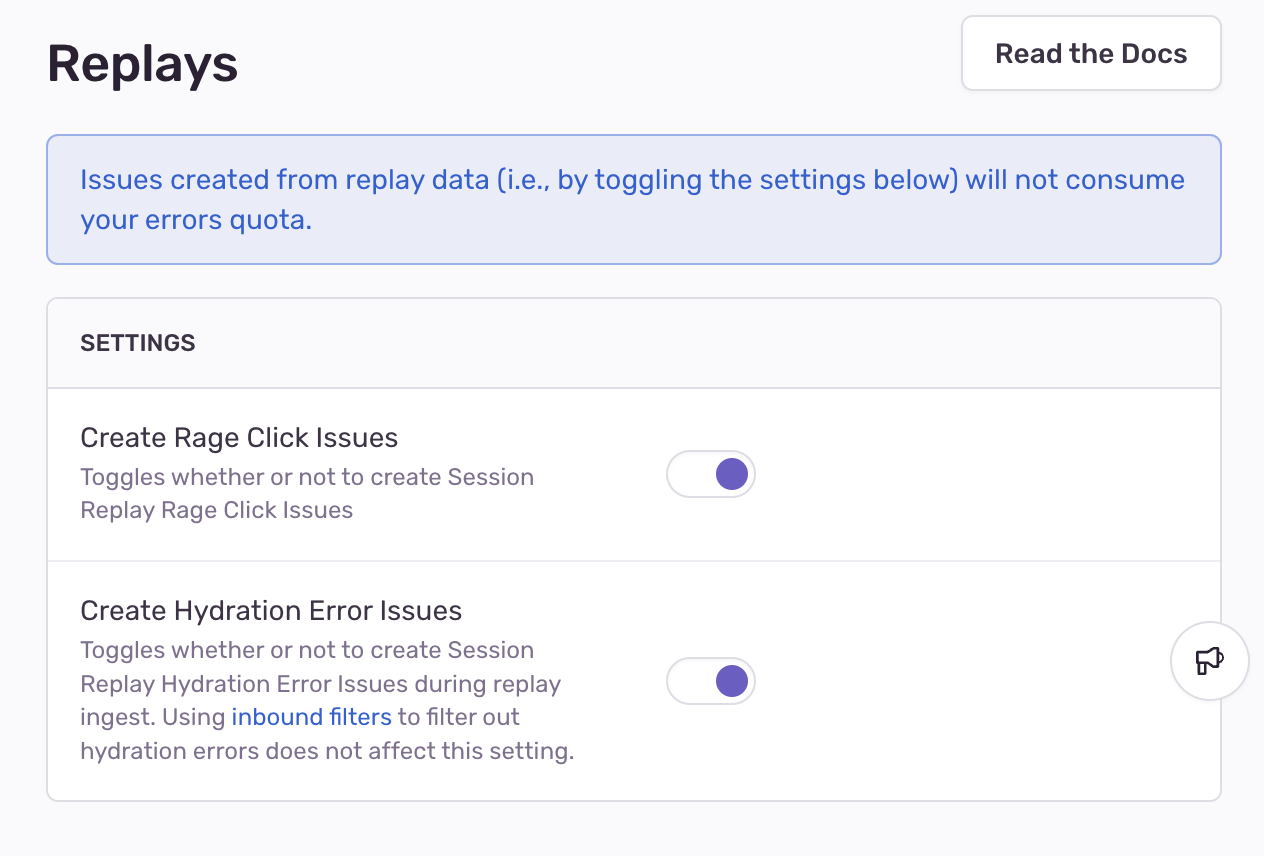
Whether you’re using the Loader Script or not, enable the “Create Rage Click Issues” and “Create Hydration Error Issues” toggles under Replays.

2. Install Sentry SDK
If you haven’t already, you’ll need to install Sentry’s SDK in your application. Sentry offers SDK support for over 100 languages and frameworks, including JavaScript and , popular web frameworks like React, Angular, and Vue.
For JavaScript, for example, you can install the SDK by running:
npm install --save @sentry/browserAnd for a lot of our SDKs, you’ll find wizards to guide you through a quick installation with auto-instrumentation. For example, to use the Next.js wizard you simply need to run:
npx @sentry/wizard@latest -i nextjs3. Configure the SDK
Once installed, configure the SDK to start sending replays. You can do this in the Sentry client config file. In a Next.js project this would be sentry.client.config.ts:.
import * as Sentry from "@sentry/nextjs";

Sentry.init({
  dsn: "YOUR_SENTRY_DSN",

  // This sets the sample rate to be 10%. You may want this to be 100% while
  // in development and sample at a lower rate in production
  replaysSessionSampleRate: 0.1,

  // If the entire session is not sampled, use the below sample rate to sample
  // sessions when an error occurs.
  replaysOnErrorSampleRate: 1.0,

  integrations: [
    Sentry.replayIntegration({
      // Additional SDK configuration goes in here, for example:
      maskAllText: true,
      blockAllMedia: true,
    }),
  ],
});
Replace
YOUR_SENTRY_DSNwith the DSN key from your Sentry project settings.Make sure to configure the options to the needs of your project:
replaysSessionSampleRatecontrols how many sessions to capture across all user sessionsreplaysOnErrorSampleRatecontrols how many sessions to capture when an error occursmaskAllTextcontrols whether all text is masked on the client’s deviceblockAllMediacontrols whether all media is masked on the client’s device
For more information on masking for user privacy, check out our privacy docs.
4. Verify Data Capture
Once everything is set up, generate some test sessions by interacting with your app. Navigate to Replays in Sentry to see captured sessions.
You can also view the replays from within error or performance issue details.
By following these steps, you’ll have Sentry’s Session Replay feature up and running, enabling you to capture and visualize how users interact with your application.
Interested in learning more or have product feedback? Drop us a line on GitHub, Twitter, or Discord (#session-replay channel). And, if you’re new to Sentry, you can try it for free or request a demo to get started.


