Product Updates
Five things you can do with Sentry’s Agent Tracing
Five Agent Tracing recipes from the Sentry Cookbook, from production evals and daily error triage to LLM cost tracking, spend alerts, and OpenTelemetry.

Five Agent Tracing recipes from the Sentry Cookbook, from production evals and daily error triage to LLM cost tracking, spend alerts, and OpenTelemetry.
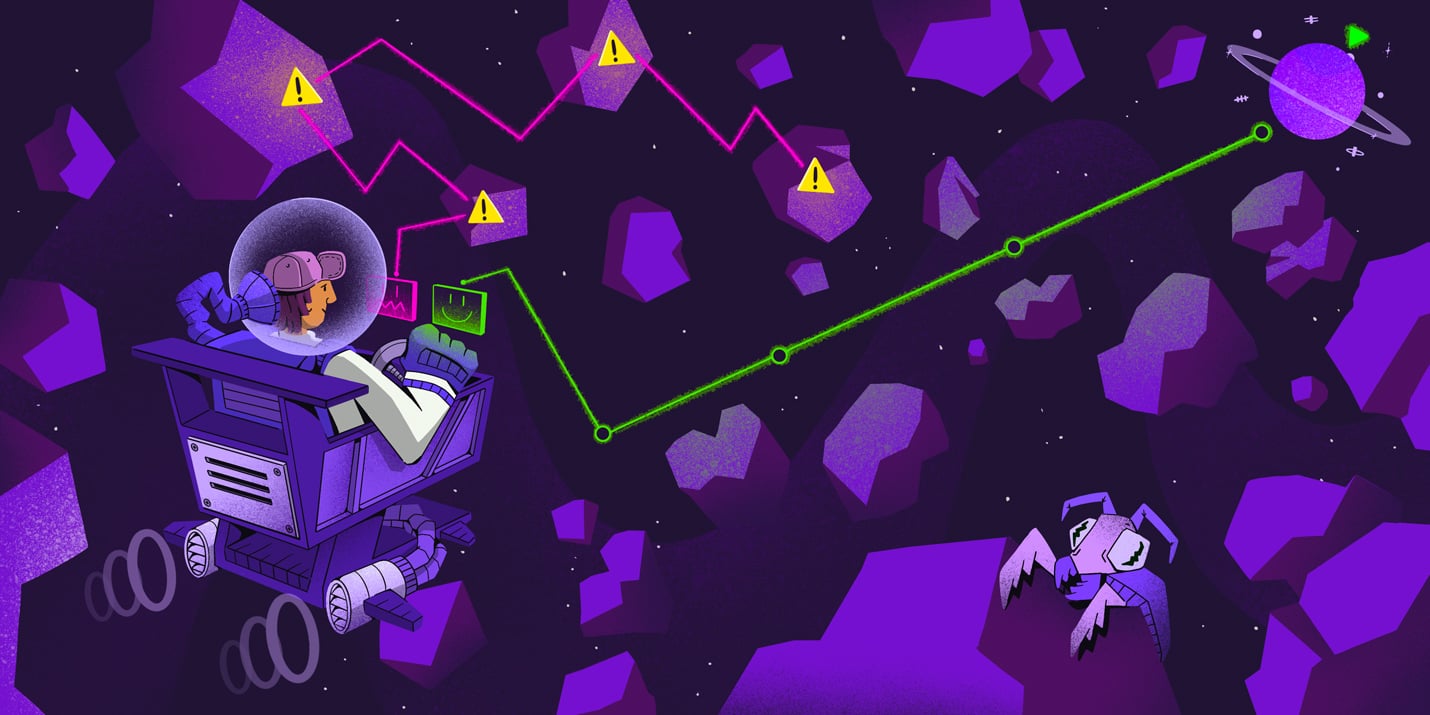
Sentry's Flutter SDK 10.0 makes streaming traces the default, fixes crash-free rate accuracy for unhandled errors, and adds dedicated app startup traces on Android and iOS.


The OpenTelemetry instrumentation packages needed a Node module loader, a package.json file, and a mutable exports object. v11 replaces all of that with a source transform and diagnostics channels, so tracing now works on Cloudflare Workers, Bun, Deno, and bundled server deployments.
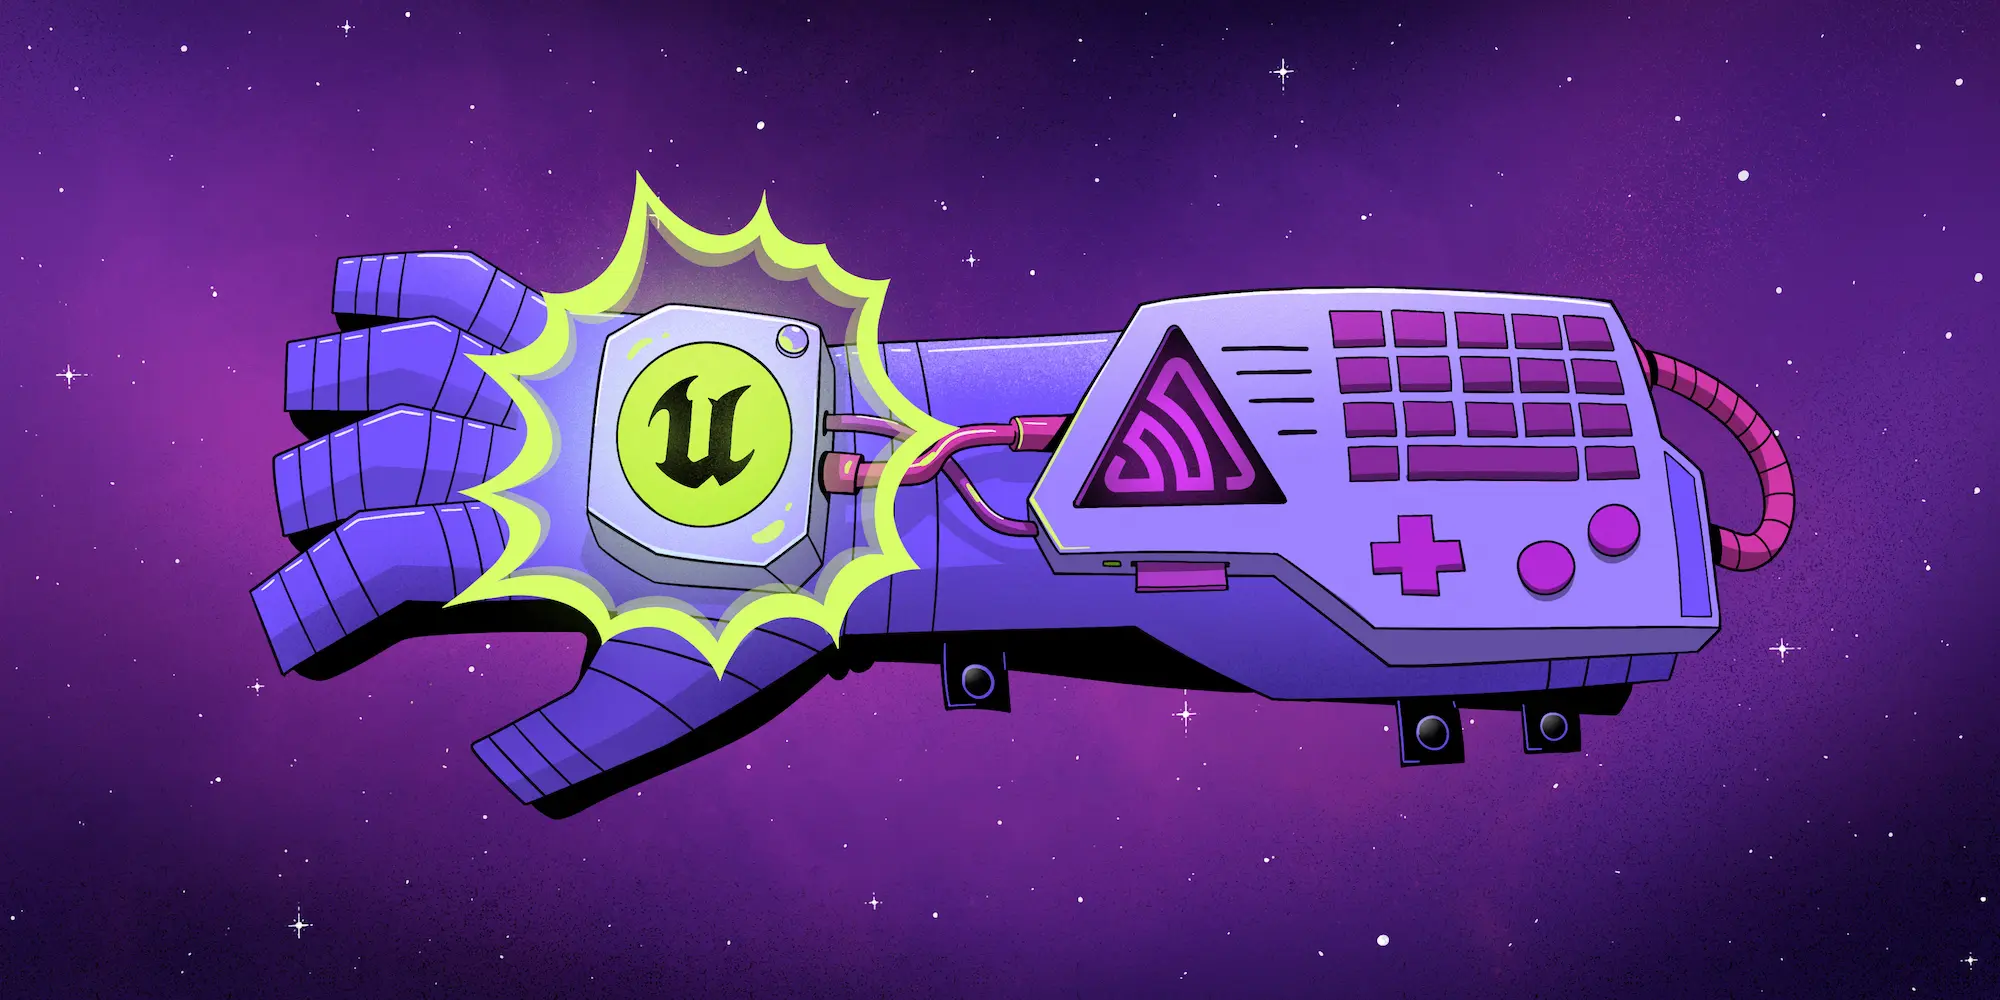
With Unreal Engine 5.8, your coding agent can drive the editor through Unreal MCP. The Sentry plugin adds tools and skills so it can set up Sentry, upload debug symbols, and root-cause crashes for you.
Should you use Seer or just connect the MCP to your agent? A breakdown of what Seer, the Sentry agent plugin, the CLI, and coding agent handoffs each do — and when to reach for one over the other.
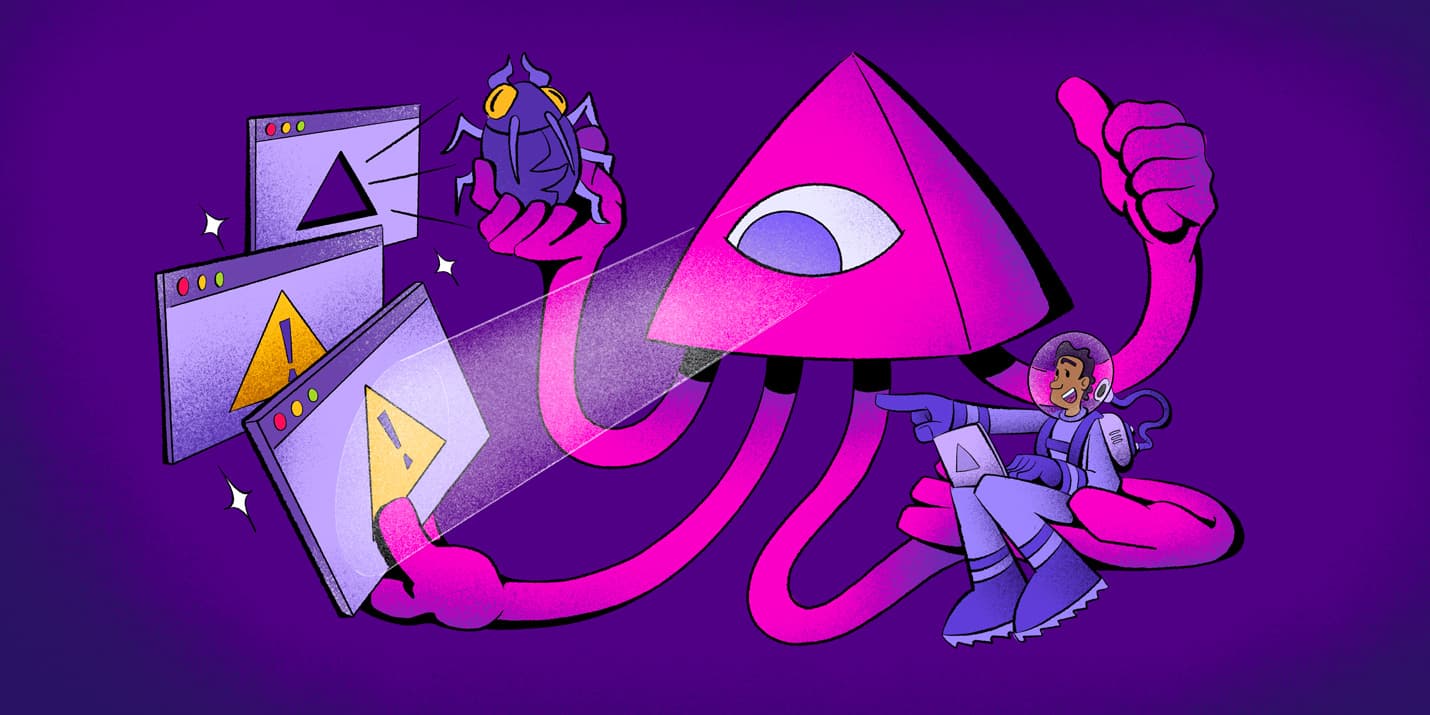
Five months after launch, Seer Agent can now take action on your behalf in Sentry, and pull in infrastructure data from outside Sentry to diagnose issues faster.


The all-or-nothing sendDefaultPii boolean is going away. dataCollection replaces it with a dial for each category of data, so you can keep the headers you debug with and drop the values you would rather not store.

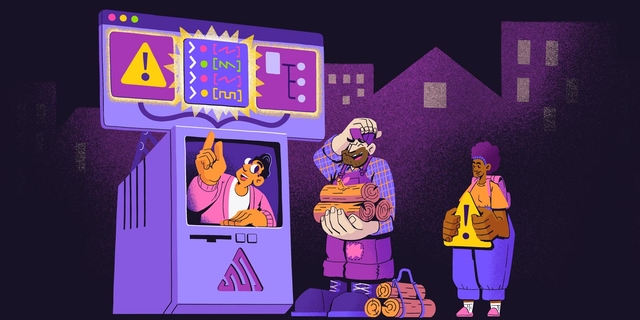
A full roundup of everything that shipped for Sentry Logs this summer — log pinning, overhauled exports, chart enhancements, terabyte-scale search, and a pile of usability fixes.


A stack trace tells you where your game died, not why. Session Replay for the Sentry Unreal Engine SDK attaches the last few seconds of gameplay to every crash report so you can watch what actually happened.

Version 2.0.0 of Sentry's Godot Engine SDK brings C#/.NET support and application metrics to general availability.


More code is shipping faster than ever, and most of it is no longer written by people. The speed is the story everyone tells. What matters more is what happens after the code ships, where software is starting to notice it is broken, understand why, and write the fix itself.

We trained and deployed a new issue grouping model that prevents 20% more duplicate issues, halves incorrect merges, and makes future model upgrades trivial.


Sentry Snapshots is in beta. Diff screenshots on every commit, block the PR if there are visual changes, and use snapshots as context for AI agents.

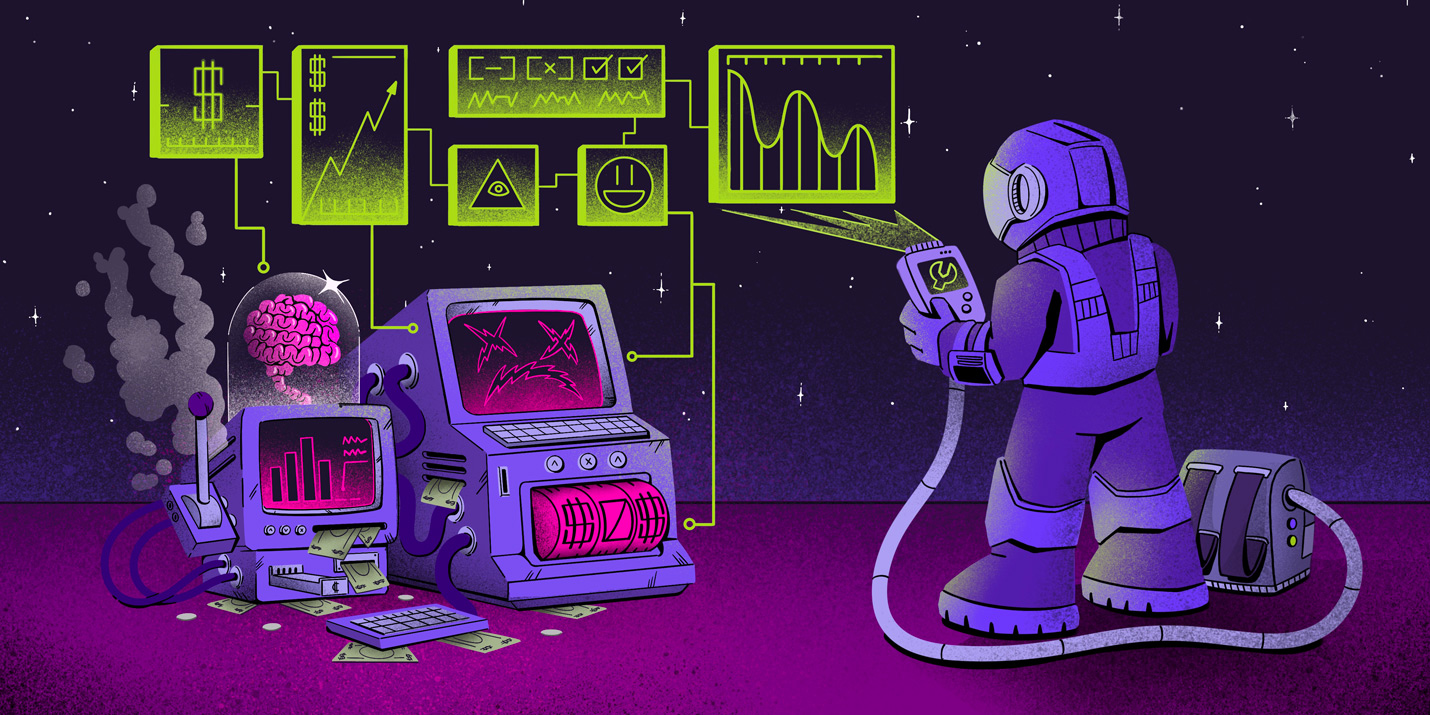
You already have everything you need. Your Sentry traces, logs, and metrics can answer most product analytics questions without a separate tool.


Sentry dashboards just got a major upgrade: create dashboards with AI agents, manage them via the CLI, and clone pre-built templates for common monitoring use cases.