Sentry’s AI debugger now references traces for troubleshooting distributed systems
Sentry’s AI debugger now references traces for troubleshooting distributed systems


Debugging is an ever-present pain for all developers, and that will continue despite, or maybe even thanks to, the rise of AI-written code. Tools like Sentry have been around for a while to help us engineers track and debug issues, but it’s tempting to make that process even faster and easier with some shiny new AI tools.
Sure, I could just copy-paste the exception’s stack trace from Sentry into ChatGPT, but what if I really wanted something smart? Something that had a lot more context to help the AI do its best job? Something with a deep understanding of distributed systems, capable of debugging them in production?
This post covers how we built Seer, Sentry's production-grade AI debugging assistant, with the power of tracing.
Where does debugging with AI fall short?
Seer and its Autofix feature has been a great tool to find the root cause of problems and fix them, thanks to using Sentry’s issue details and a tight integration with your codebase. Autofix uniquely works together with developers to help them understand issues better at their root, plan effective solutions, and even draft pull requests to fix them–with unit tests to prevent regressions too. Historically, behind the scenes it primarily relied on the stack trace and breadcrumbs from Sentry, along with codebase search, to get its insights. In fact, Autofix has already been a great help to lots of developers, fixing bugs in all sorts of applications–even bugs in Autofix itself.
Sometimes, however, Autofix was still missing the mark. For example, if you ran Autofix on a “500 Internal Server Error” reported by the frontend, it wouldn’t be able to figure out the issue on the backend. Or, if you had an authentication issue between two microservices, Seer couldn’t really know what was going on. And for complex applications in general, it had little idea of how and why the module at the source of the error was being used.
This is where tracing comes in. With traces, Seer has a clear picture of the flow across multi-service systems (including solutions with multiple tiers, such as frontend and backend, or that use various microservices), connected errors, and the exact operations that occurred around the error–and with profiling enabled, even the exact function calls. This lets Seer analyze problems across projects and repositories at great speeds, and autonomously debug some of the most complex issues engineers encounter in the real world. In comparison, copy-pasting into a chatbot only scratches the surface.
What even is a trace, and how can I make use of it?
Feel free to skip ahead if you’re already familiar; otherwise here’s a quick explainer.
Tracing captures the flow of requests through your application and its services, providing a detailed picture of how data moves and where potential issues arise. It helps identify performance bottlenecks, errors, and dependencies in distributed systems by recording the sequence of events involved in a transaction or request.
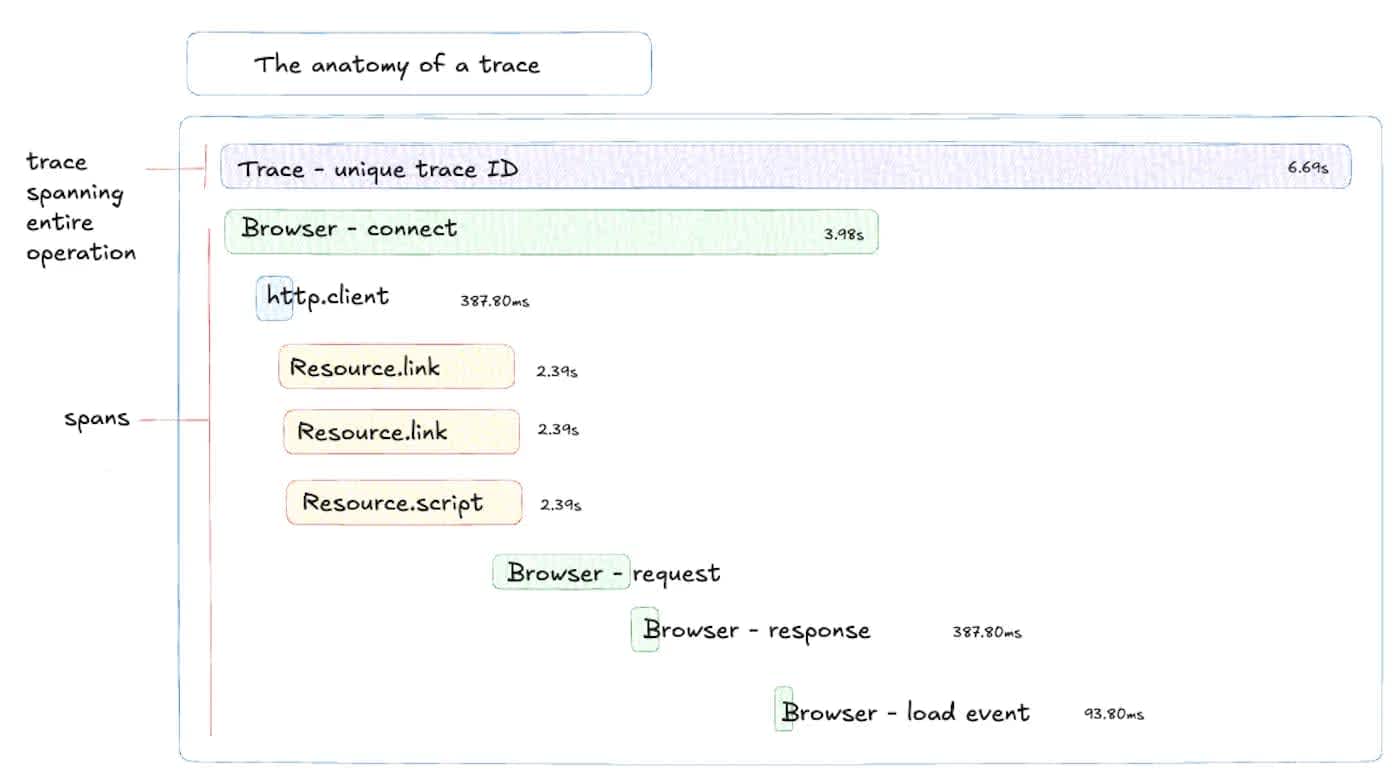
Each step within a trace is called a "span," representing a unit of work like a database query, an API call, or a function execution. By assembling these spans, you get a comprehensive view of the entire transaction's journey, from the initial request to the final response. Tracing is particularly valuable for debugging and optimizing complex microservices architectures.
Sentry makes it easy to get started with tracing. A lot is automatically instrumented when you add one of the Sentry SDKs to your apps, and you can optionally instrument custom spans and attributes later. For example, in Python, all you need to do to enable the standard tracing collection in the SDK is:
sentry_sdk.init(
    # ...

    # Set traces_sample_rate to 1.0 to capture 100%
    # of transactions for tracing.
    # We recommend adjusting this value in production,
    traces_sample_rate=1.0,
)
Step 1: Giving Seer system-wide context in its first prompt
First, our goal was to give Seer insights into the system as a whole, how services are interacting, and any connected issues to help debugging with Autofix. Luckily, Sentry has all the data we need to accomplish this, but it may be too much data. A trace can contain hundreds, if not thousands, of spans across multiple services, many of which may not be relevant to the issue. How do you feed traces to a large language model without it getting confused and wandering into endless dead ends?
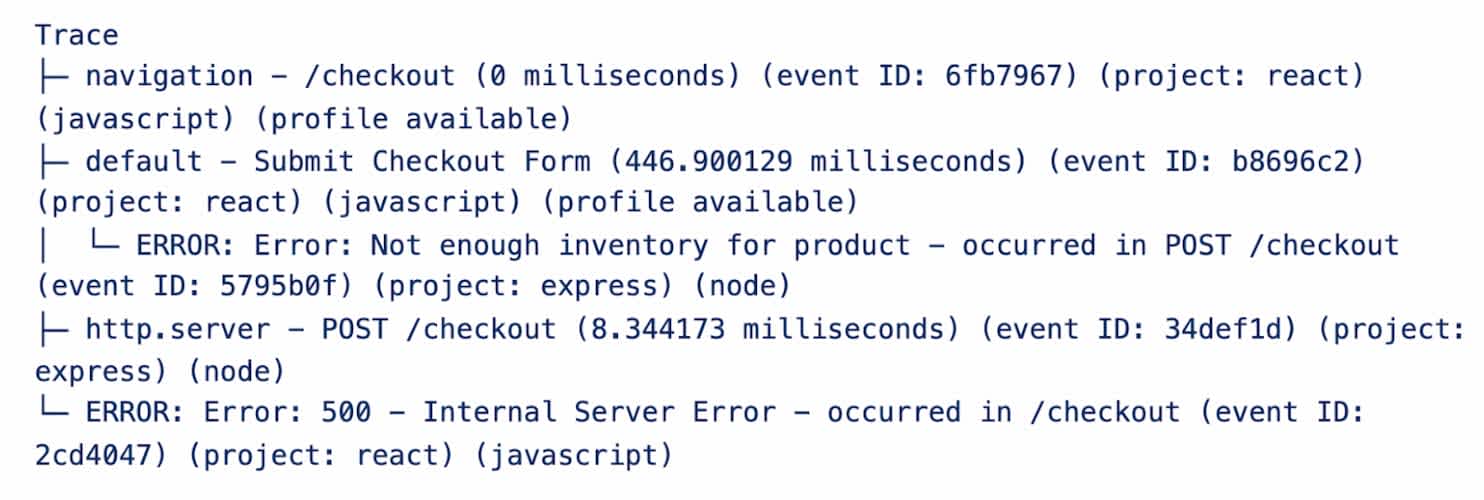
Fortunately, traces in Sentry have a concept of service boundaries, known as transactions, that help us filter down. These could include page navigation, endpoint calls, and other large units of work in our application. With that, we could build a condensed system-overview for Seer: a tree of nested and connected transactions. We could also mention connected error events that occurred within these transactions.
After constructing this tree data structure, we can format it as text for our LLM:
Immediately, Autofix started being more aware of the context surrounding the issues it was debugging, finding more accurate root causes and more effective solutions.
Step 2: Enabling Seer to Dig Deeper When Necessary
A high-level overview is a good start, but we shouldn’t just throw away all that rich, granular data–who knows when it could come in handy? The AI is in the best position to judge what information it needs while problem-solving. As a result, our solution is to give it tools it can use at will.
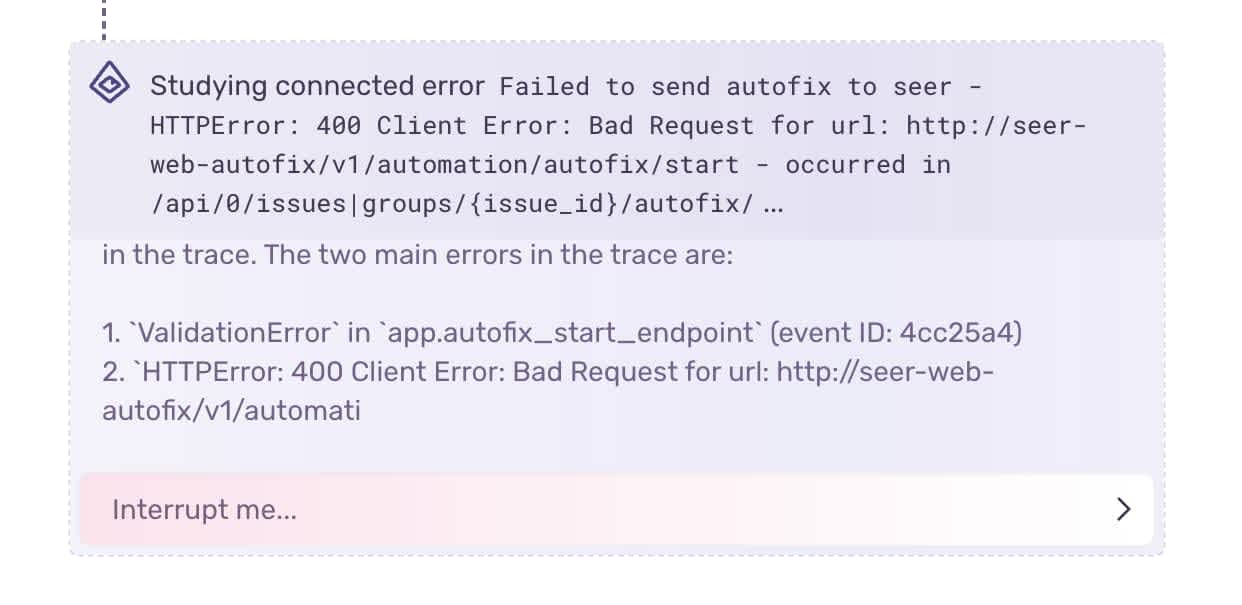
The first tool we gave Seer allowed it to study connected errors. Our high-level trace tree mentions other errors in the trace by name and ID, so Autofix can plug in that ID and view the stack trace and other issue data for that error. As an example, take an `InternalServerError` on the frontend. Seer can now see exactly what the backend error was, where it occurred, and why it happened.
Similarly, we let Autofix plug in a transaction ID from the trace tree to view the spans contained in that transaction. If more granular data of what happened in the system is ever helpful, the data is now available.
Finally, we created a tool to view CPU profiles. Any given transaction may have a profile of it, showing an exact record of the functions called at runtime and their durations. This is potentially invaluable for Seer to reproduce bugs, and one more tool to plug in a profile ID is all we needed.
Step 3: Putting these capabilities to use in day-to-day debugging
Now that we had built these capabilities into Seer, allowing it to leverage the full suite of data provided by Sentry, it was time to let developers put them to use. We introduced a settings pane for users to select the relevant repositories to make available to Seer for each of their Sentry projects. With that, Autofix could then search across repositories. And once access is granted, using traces across projects, Autofix can automatically infer which repositories it should be analyzing for any given issue.
As a result of all this trace-connected context, Autofix can debug cross-service issues and even make pull requests in multiple repositories at once.
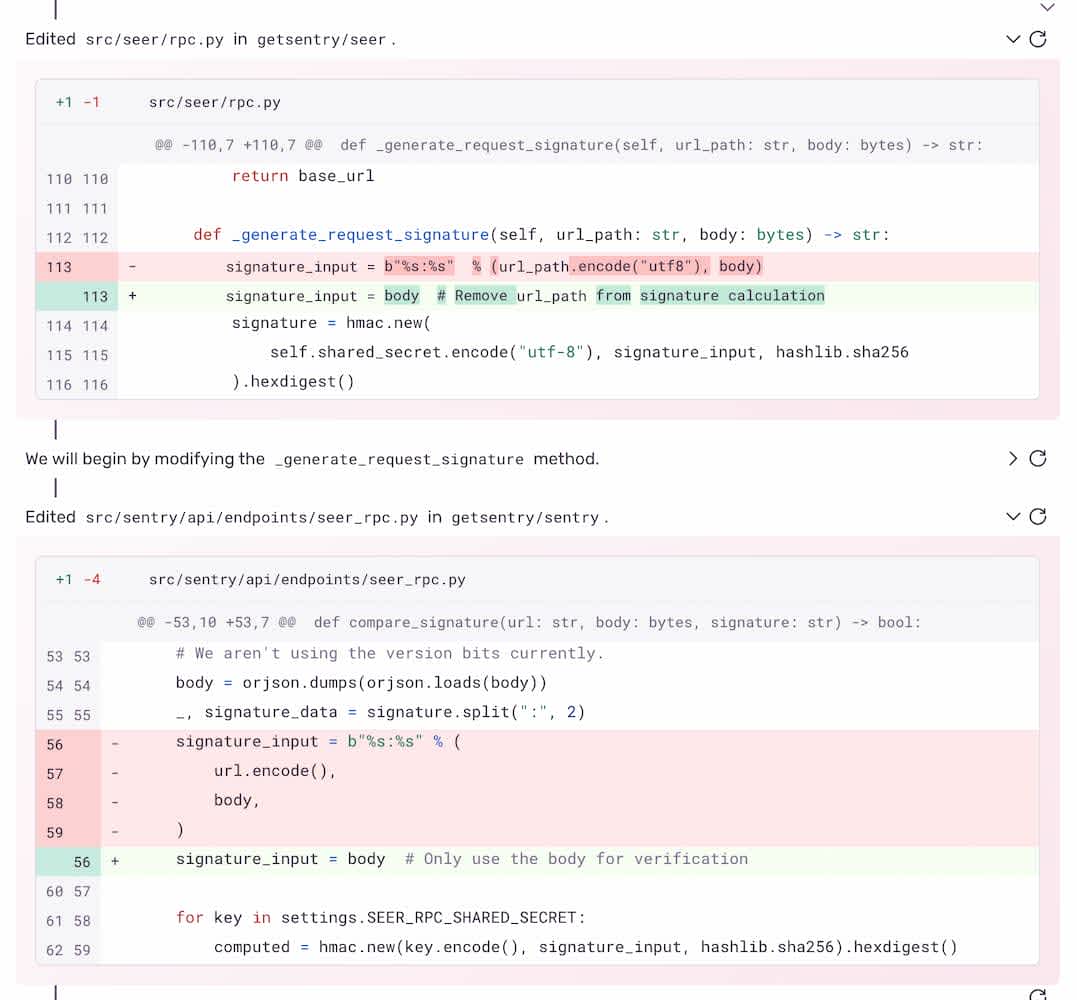
In a real-world example, we had an authentication issue between Sentry’s backend and Seer, Sentry’s AI microservice. It was a longstanding issue, but Autofix successfully found the root cause that we had been struggling with ourselves, and opened a PR in each repository to fix the issue. In the past, similar issues took us 2-3 days to work through manually.
Debugging doesn’t have to be so hard
Seer could’ve easily remained a tool for quick and superficial root causes and code patches. But with the deep context provided by traces, we’ve made it a powerfully capable assistant in debugging the hardest of bugs, even in complex architectures with many distributed services. And when integrated tightly with all of Sentry’s other contexts–stack traces, breadcrumbs, HTTP requests, profiles, and much more–debugging production systems with AI is finally a reality.
Try Autofix for yourself.


