Sentry Application Monitoring for Next.js
Sentry Application Monitoring for Next.js
As you could probably tell from the title, we shipped an SDK for Next.js. This means you can capture errors, measure performance, manage releases, configure suspect commits, and automatically upload sourcemaps to view unminified JavaScript and TypeScript with zero(-ish) configuration.
Why was Next.js next on our list? Well, it’s one of the fastest-growing React frameworks and developers love it. Next.js provides a developer experience that helps with building features rapidly, seeing local changes quickly, and reducing build times.
Next.js turns traditionally complex decisions into simple implementation details. Spinning up new pages with our existing React components and Material UI went from days to hours with Next.
Sean Parmelee, Applications Architect, Care.com
To monitor Next.js projects in the past, you had to install our @sentry/node and @sentry/react SDKs — installing both and configuring your environment correctly was time-consuming and literally no fun. The new Next.js SDK does all that for you, and works swimmingly with our Webpack Plugin or sentry-cli to upload your source maps.
To get started with Sentry for Next.js, simply install the SDK:
yarn add @sentry/nextjs
And then configure:
npx @sentry/wizard -i nextjs
Configure performance monitoring by setting a tracesSampleRate when you initialize the SDK, in both sentry.client.config.js & sentry.server.config.js :
Sentry.init({
// ...
tracesSampleRate: 1.0
});Once you’ve done that, frontend transactions will be captured automatically. To capture API request transactions, wrap your handlers in our withSentry helper. (Hint: If you’re already using our SDK to capture errors in those routes, you will have already done this. No extra configuration needed.)
import { * as Sentry } from ‘@sentry/nextjs’;
Sentry.init({ ... });

function handler(req, res) {
  // ...
}

export default Sentry.withSentry(handler);
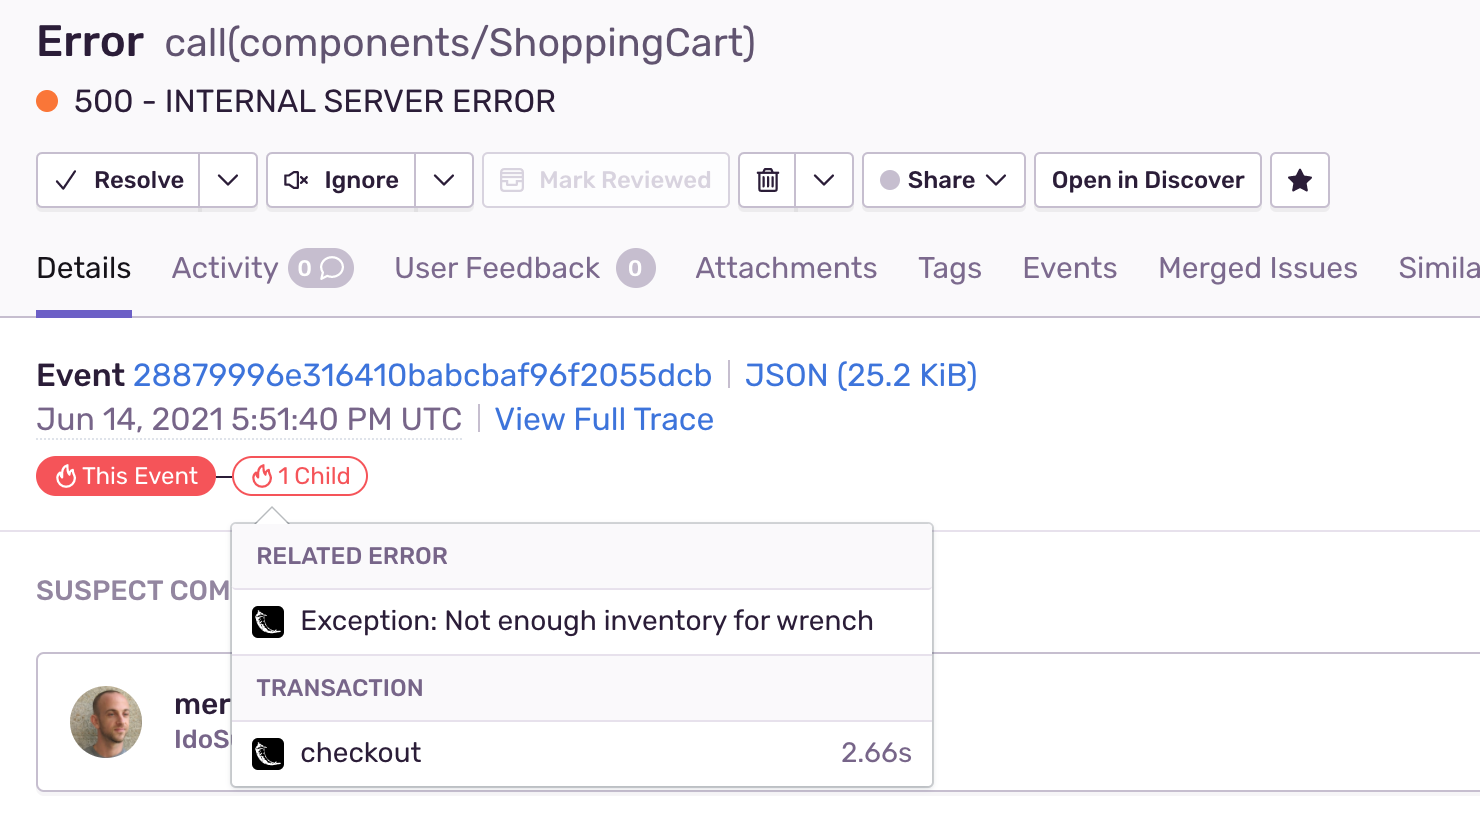
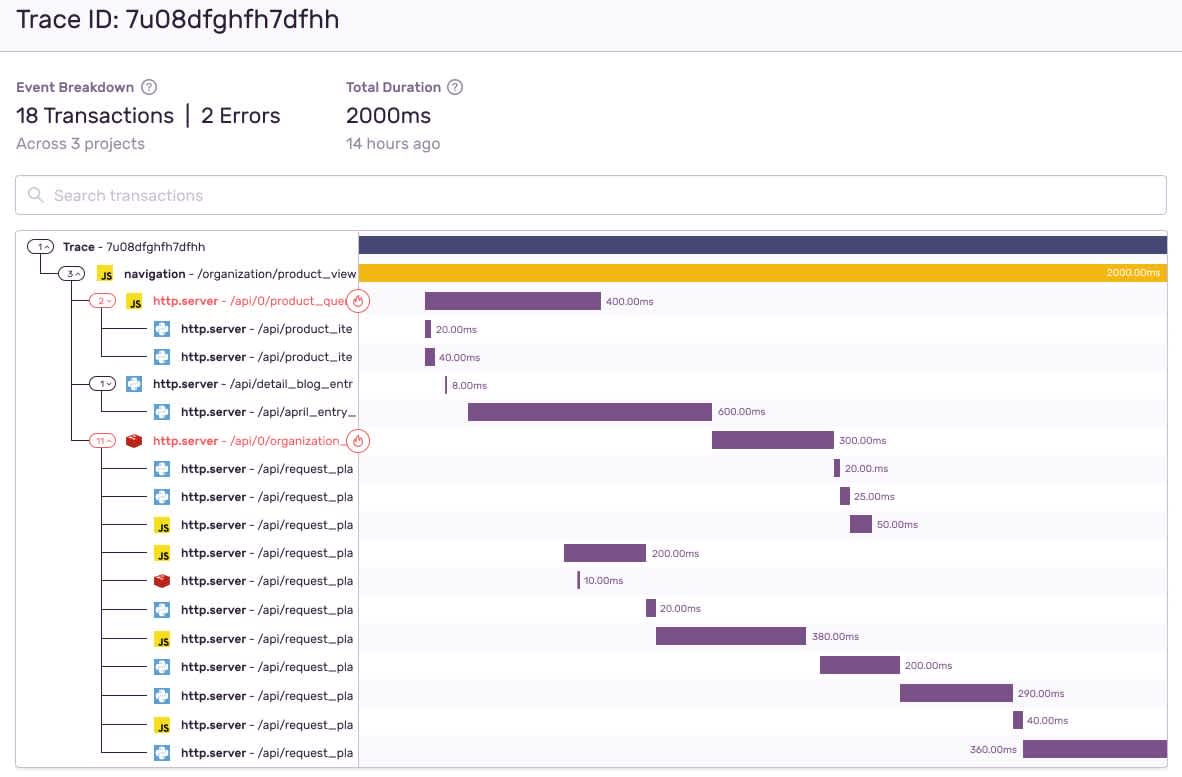
You can quickly track down poor-performing APIs or slow database queries. With new features like Trace Navigator, Trace View, and Suspect Tags, Sentry connects frontend issues to root causes in the backend and vice versa.
Trace View gives a waterfall view of a given transaction and dependencies across all projects on a single screen.
Early adopters of our SDK — like Stefen Alper, Co-Founder of eesel, a content search and centralization tool — are already using Sentry for Next.js to capture errors. Now they (and you) can also capture performance data.
We moved to Next.js for the dev experience and the scalability. As longtime users of Sentry’s error monitoring offering, we’re looking forward to start monitoring performance and managing releases with Sentry’s new Next.js SDK.
*Stefen Alper, Co-Founder, eesel.app *
Install our Next.js SDK and get a pretty good idea of which commit caused the issue and who is likely responsible, and automatically upload source maps so your stack trace looks like the original code you wrote. Also, join us on June 24th, 2021 for a live workshop on how to build, deploy, and monitor Next.js applications with Sentry and Netlify.
If you’re new to Sentry, you can try it for free today or write to sales@sentry.io to get started with application performance monitoring.


