Sentry Fall Semester: Web Vitals 101
Sentry Fall Semester: Web Vitals 101
To improve front-end performance in your application, it’s important to understand what kind of problems users are experiencing. They may be encountering slow load times, seeing unexpected shifts, or having trouble interacting with UI components. The question is, how bad is it? Is it perpetual-rage-click bad? Is it ditch-your-app bad? Is it rant-on-Twitter bad? Sentry wants to help prevent all kinds of bad, but first, we need to standardize what we're measuring so we can tell you just how bat-shit-bad it is.
Where to start
Sentry is doubling down on Google Web Vitals, a Google-driven initiative to guide great user experiences. Web Vitals quantifies specific milestones measured when a user navigates to a page. What makes these measurements better than all the measurements that came before? Their milestones tie directly to qualitative experiences. As an example, these are a few of Google’s Core Web Vitals:
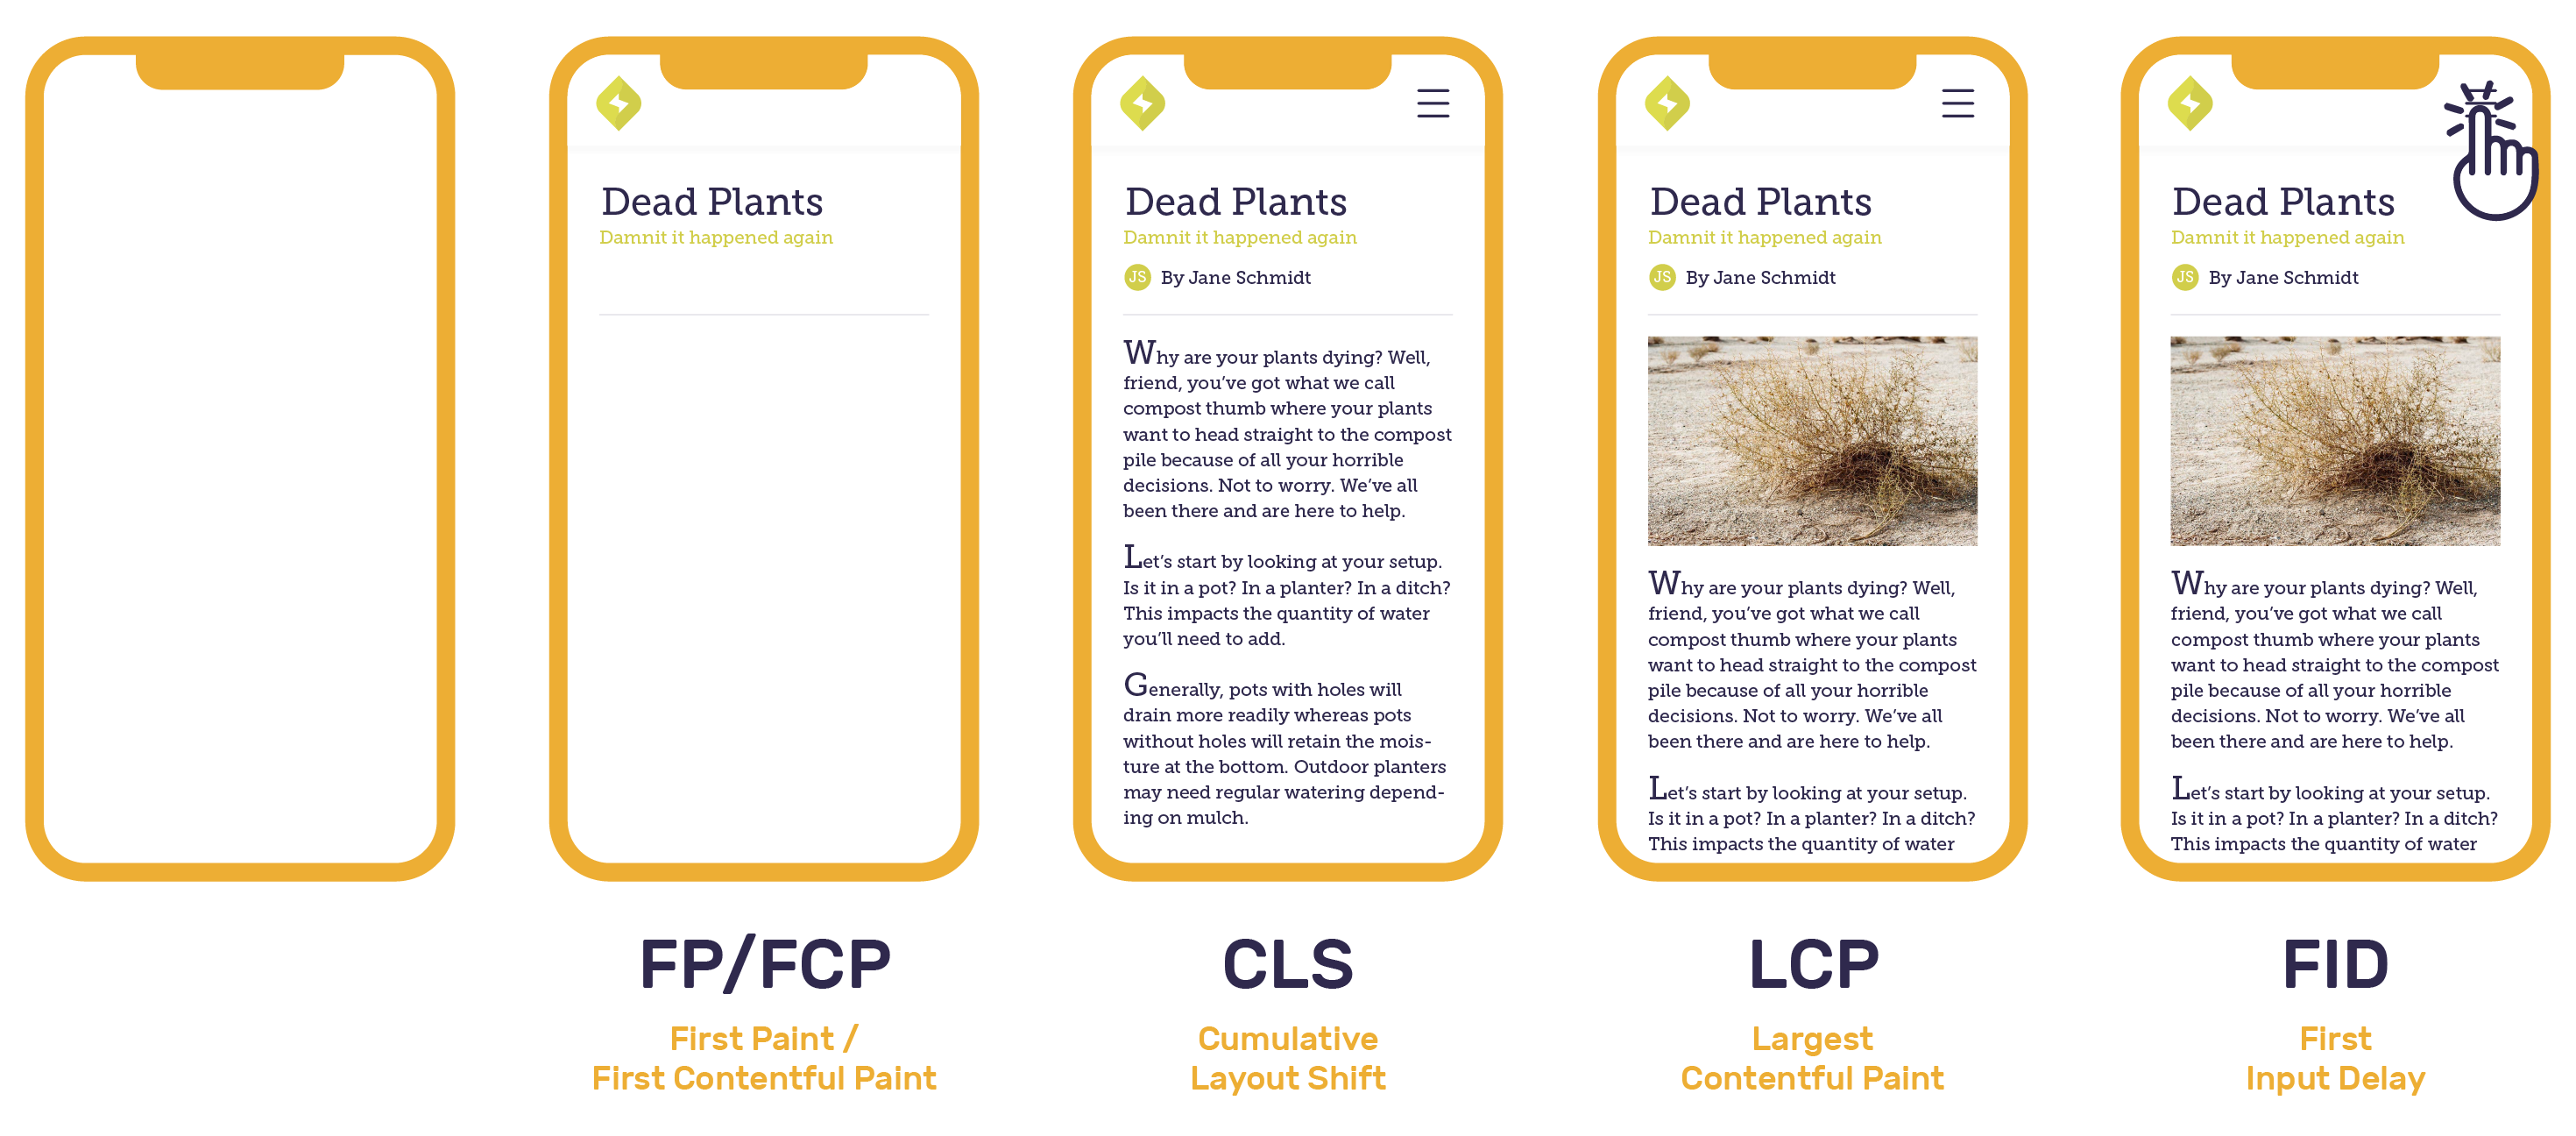
What the what? Each Web Vital is measured either in duration or fractions of change, starting from the exact moment that the user navigates to a browser page. Can’t quite picture it? Here’s a visual timeline in a mobile browser to explain some of these core Web Vitals (in addition to First Paint and First Contentful Paint).
Keep in mind: not everyone cares about the same Web Vitals. While Steve may want to know when content begins to load, Jesse may be more interested in when a button is clickable. To each their own. Figure out which “bad” matters to you in this quick Web Vitals overview.
First Paint (FP)
First Paint (FP) measures the amount of time the first pixel takes to appear in the viewport, rendering any visual change from what was previously displayed. This may be in the subtle form of a background color, canvas, or image. FP helps developers pinpoint the moment any changes begin to occur on the page.
First Contentful Paint (FCP)
First Contentful Paint (FCP) measures the amount of time the first content takes to render in the viewport. Like FP, this could also show up in any form from the document object model (DOM), such as images, SVGs, or text blocks. So then, what’s the difference between FP and FCP? While FCP is frequently identical with FP, FCP gives developers a better sense of how long users have to wait before they begin to perceive any notable content on the page such as a navigation bar.
Largest Contentful Paint (LCP)
Largest Contentful Paint (LCP) measures the render time for the largest content to appear in the viewport. Again, this may be in any form from the document object model (DOM), such as images, SVGs, or text blocks. It’s the largest pixel area in the viewport, thus most visually defining. LCP helps developers understand how long it takes to see the main content on the page.
First Input Delay (FID)
First Input Delay (FID) measures the response time when the user tries to interact with the viewport. Actions may include clicking a button, link, or other custom Javascript controller. FID provides critical data on successful or unsuccessful interactions on a page. This may be key for sensitive flows such as sign ups or checkouts.
Cumulative Layout Shift (CLS)
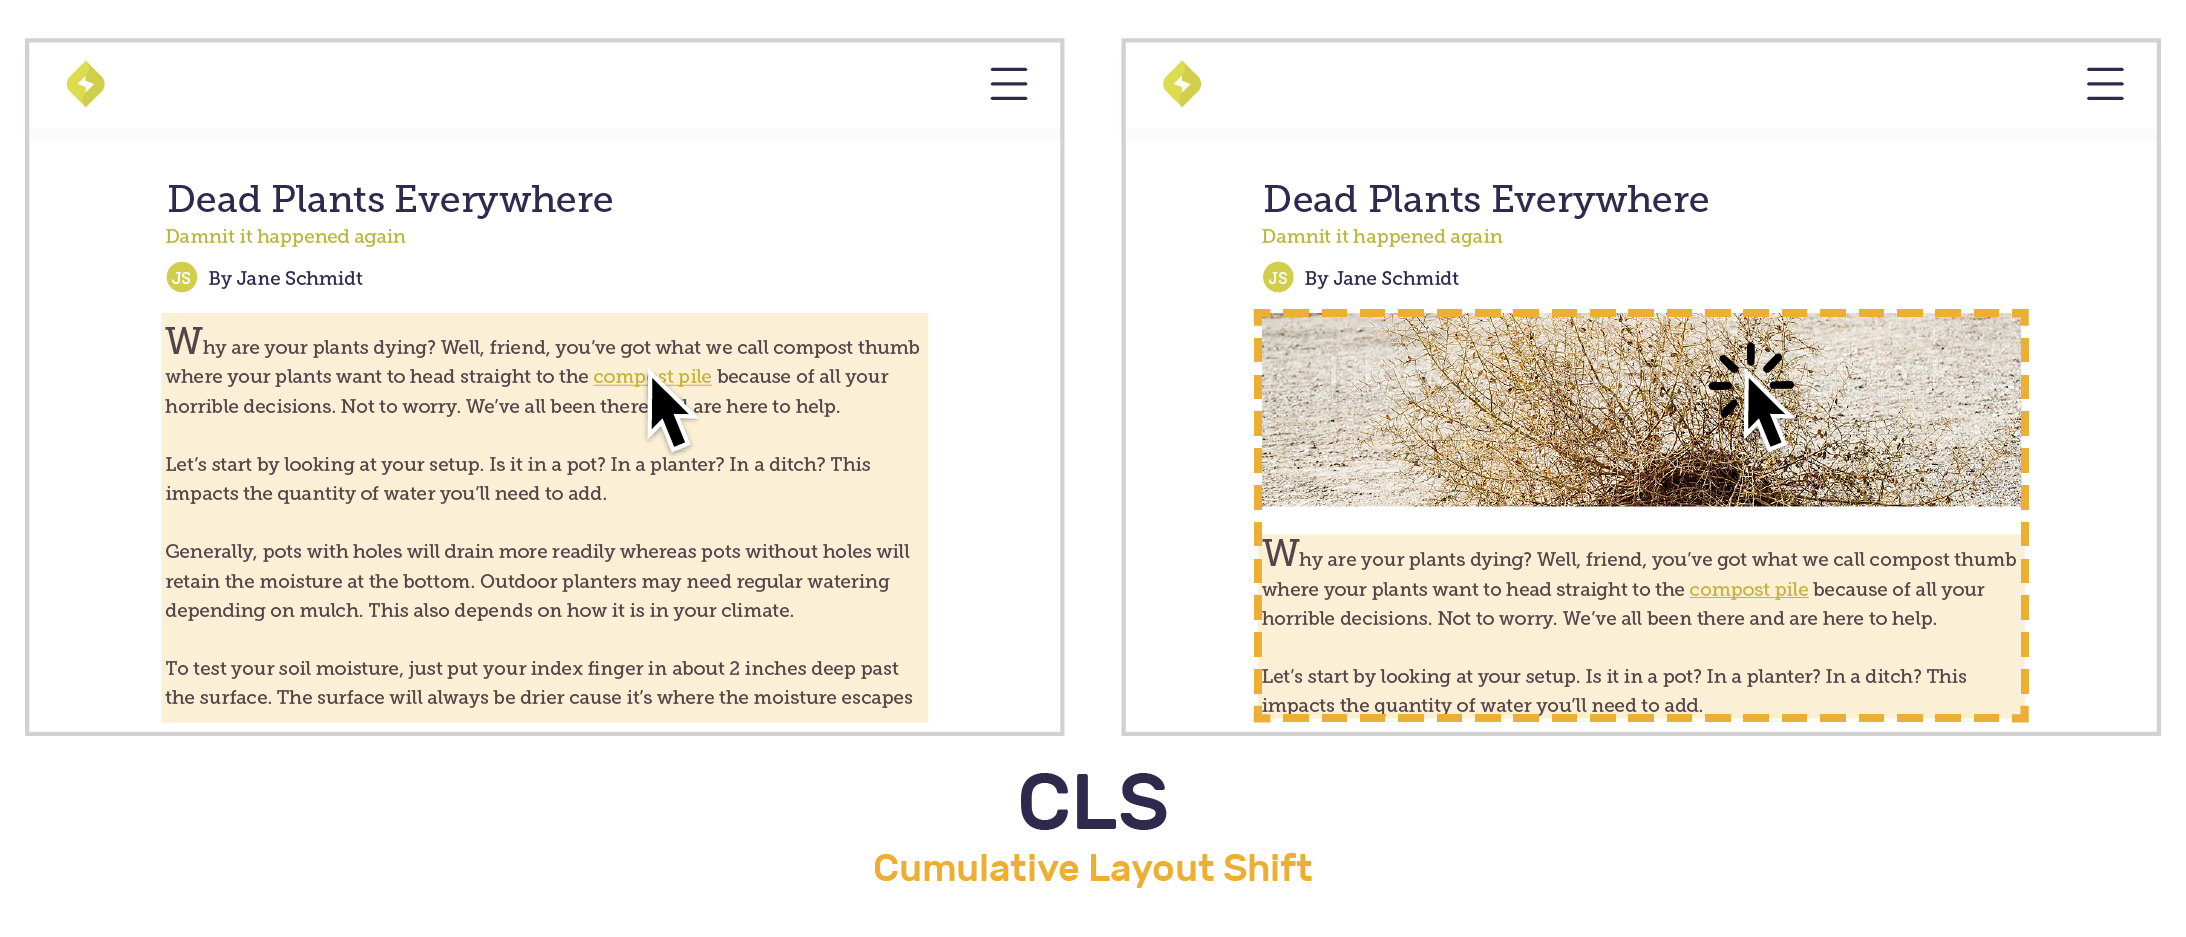
Cumulative Layout Shift (CLS) is the sum of individual layout shift scores for every unexpected element shift during the rendering process. Imagine navigating to an article and trying to click a link before the page finishes loading. Before your cursor even gets there, the link may have shifted down due to an image rendering. Rather than using duration for this Web Vital, the CLS score represents the degree of disruptive and visually unstable shifts.
Each layout shift score is calculated using an impact and distance fraction. The impact fraction is the total visible area that the element affects between the two rendered frames. The distance fraction measures the distance it has moved relative to the viewport.
Layout shift score = Impact Fraction x Distance Fraction
Let’s take a look at the example above which has one unstable element - the body text. The impact fraction is roughly 50% of the page and moves the body text down by 20%. Multiplying 0.5x0.2 gives you a product of 0.1, which is the layout shift score. Thus, CLS is 0.1.
Sentry + Web Vitals
Google Web Vitals can be viewed using the Google Chrome Lighthouse extension. You may be asking yourself, "Why would I need Sentry to see what these are if I already have Google?" Good question. Google provides synthetic lab data, where you can directly control your environment, device, and network speed. This is good and all, but it only paints part of the picture. Paint. Get it?
Sentry gathers aggregate field data on what your users actually experience when they engage with your application. This includes context on variable network speed, browser, device, region, and so forth. With Web Vitals, we can help you understand what’s happening in the wild, how frequently it’s happening, why, and what else is connected to the behavior.
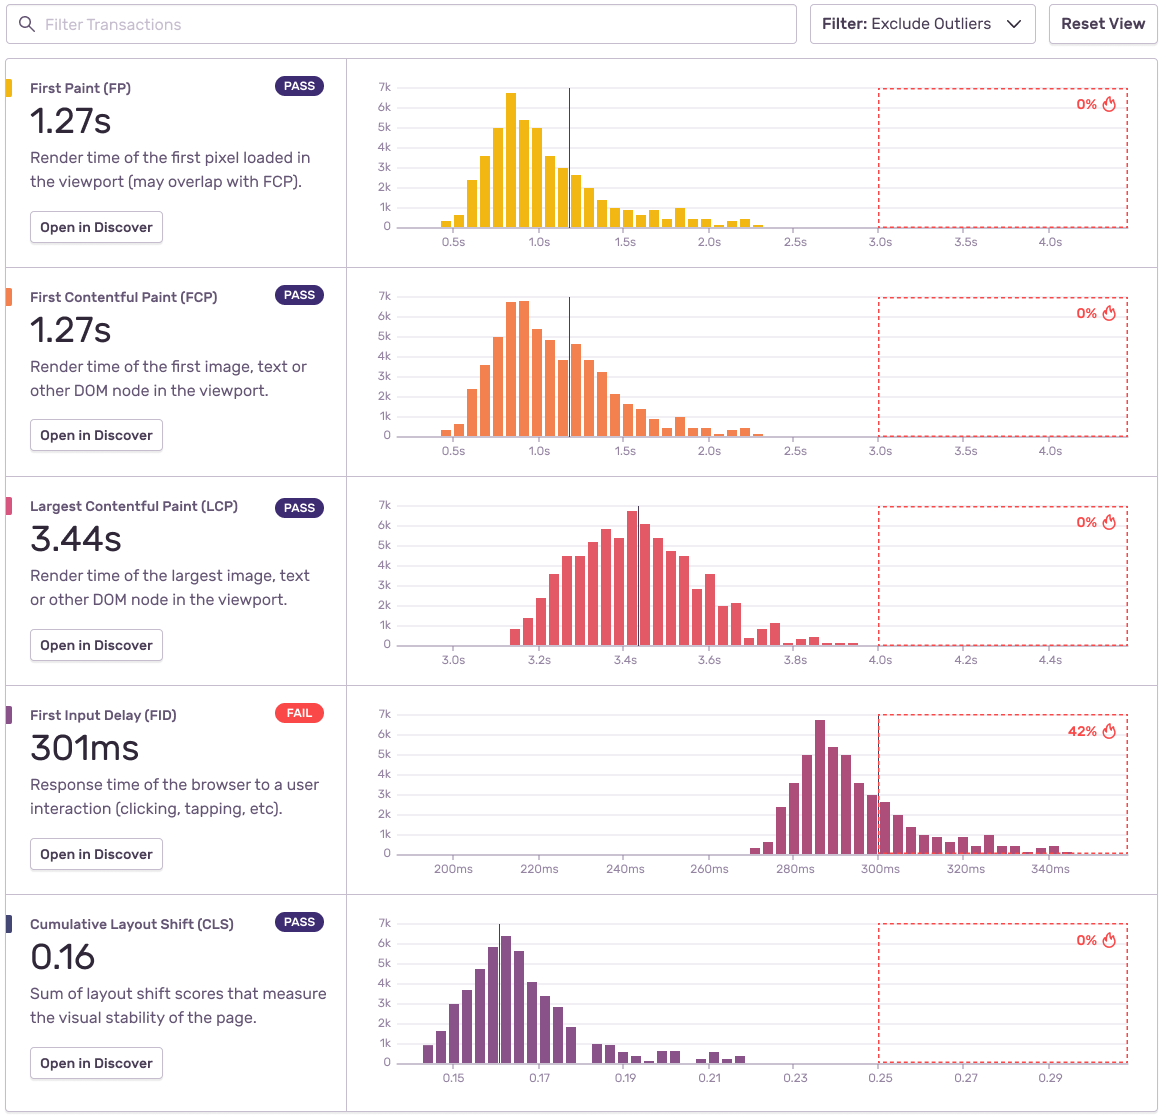
The performance features in Sentry have set up clear thresholds based on Google Web Vitals recommendations. At a macro level, you can see if important frontend transactions are largely passing or failing in our Web Vital histograms. Zoom in to any area in question to troubleshoot further using our query builder, Discover.
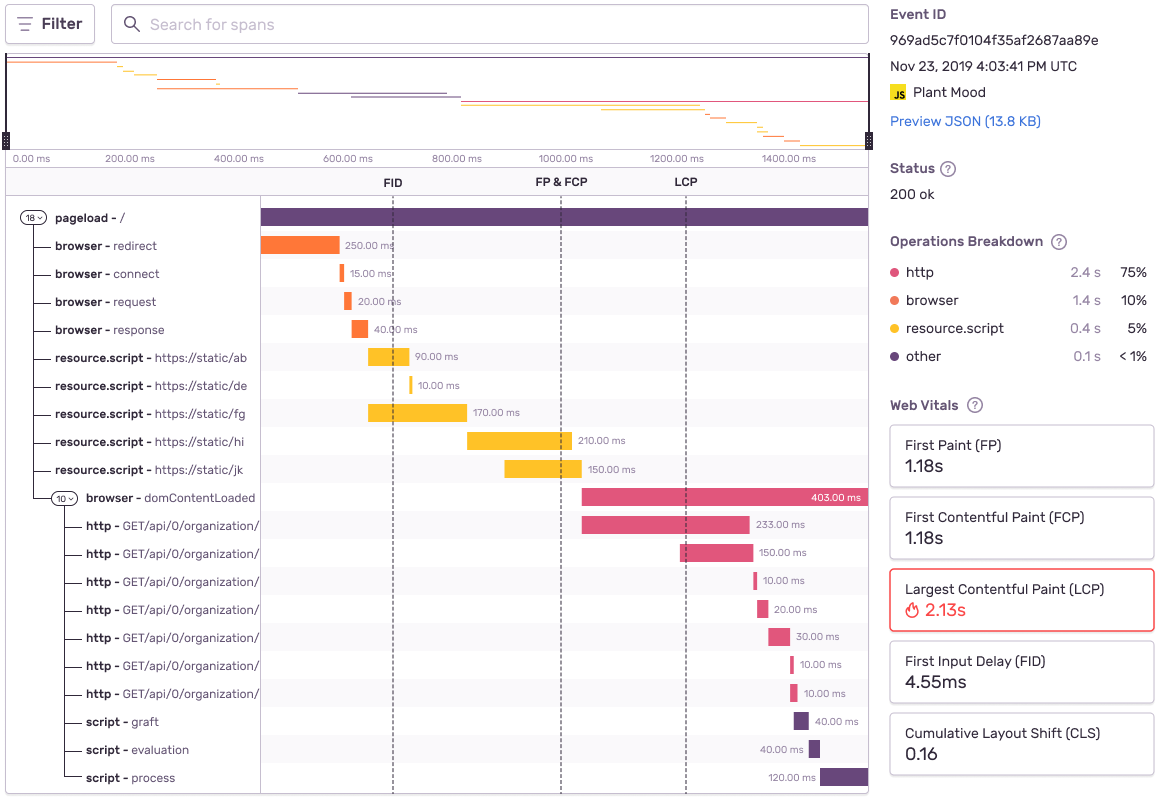
At a micro level, you can look at each event and determine the exact operations causing your Web Vitals to lag. We’ve overlaid when the Web Vitals occur in the trace view above. Dive deeper and investigate whether that extra call is worth doing before the LCP.
Start Monitoring Vitals
Sentry’s Performance Monitoring solution captures Web Vitals by default. If you haven’t already, install the Sentry tracing package (version 5.27.3 or higher) to start seeing frontend Web Vitals with your transactions.
npm install @sentry/browser @sentry/tracingWeb Vitals will be available with the following platforms and frameworks:
Javascript
React
Ember
Vue
Keep in mind Web Vitals may be different depending on the browser. Sentry is starting with Chrome, but some of the vitals (such as First Input Delay) are also used in Firefox, Safari, and Chromium. We’ll be increasing support for more vitals in the near future. If you’ve got some ideas or requests, lay ‘em on us. Contact performance-feedback@sentry.io.
Feeling shy about performance? No problem. Start your free trial and let us know it goes.


